MEMBERS ONLY
Short-Term Trend, Breadth and Intermarket Analysis

by Arthur Hill,
Chief Technical Strategist, TrendInvestorPro.com
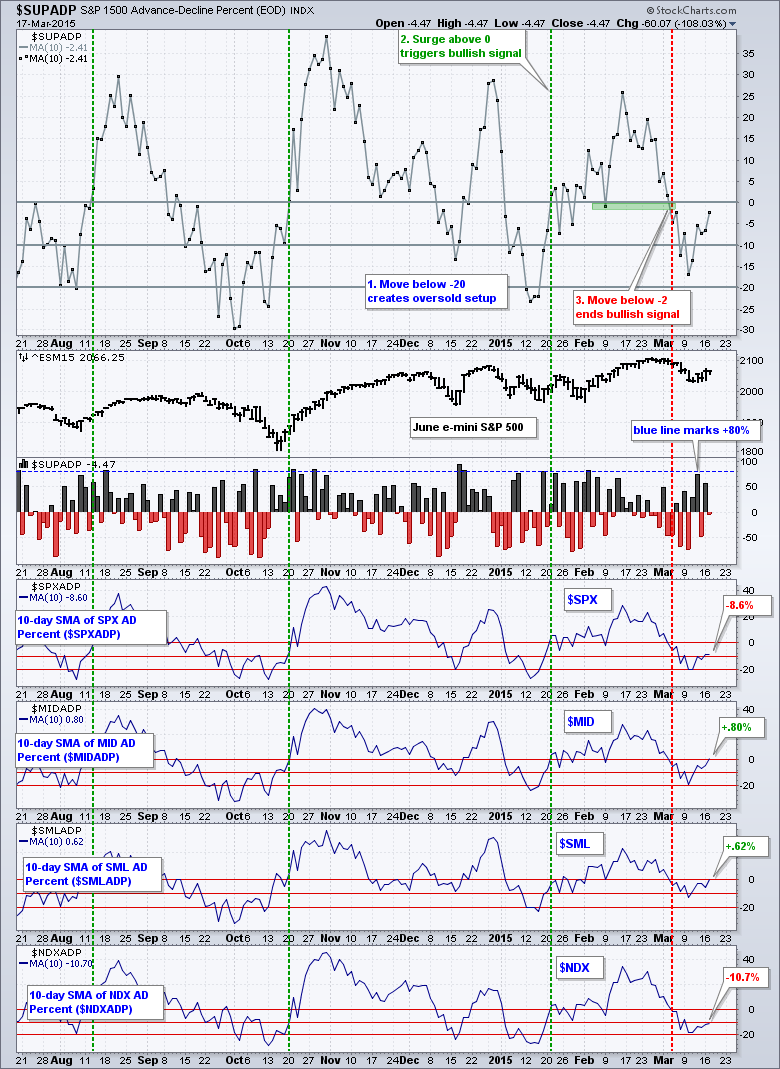
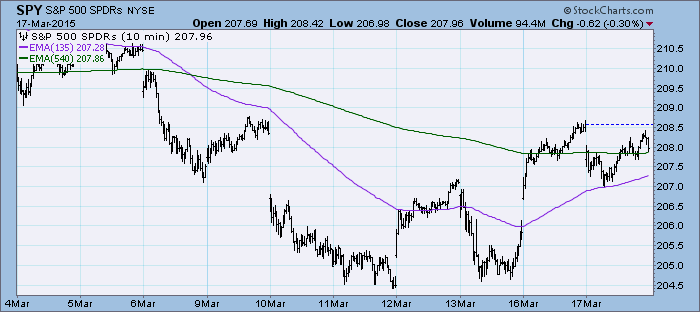
Is it volatile enough for ya? The S&P 500 fell to the 2062 area in the early afternoon (down around 14 points) and then shot higher with a move above 2105. The move from low to high was around 45 points and the index closed up 1.22%...
READ MORE
MEMBERS ONLY

FED DROPS PATIENT STANCE, BUT LOWERS GUIDANCE FOR FUTURE RATE HIKES -- STOCKS SURGE AS YIELDS TUMBLE -- RATE SENSITIVE STOCKS LIKE UTILITIES JUMP WITH BONDS, BUT BANKS LAG -- WEAKER DOLLAR BOOSTS COMMODITIES

by John Murphy,
Chief Technical Analyst, StockCharts.com
FED TAKES MORE DOVISH TONE... Today's Fed statement dropped its "patient" stance, but lowered guidance for any future rate hikes. Ms. Yellen emphasized that while the Fed was dropping the word "patient", it wouldn't be "impatient" to raise rates. A...
READ MORE
MEMBERS ONLY
Crane (CR) Confirms "W" Bottom, Testing Support

by Tom Bowley,
Chief Market Strategist, EarningsBeats.com
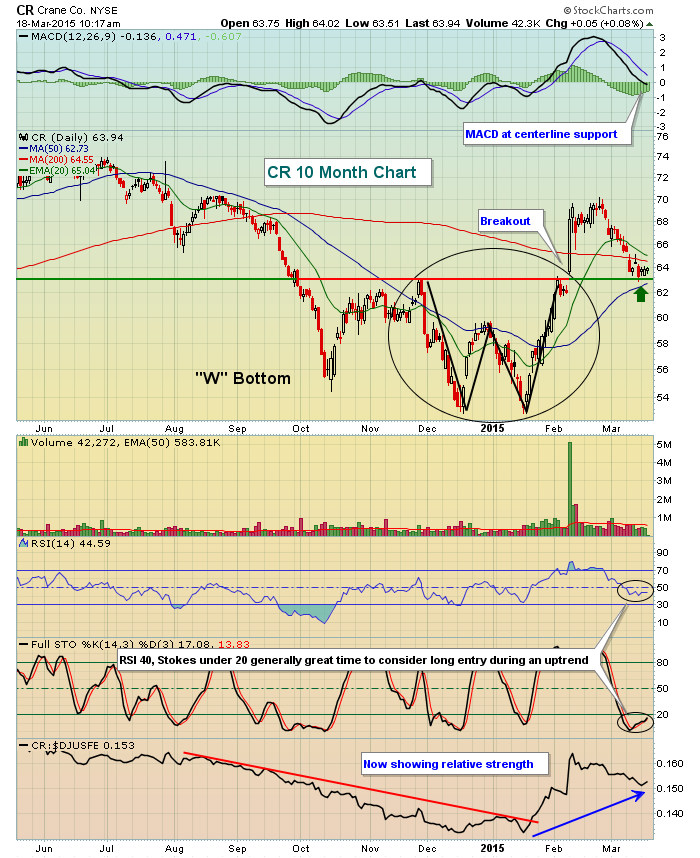
Crane (CR) is a part of the Industrial Machinery ($DJUSFE) space, which has been consolidating since last summer and is poised to break out once again. CR printed a "W" bottom in December and January, with this bottom confirmed with the high volume gap up and breakout in...
READ MORE
MEMBERS ONLY
The Two Strongest Sectors in March Are....
by Arthur Hill,
Chief Technical Strategist, TrendInvestorPro.com
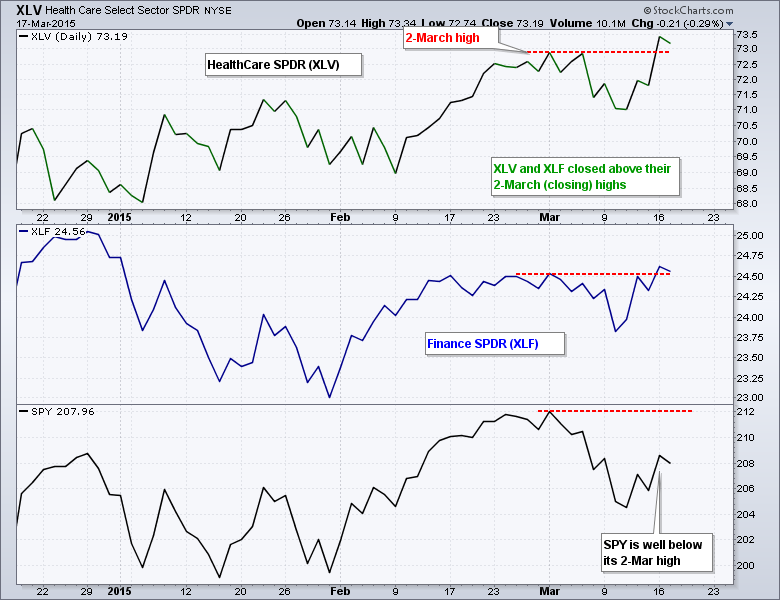
There are several ways to measure relative performance here at StockCharts. Chartists can use ratio charts (XLF:SPY), the StockCharts Technical Rank (SCTR) or Relative Rotation Graphs (RRGs). Chartists can also compare the respective price charts. The chart below shows closing prices for the HealthCare SPDR (XLV), Finance SPDR (XLF)...
READ MORE
MEMBERS ONLY
Short-Term Trend, Breadth and Intermarket Analysis
by Arthur Hill,
Chief Technical Strategist, TrendInvestorPro.com
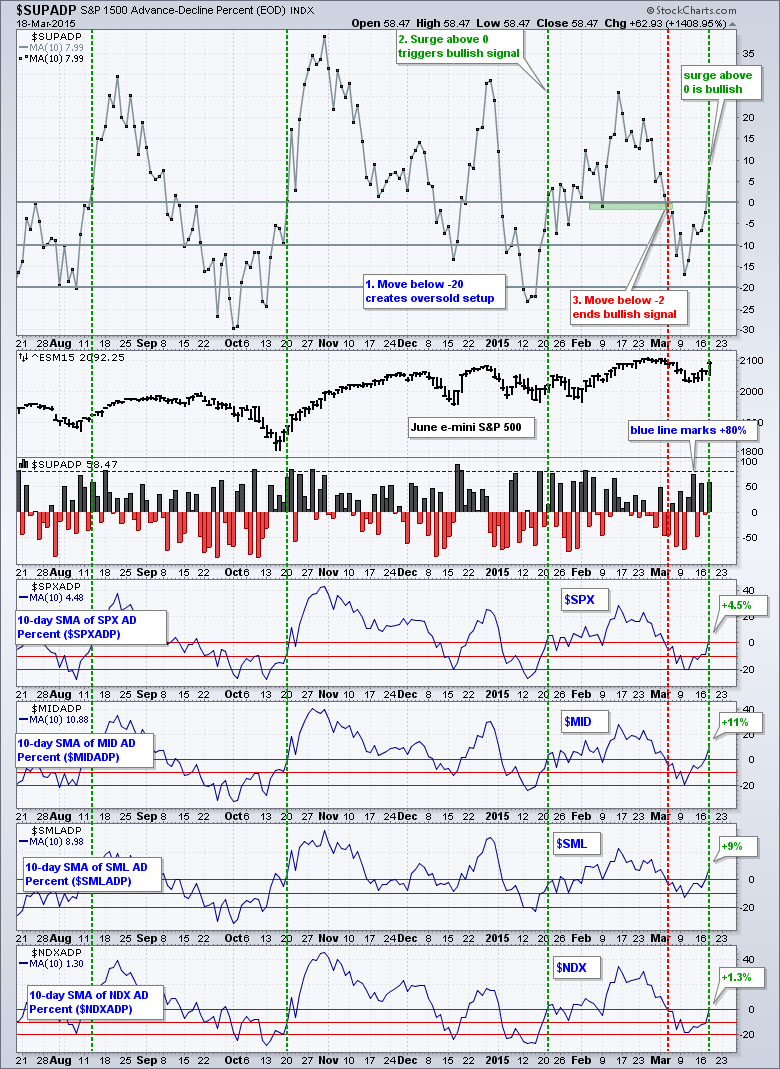
Stocks were mixed on Tuesday with large-caps closing lower and small-caps edging higher. Eight of the nine sector SPDRs were down with materials falling 1.11%. Energy shares were also weak. The Home Construction iShares (ITB) fell after housing starts disappointed, but ITB remains in an uptrend overall. Gold fell...
READ MORE
MEMBERS ONLY
DP Market Update: Holding Pattern Before FOMC Meeting - March 17, 2015

by Erin Swenlin,
Vice President, DecisionPoint.com
Price didn't do much today, spending the majority nearly all day in the red. After hitting the intraday low, it trended up and managed to recoup about half of the day's losses.
The purpose of the DecisionPoint Daily Update is to quickly review the day'...
READ MORE
MEMBERS ONLY

-- CHANNEL DEFINES SPY TREND, ITB, XHB AND FLAGS, REGIONAL BANK ETF, BIG TREND FOR TREASURIES, TLT HITS INFLECTION POINT, XLU FIRMS AT FIB LEVEL, CURRENCY ADJUSTMENTS FOR ETFS --
by John Murphy,
Chief Technical Analyst, StockCharts.com
CHANNELS RULE FOR SPY, MDY AND IJR... Upside momentum has slowed since the October-November surge, but the major index ETFs remain in clear uptrends defined by rising channels over the last few months. Chart 1 shows the S&P 500 SPDR (SPY) with a surge from mid October to...
READ MORE
MEMBERS ONLY
SPY Gets a Break Out - USO Sinks to New Lows
by Arthur Hill,
Chief Technical Strategist, TrendInvestorPro.com
Stocks got their mojo back as the S&P 500 opened strong, stayed strong and finished at the high of the day. The large-cap indices led the move with 1+ percent gains. Small-caps lagged as IWM gained only .59%. Seven of the nine sectors were strong. Energy stocks were...
READ MORE
MEMBERS ONLY

-- MIND THE GAP AND THE RELATIVE PERFORMANCE, TRANSPORTS BOUNCE AT FIB RETRACEMENT, TRUCKING AND AIRLINES LEAD, 3 TRUCKING LEADERS, 2 AIRLINE LEADERS, 3 LEGACY AIRLINE STOCKS --
by John Murphy,
Chief Technical Analyst, StockCharts.com
MIND THE SMALL CAP GAP AND RELATIVE PERFORMANCE... Link for today's video. The Russell 2000 iShares (IWM) and the S&P SmallCap iShares (IJR) both gapped up last week and these gaps are holding. Moreover, small-caps have been showing relative strength since mid October and their respective...
READ MORE
MEMBERS ONLY
Understanding PMO Rankings With Hot and Cold Group & Blinkers

by Carl Swenlin,
President and Founder, DecisionPoint.com
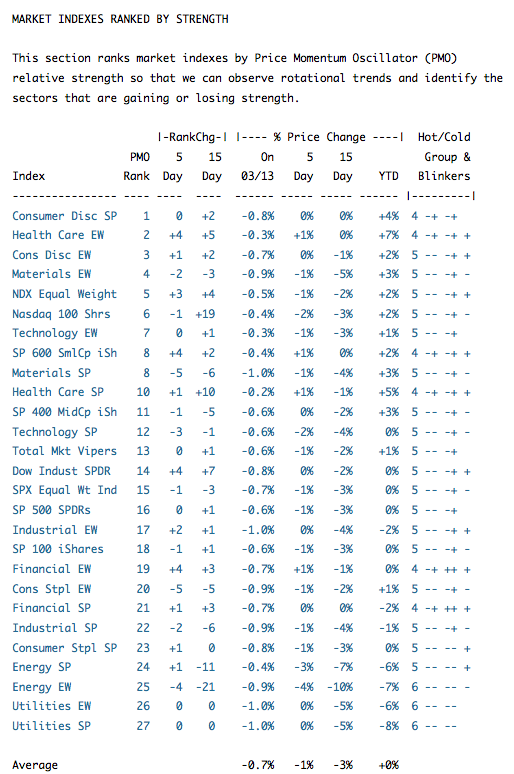
In the DecisionPoint Daily Report and Tracker reports we sort the lists by PMO (Price Momentum Oscillator) rank using the current PMO value and listing the stocks/indexes from the strongest to the weakest, but as usual, we can't take the rankings at face value. There is more...
READ MORE
MEMBERS ONLY
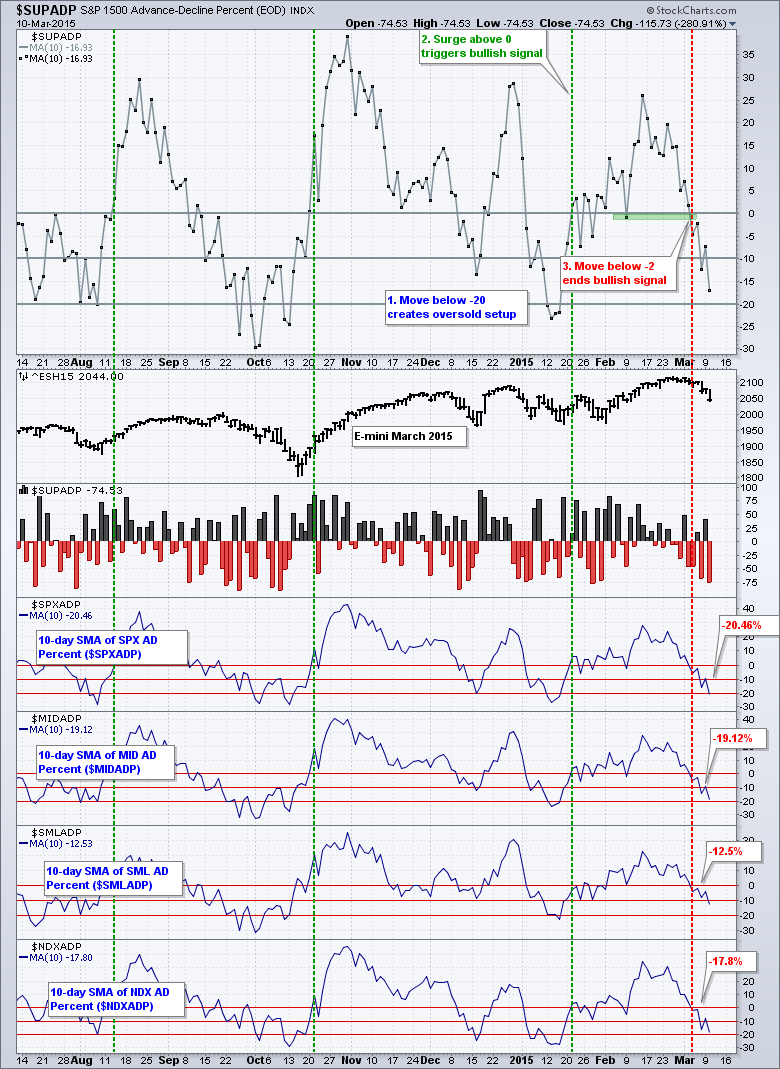
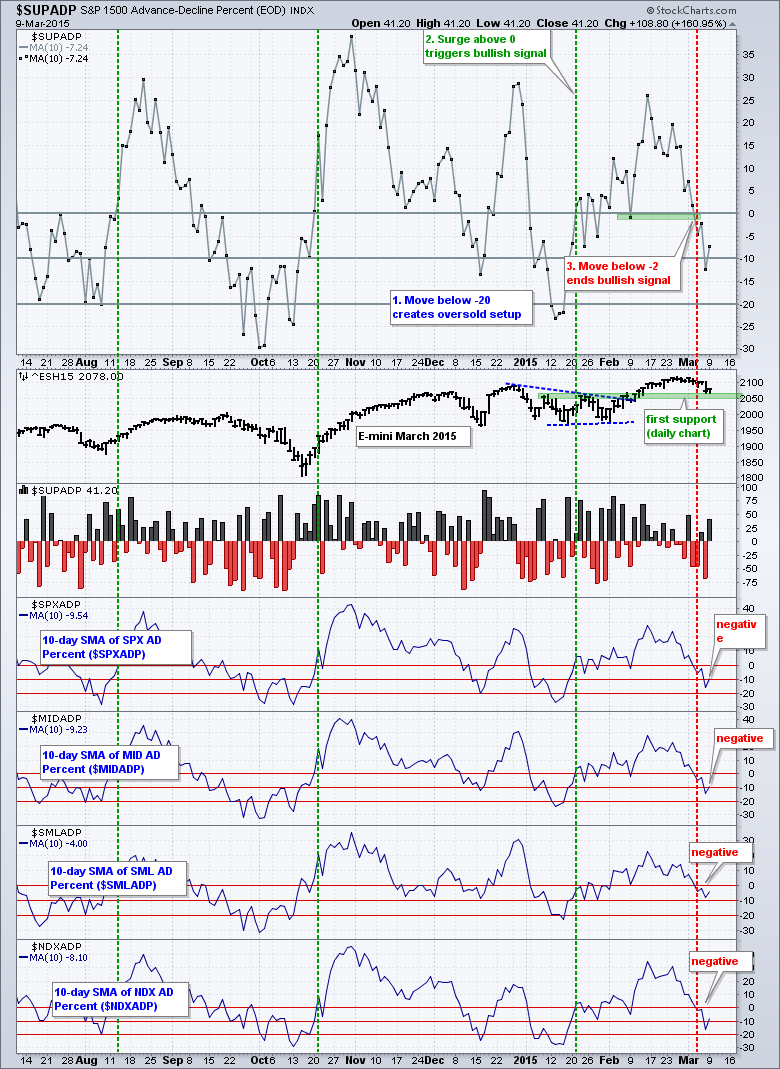
McClellan Oscillators Remain Negative
by Arthur Hill,
Chief Technical Strategist, TrendInvestorPro.com
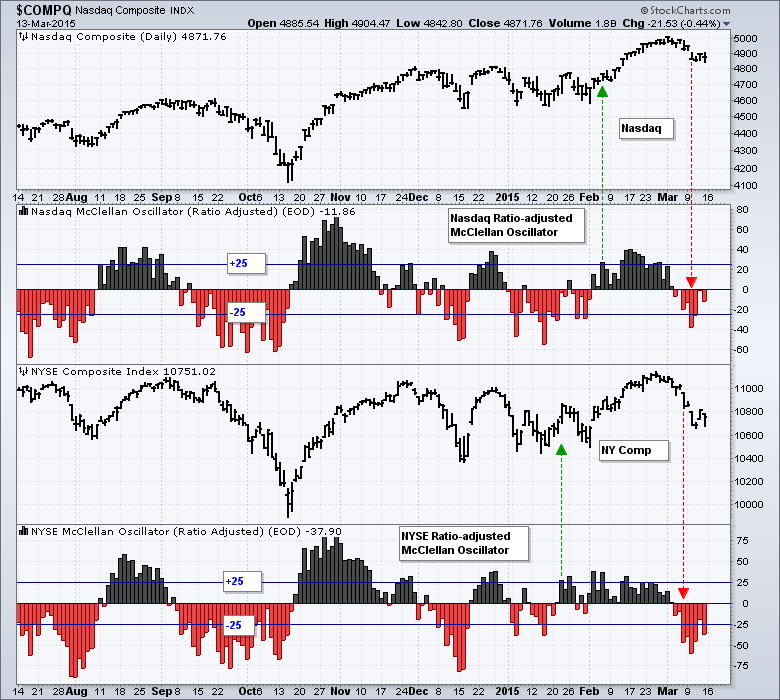
The NYSE McClellan Oscillator ($NYMO) turned negative on March 4th and moved below -25 on March 6th, while the Nasdaq McClellan Oscillator ($NAMO) also turned negative on March 4th, but did not move below -25 until March 10th (red arrows). As these charts show, chartists can use crosses of the...
READ MORE
MEMBERS ONLY

IWM Holds Breakout, SPY Backs Off and TLT Hits Moment of Truth
by Arthur Hill,
Chief Technical Strategist, TrendInvestorPro.com
It was a very mixed week for stocks as QQQ lost around 2% and IWM gained 1.19%. Small-caps continue to lead in relative strength this year. A strong Dollar is helping the small-cap cause and hurting big multinationals. Renewed strength in the finance sector is also helping small-caps. Keep...
READ MORE
MEMBERS ONLY
Touch and go for Boeing

by Julius de Kempenaer,
Senior Technical Analyst, StockCharts.com
Last Tuesday I joined Arthur Hill's market message webinar which was great fun. Not only because the (stock selection) approach we are taking makes total sense, at least that is what I tend to believe. But also because it gives Art and myself a good excuse to meet...
READ MORE
MEMBERS ONLY

-- LONG-TERM UPTREND AND SHORT-TERM DOWNTREND, FINANCE AD LINE, XLF BEAR TRAP, OIL BREAK DOWN, XLE NEAR NEW LOW, CORRELATIONS TO THE DOLLAR (OIL, STOCKS, BONDS, GOLD), KEY NEW HIGHS AND LOWS --
by John Murphy,
Chief Technical Analyst, StockCharts.com
LONG-TERM UPTREND AND SHORT-TERM DOWNTREND... Link for today's video. Stocks did the old pop and drop on Thursday and Friday. With Thursday's gain dissipating, this means the short-term trend is still down and stocks remain in corrective mode. Financials and healthcare showed some strength this week,...
READ MORE
MEMBERS ONLY
Linear Analysis, Alpha, and Beta

by Greg Morris,
Veteran Technical Analyst, Investor, and Author
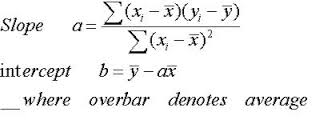
This article sort of ties in with the article I wrote about Modern Finance, “So What Is It with Modern Finance?” I really questioned whether something like this belonged on StockCharts.com, but finally decided that if it gave just a few folks some information that they deemed as valuable,...
READ MORE
MEMBERS ONLY

Mind Games That Can Kill Investors

by Gatis Roze,
Author, "Tensile Trading"
More often than not, most successful investors will admit that while investing may seem relatively simple, it’s not easy at all. Handling the emotional challenges requires ongoing diligence and effort long after the mechanics of actual trading become intuitive. From my experience teaching for over two decades, the biggest...
READ MORE
MEMBERS ONLY
IWM Gets Breakout and Leads - QQQ Lags
by Arthur Hill,
Chief Technical Strategist, TrendInvestorPro.com
Stocks turned it around on Thursday with a strong open and strong close. The S&P 500 surged above 2055 on the open, held this surge and worked its way above 2065 by the close. This is positive price action, but the index remains well below Monday's...
READ MORE
MEMBERS ONLY

PMO Crossover SELL Signals on $WTIC, $BRENT and USO
by Erin Swenlin,
Vice President, DecisionPoint.com
DecisionPoint covers United States Oil Fund (USO) regularly in the DP Market Update on Tuesdays, during the webinar on Wednesdays and in the DP Weekly Update on Fridays (found in DP Reports Blog). It appeared USO would make a turnaround as we got a prescient PMO Crossover BUY signal in...
READ MORE
MEMBERS ONLY

SMALL CAPS LEAD LARGE CAPS HIGHER -- FINANCIALS HAVE A STRONG DAY -- BANK AND BROKER ETFS NEAR UPSIDE BREAKOUTS -- PNC FINANCIAL HITS ALL-TIME HIGH -- WELLS FARGO MAY BE NEXT -- CHARLES SCHWAB NEARS UPSIDE BREAKOUT
by John Murphy,
Chief Technical Analyst, StockCharts.com
SMALL CAPS LEAD U.S. RALLY ... Yesterday's message suggested that small caps do better than large caps in a strong dollar environment. That may explain why small caps are trying hard to pull the U.S. stock market out of its recent pullback. Chart 1 shows the S&...
READ MORE
MEMBERS ONLY
Home Construction ($DJUSHB) Tests Triangle Support
by Tom Bowley,
Chief Market Strategist, EarningsBeats.com
March has been a little rough for the stock market thus far, but there are a few areas where the pullback has represented welcome relief. Home construction ($DJUSHB) is one of those areas. Cyclical stocks, of which home construction is a part, seemed to take a much needed breather in...
READ MORE
MEMBERS ONLY
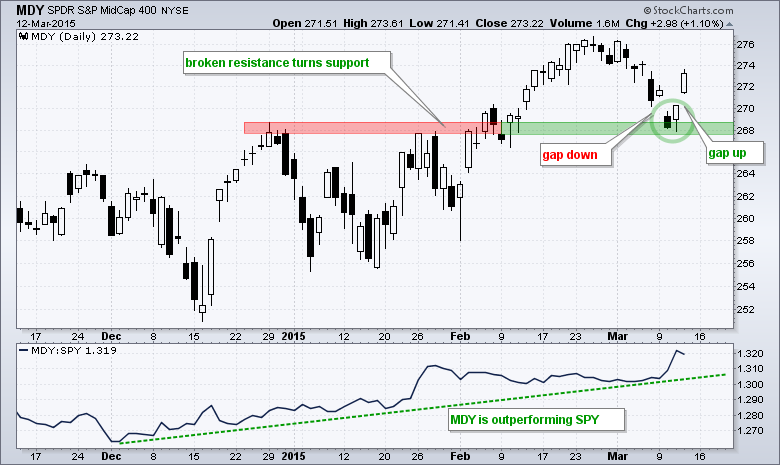
An Island Reversal for S&P MidCap SPDR
by Arthur Hill,
Chief Technical Strategist, TrendInvestorPro.com
The S&P MidCap SPDR (MDY) fell to broken resistance with a gap down on Tuesday, firmed on Wednesday and gapped up on Thursday morning. The two gaps created a price "island" on Tuesday-Wednesday and an island reversal over the last four days. Notice that this island...
READ MORE
MEMBERS ONLY
Short-Term Trend, Breadth and Intermarket Analysis
by Arthur Hill,
Chief Technical Strategist, TrendInvestorPro.com
Trading was very mixed on Wall Street. Large-caps were under selling pressure as the Dollar surged to new highs yet again. SPY lost .23% on the day and the US Dollar ETF (UUP) surged 1.11%. Small-caps attracted some buying interest because they are largely immune to Dollar strength. The...
READ MORE
MEMBERS ONLY
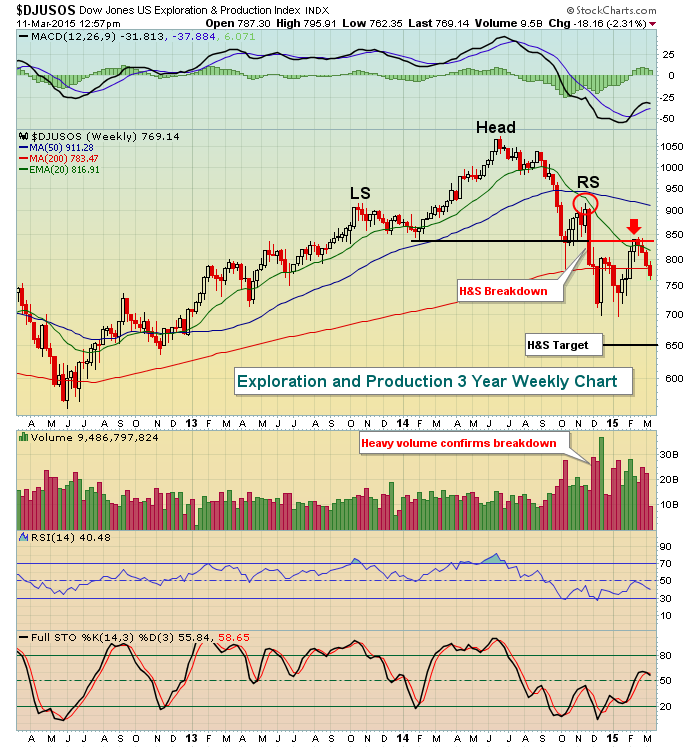
Exploration and Production Index ($DJUSOS) Bottoming?
by Tom Bowley,
Chief Market Strategist, EarningsBeats.com
While most of the U.S. stock market enjoys quite a bull market dating back to March 2009, that's not the case currently for exploration and production stocks ($DJUSOS) - at least not in the near- to intermediate-term. A topping head & shoulders pattern confirmed in late November...
READ MORE
MEMBERS ONLY

DOLLAR INDEX REACHES 12-YEAR HIGH AS EURO TUMBLES -- USD BREAKS 30-YEAR RESISTANCE LINE -- WIDENING SPREAD BETWEEN 10-YEAR TREASURY AND GERMAN YIELD IS SUPPORTING DOLLAR RALLY -- FOREIGN CURRENCIES ARE ALL FALLING
by John Murphy,
Chief Technical Analyst, StockCharts.com
DOLLAR INDEX REACHES 12-YEAR HIGH AS EURO PLUNGES... A lot of attention is being focused on the continuing surge in the U.S. Dollar, and the plunge in the Euro. The monthly bars in Chart 1 show the U.S. Dollar Index (green bars) rising to the highest level since...
READ MORE
MEMBERS ONLY
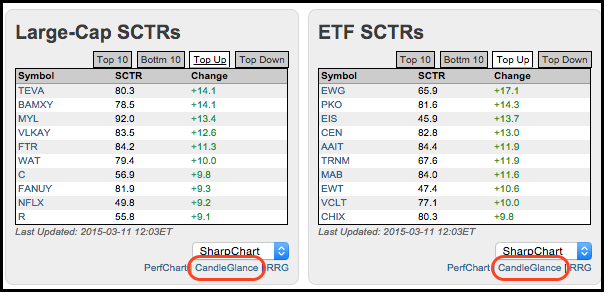
Healthcare Stocks and International ETFs Lead SCTR Gainers
by Arthur Hill,
Chief Technical Strategist, TrendInvestorPro.com
Chartists looking for movers and shakers can turn to the home page and check out the SCTR tables. Click the Top Up tab to see the big gainers (relative strength) and the Top Down tab to see the big losers (relative weakness). The screen shot below shows three stocks from...
READ MORE
MEMBERS ONLY
Downtrends in Stocks, Oil, Gold and Bonds
by Arthur Hill,
Chief Technical Strategist, TrendInvestorPro.com
Stocks were pummeled again on Tuesday with large-caps leading the way. Large-caps have more overseas exposure and are more affected by a strong Dollar. Small-caps held up better, but were not immune to selling pressure. All sectors moved lower with the Technology SPDR (XLK) and the Finance SPDR (XLF) falling...
READ MORE
MEMBERS ONLY
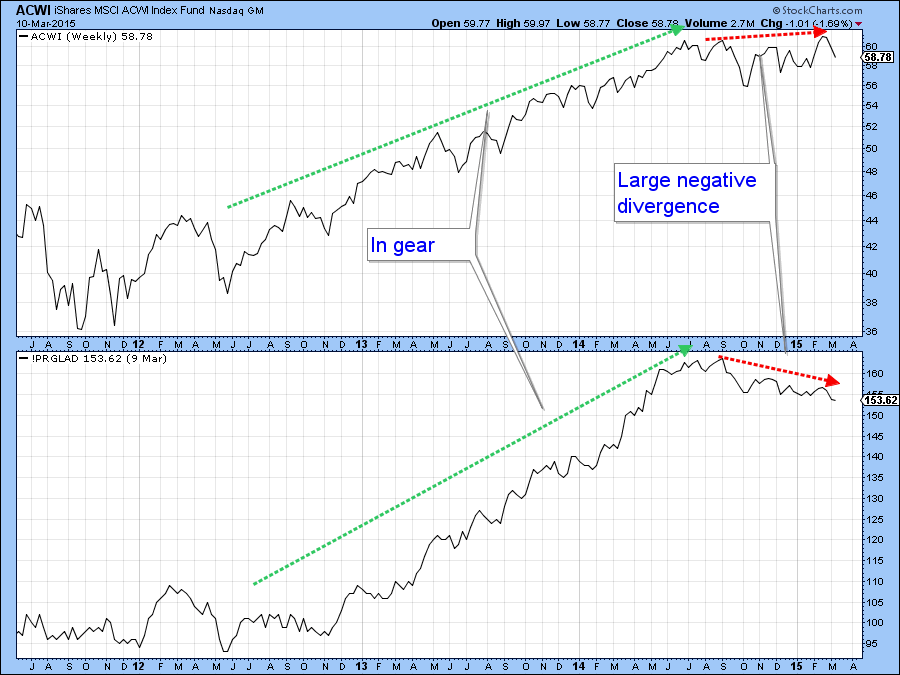
Stock Markets around the World Continue to Look Vulnerable

by Martin Pring,
President, Pring Research
* World stock ETF may have experienced a false upside breakout.
* Bonds likely to out-perform stocks in the immediate future.
* Emerging markets ETF right at critical support.
Global Equities
Global equities are starting to look sick. Chart 1, for instance shows that the MSCI World Stock ETF, the ACWI, has recently...
READ MORE
MEMBERS ONLY
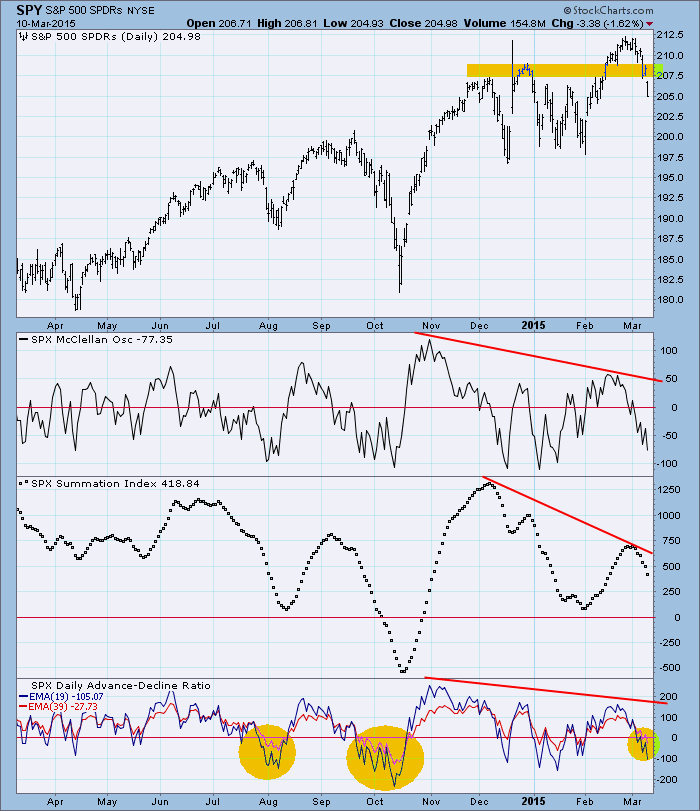
DP Market Update: Correction Picks Up Steam - March 10, 2015
by Erin Swenlin,
Vice President, DecisionPoint.com
Yesterday, price managed to turn up and scalp some losses, but today prices gapped down and continued lower, basically taking over where it left off on Friday.
The purpose of the DecisionPoint Daily Update is to quickly review the day's action, internal condition, and Trend Model status of...
READ MORE
MEMBERS ONLY

-- WEBINAR WITH JDK OF RRG, S&P 500 EXTENDS DECLINE, IMPORTANCE OF FINANCE SECTOR, BREAKDOWN IN XLF, TARGET FOR XLY, TWO STRONG GROUPS AND FOUR STOCKS --
by John Murphy,
Chief Technical Analyst, StockCharts.com
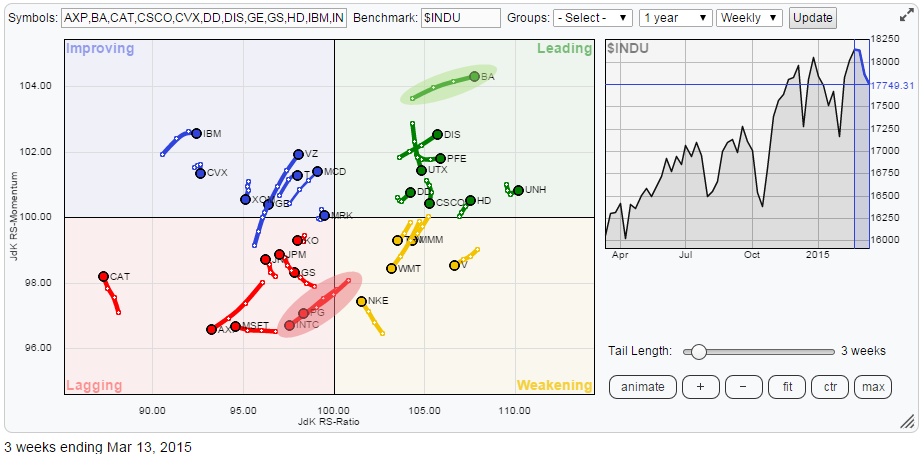
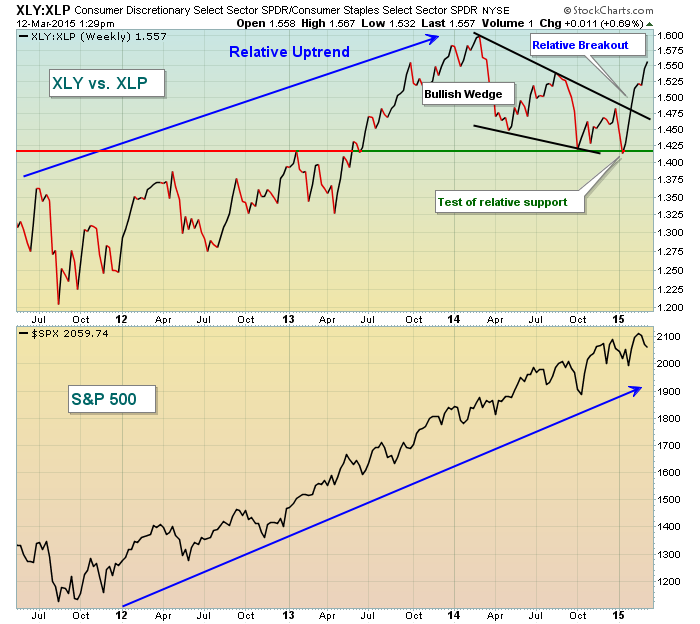
WEBINAR WITH RRG ... Today's Webinar features a top-down approach to selecting stocks using Relative Rotation Graphs (RRGs) and some classic chart analysis. Julius de Kempenaer, developer of RRG, kicks off the webinar by analyzing relative performance for the sector SPDRs, the industry groups in the consumer discretionary sector...
READ MORE
MEMBERS ONLY
McClellan Oscillator Components Moving Below Zero
by Carl Swenlin,
President and Founder, DecisionPoint.com
The McClellan Oscillator is a venerable indicator that was introduced in the late 1960s by Sherman and Marian McClellan. It is still followed today by many technical analysts, but I think many people find it a little intimidating, so I'd like to quickly review how I use it...
READ MORE
MEMBERS ONLY
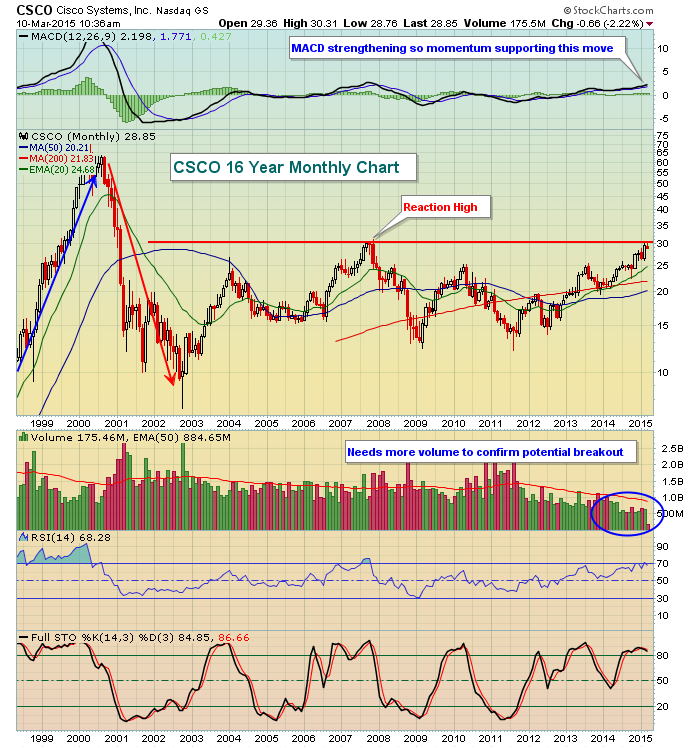
Cisco Systems (CSCO) Tests 14 Year High
by Tom Bowley,
Chief Market Strategist, EarningsBeats.com
Since the tech bubble popped in the early 2000s, CSCO has slowly risen from the ashes. It fell a remarkable 90% from its high in 2000 to its low in late 2002. Keep in mind, however, that it made a parabolic move higher prior to this drop. 2000 started a...
READ MORE
MEMBERS ONLY
Short-Term Trend, Breadth and Intermarket Analysis
by Arthur Hill,
Chief Technical Strategist, TrendInvestorPro.com
After a pummeling on Friday, stocks got an oversold bounce on Monday. But the bounce was not that impressive. QQQ gained .29%, SPY was up .41% and IWM gained .44%. Industrials led the sectors higher and energy lagged. Miners were hit hard as the Gold Miners ETF (GDX) plunged 3....
READ MORE
MEMBERS ONLY
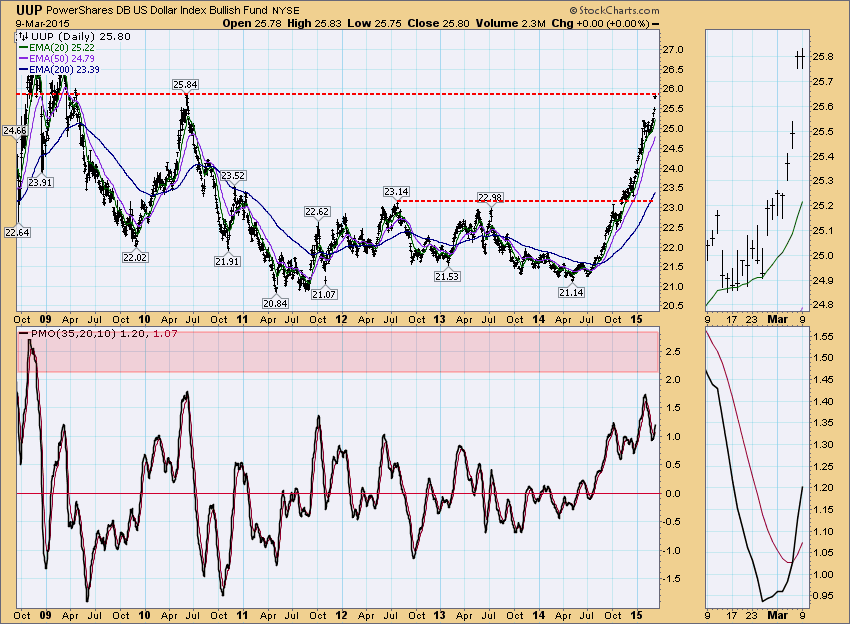
Dollar Struggles at Long-Term Resistance
by Erin Swenlin,
Vice President, DecisionPoint.com
Last Friday the dollar gapped up to reach overhead resistance at the 2010 high. Looking at UUP, the dollar ETF, we see that today, resistance held. The question now is whether it will be able to break out and set a new multi-year high. Looking at the Price Momentum Oscillator...
READ MORE
MEMBERS ONLY

Can Statistics Help You Invest Successfully?
by Greg Morris,
Veteran Technical Analyst, Investor, and Author
I honestly cannot remember taking a course in high school or college specific for statistics. I would imagine it was taught along with the many math and engineering courses I struggled through. There was nothing like a draft card with a low number to motivate the successful completion of college...
READ MORE
MEMBERS ONLY
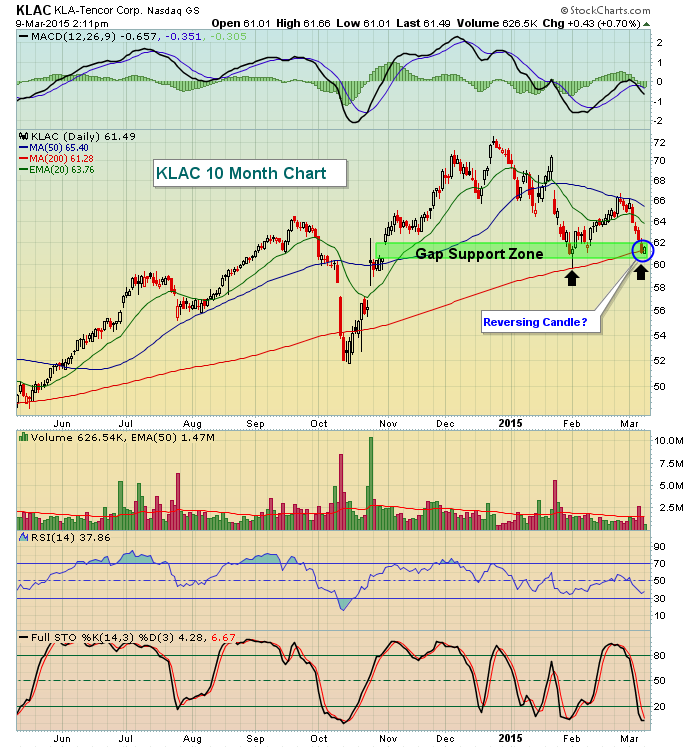
KLA-Tencor (KLAC) Testing Key Support Zone
by Tom Bowley,
Chief Market Strategist, EarningsBeats.com
Semiconductors ($DJUSSC) are one of the worst areas of the market today and have been one of the worst areas of technology over the past week. KLA-Tencor (KLAC) has hit a key area of support, however, and certainly presents a much better reward to risk opportunity. 60.53 represents gap...
READ MORE
MEMBERS ONLY

-- MARKETCARPET TIPS AND TRICKS, 3 LEADING SECTORS, LEADING STOCKS IN LEADING SECTORS, ONE SEMICONDUCTOR ETF LAGS THE OTHER, INTEL MAKES A BREAK, TSM WEIGHS --
by John Murphy,
Chief Technical Analyst, StockCharts.com
DRILLING DOWN INTO THE MARKETCARPET... Link for today's video. After hitting new highs in February, stocks weakened in March with selling pressure over the past week. The long-term trend for the S&P 500 remains up, but some sort of correction or pullback may be underway. Corrections...
READ MORE
MEMBERS ONLY
Stocks, Bonds, Oil and Gold Get Hit
by Arthur Hill,
Chief Technical Strategist, TrendInvestorPro.com
Selling pressure hit both stocks and bonds last week, but bonds more so than stocks. The S&P 500 fell around 1.5% for the week, which is not a drastic decline by any means. The 20+ YR T-Bond ETF (TLT) fell 4.5% last week and is down...
READ MORE
MEMBERS ONLY
Free Market Analysis! Get your Free Market Analysis Right Here!
Hello Fellow ChartWatchers!
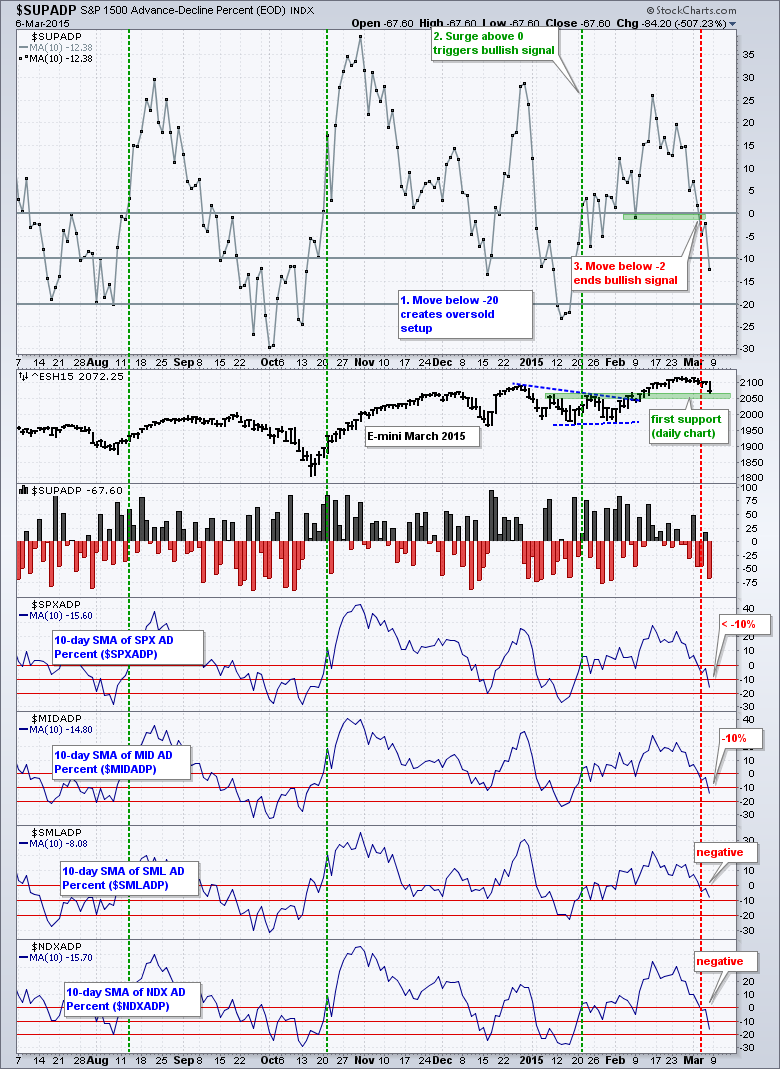
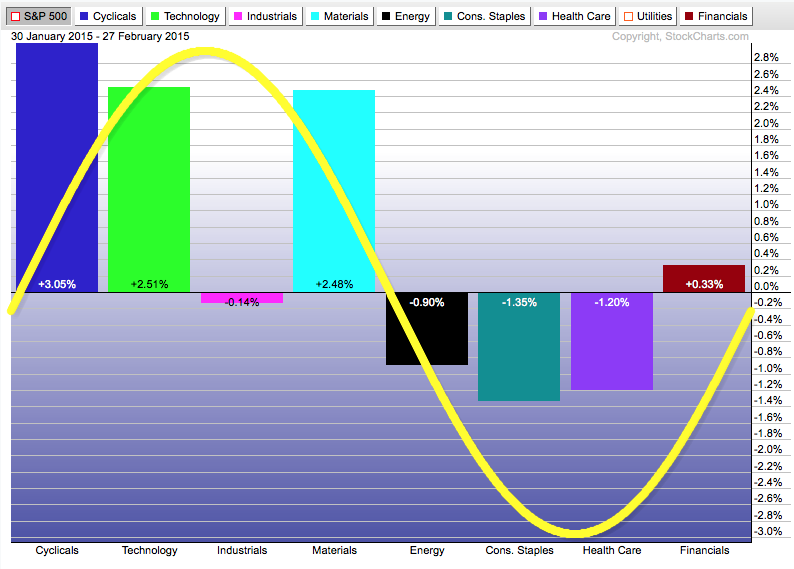
The market gave back ground this week, especially on Friday as a good Jobs report led to fears that the Federal Reserve would raise interest rates soon. It definitely seems like a turning point in the market just occurred as the Sector Rotation picture is now muddier....
READ MORE
MEMBERS ONLY
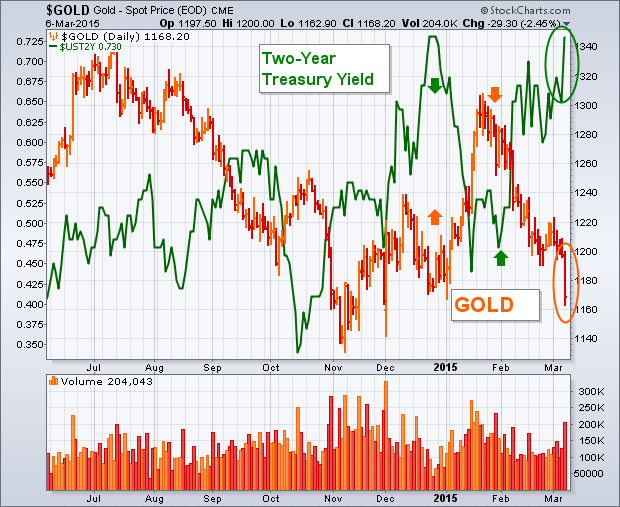
Gold Tumbles on Rising Rates
by John Murphy,
Chief Technical Analyst, StockCharts.com
Gold got hit hard Friday on two fronts. One was the sharp jump in U.S. interest rates. The other was the surge in the U.S. Dollar to the highest level in eleven years. The chart below shows the price of gold tumbling $29 (-2.4%) on Friday to...
READ MORE
MEMBERS ONLY
Internet Stocks Showing Renewed Relative Strength
by Tom Bowley,
Chief Market Strategist, EarningsBeats.com
When we look back at last week's action, a few things stand out to me. First, the aggressive sectors - financials, consumer discretionary, technology and industrials - held up quite well on a relative basis. That should be seen as a positive. The worst performing group was utilities,...
READ MORE
