MEMBERS ONLY

Megaphone Pattern + Death Cross: Bitcoin’s Technicals Flash a Warning
Cryptocurrencies have been under pressure, and two key chart developments indicate further downside. Here's what you need to watch as the year-end approaches....
READ MORE
MEMBERS ONLY

Charting the Week Ahead: Where Is Nifty Headed Next?

by Milan Vaishnav,
Founder and Technical Analyst, EquityResearch.asia and ChartWizard.ae
Nifty's current technical setup reflects a strong market, steadily grinding higher. What does the coming week have in store?...
READ MORE
MEMBERS ONLY

The Market’s Stuck in Neutral: What Could Break the Standstill?

by Jayanthi Gopalakrishnan,
Director of Site Content, StockCharts.com
The stock market churned but went nowhere this week as breadth held steady and rate-cut odds shifted. Here's what investors should watch next week....
READ MORE
MEMBERS ONLY

Fed Jitters Shake the Market – Where are Investors Finding Shelter?

by Mary Ellen McGonagle,
President, MEM Investment Research
Mary Ellen McGonagle breaks down how hawkish Fed comments and rising yields rattled the markets this week. See where investors are finding opportunity — and which sectors are offering shelter as volatility returns....
READ MORE
MEMBERS ONLY
How to Read the Market When Nothing Seems to Add Up
by Jayanthi Gopalakrishnan,
Director of Site Content, StockCharts.com
When you get used to a resilient stock market, it can feel a little disorienting when things suddenly start to zig instead of zag. We got a taste of that this week, as some days the market marched higher, and other days it sold off sharply. If you felt like...
READ MORE
MEMBERS ONLY

Market Rotation: What’s Really Happening Beneath the Surface
by Mary Ellen McGonagle,
President, MEM Investment Research
While the stock market indexes are looking range-bound, there's a shift in what's driving the market's performance. Find out what's going on beneath the surface....
READ MORE
MEMBERS ONLY
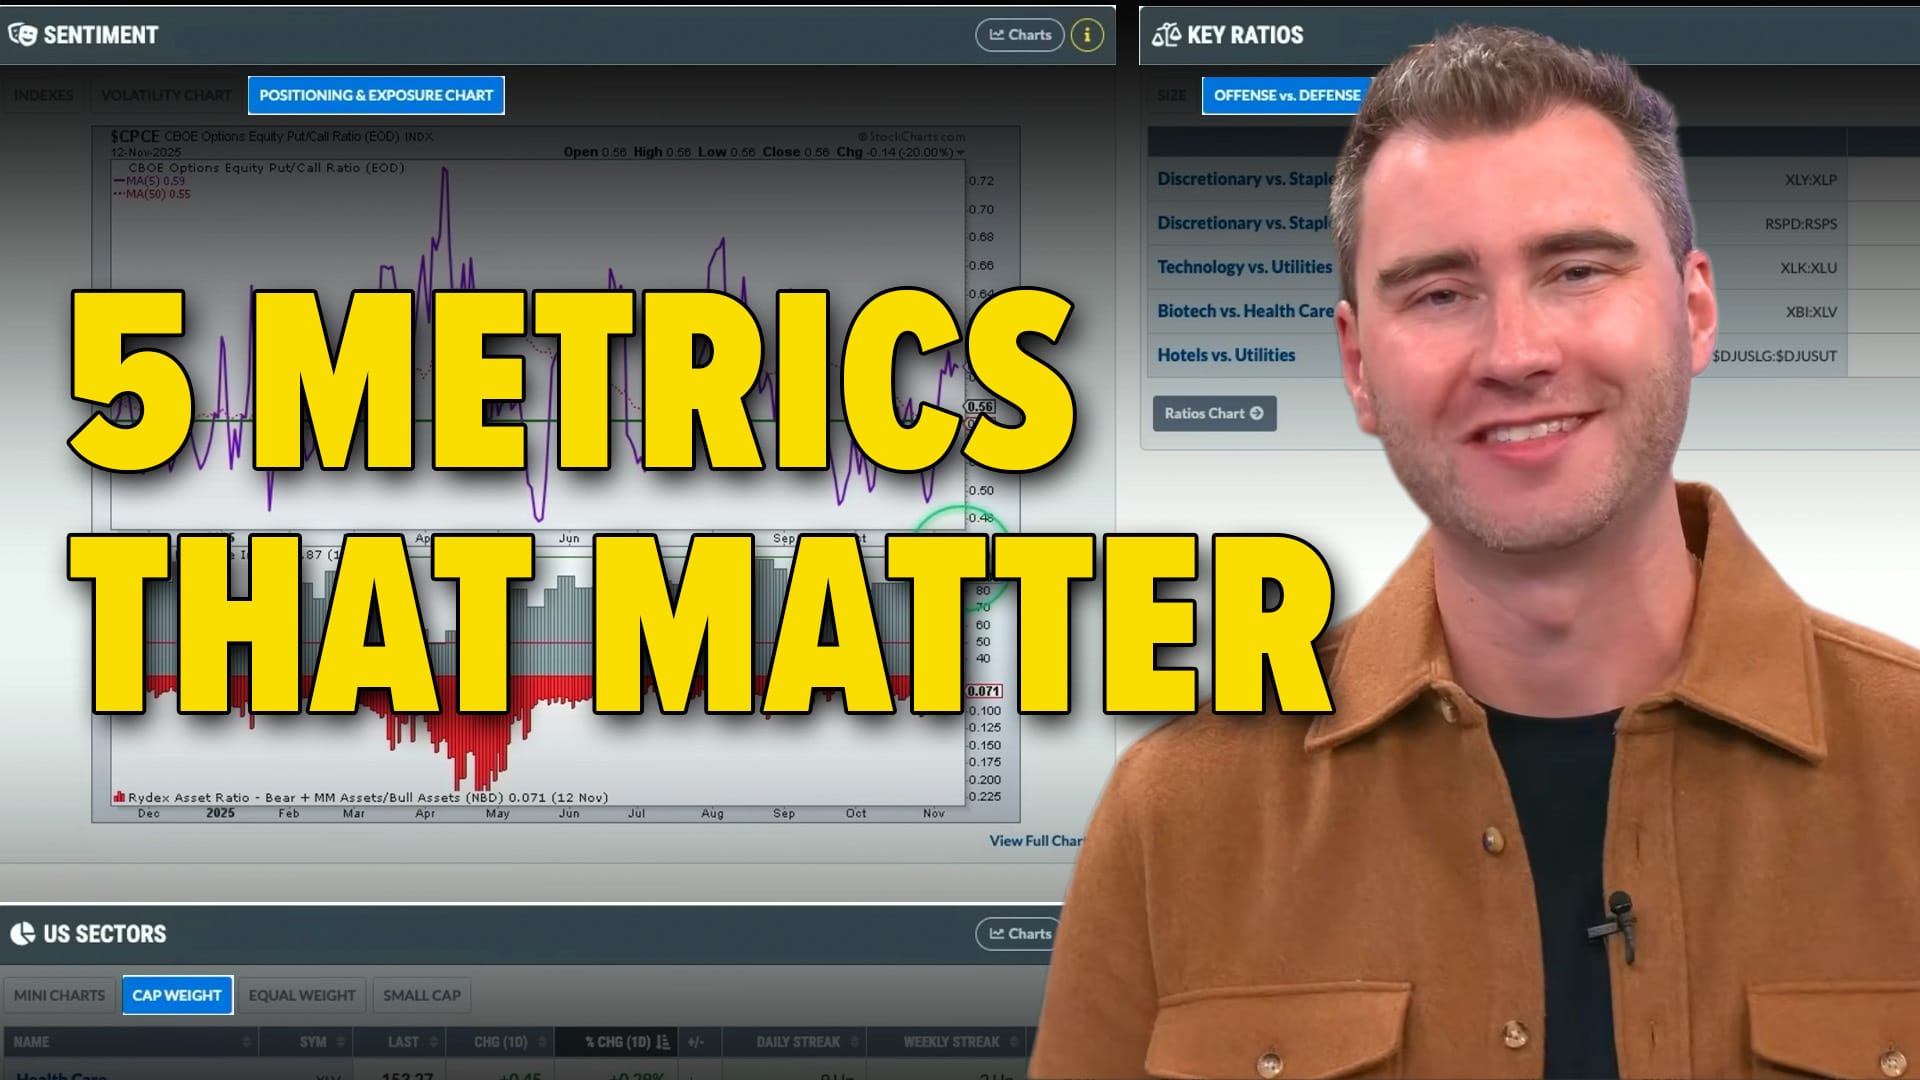
Market Top or Bullish Bounce? Watch These Top 5 Crucial Market Metrics to Decide!

by Grayson Roze,
Chief Strategist, StockCharts.com
With the market just a shout away from its all-time highs, Grayson Roze shares five market metrics every trader should watch using StockCharts’ Market Summary Dashboard. Learn how he tracks trends, breadth, sentiment, and sector strength to uncover what’s really driving the market....
READ MORE
MEMBERS ONLY

Small Caps Break Down, VIX Surges. What's Next?

by Tom Bowley,
Chief Market Strategist, EarningsBeats.com
Small-cap stocks have broken below a key support level. Volatility is also creeping higher. Tom Bowley shares his views by breaking down several charts....
READ MORE
MEMBERS ONLY

Cracks within Tech; Bonds Outperform, Bitcoin; Insurance Names Catch a Strong Bid

by Arthur Hill,
Chief Technical Strategist, TrendInvestorPro.com
When technology ETFs are breaking down, insurance stocks and bonds are showing strength, and Bitcoin is triggering a downtrend, it means the stock market is showing signs of risk aversion. Arthur Hill analyzes charts of these asset groups and identifies the signals they are sending....
READ MORE
MEMBERS ONLY

Healthcare Stocks Are Breaking Out — But Why Now?
by Tom Bowley,
Chief Market Strategist, EarningsBeats.com
Healthcare stocks are breaking out as biotechs and pharmaceuticals surge to new highs; Tom Bowley highlights the rotation into healthcare and explains how this emerging leadership is helping drive the market higher going into year-end....
READ MORE
MEMBERS ONLY

The Sneaky Bull Market Nobody’s Talking About: Commodities
Commodities are making a bullish run in a seasonally weak period. Keep an eye on this potentially leggy asset class and find out how you can take advantage of the commodity run....
READ MORE
MEMBERS ONLY

StockCharts Insider: 10 Laws Every Chartist Should Know

by Karl Montevirgen,
The StockCharts Insider
Before We Dive In…
Markets change. Principles don’t. More specifically, the way we deal with markets evolves, but the factors driving markets remain consistent. Famed technical analyst John Murphy distills these factors into 10 Laws. These are timeless lessons that cut through the market noise and reveal how price,...
READ MORE
MEMBERS ONLY

Three Ways to Trade NVIDIA: Which One Gives You the Best Risk/Reward
by Jayanthi Gopalakrishnan,
Director of Site Content, StockCharts.com
Tech took a hit, but all's not lost. Here's what NVIDIA's chart is indicating and how you can use options to trade the pullback with confidence....
READ MORE
MEMBERS ONLY

Three Stocks That Could Benefit Most from Tariff Relief — If the Charts Agree

by David Keller,
President and Chief Strategist, Sierra Alpha Research
With talk of tariffs being rolled back, stocks like Best Buy, Stanley Black & Decker, and Nike could benefit from renewed optimism. But, as Dave, explains, the charts tell the real story, revealing which names are technically ready to lead the next move higher....
READ MORE
MEMBERS ONLY

The Tariff Relief Playbook: 10 Stocks with Upside Potential
by David Keller,
President and Chief Strategist, Sierra Alpha Research
Which stocks could benefit the most if trade tariffs are rolled back? Dave highlights ten potential winners—including CAT, NKE, and more—and shows how to use StockCharts tools to uncover trend strength and opportunities....
READ MORE
MEMBERS ONLY
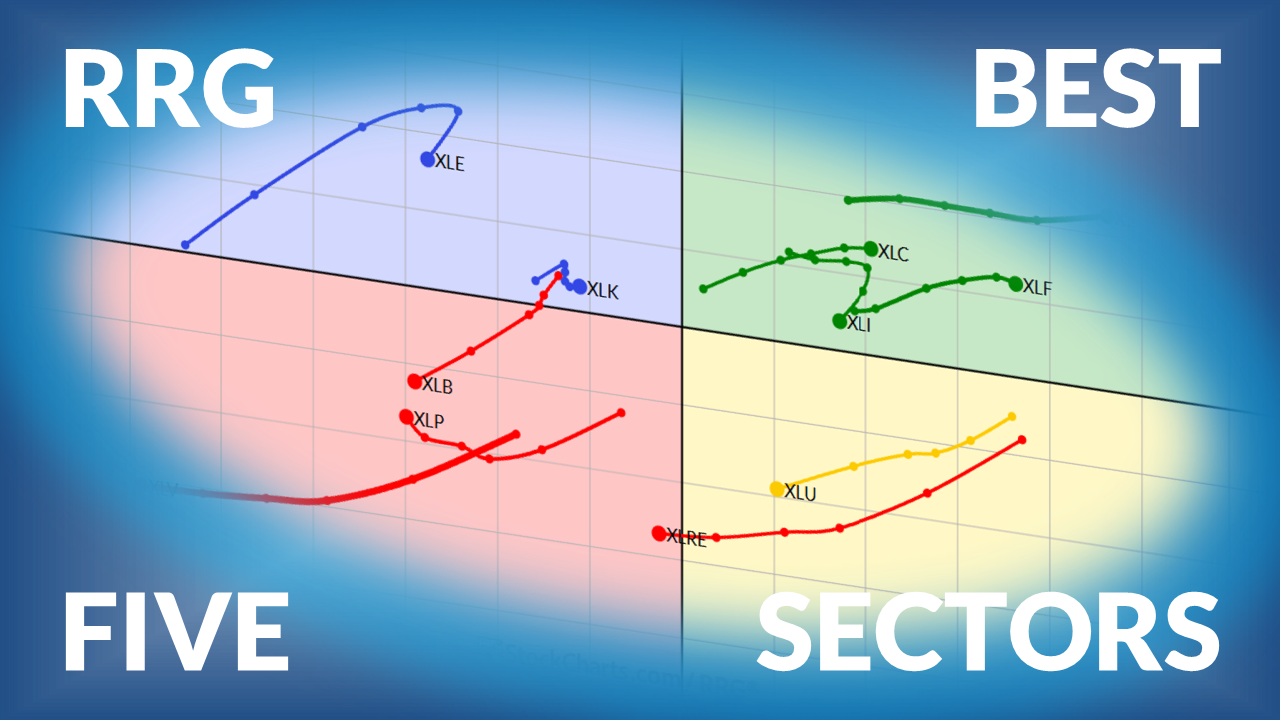
The Best Five Sectors This Week, #44

by Julius de Kempenaer,
Senior Technical Analyst, StockCharts.com
Julius presents his weekly update on US sector ranking based on Relative Rotation Graphs....
READ MORE
MEMBERS ONLY

Retail Stocks to Watch as Consumer Sentiment Collapses: Walmart, Target, and Home Depot
Key Q3 retail earnings reports are set to begin rolling in this week. Here's a look at charts of the consumer-related stocks that will give you a hint at how it will all shake out....
READ MORE
MEMBERS ONLY

What Lies Ahead for Nifty? A Look at the Week Ahead
by Milan Vaishnav,
Founder and Technical Analyst, EquityResearch.asia and ChartWizard.ae
The Nifty is in a state of flux, testing its symmetrical triangle pattern. Could an uptrend be on the horizon, or will we see incremental downside?...
READ MORE
MEMBERS ONLY

After a Volatile Week in the Markets, Here's Where I Found Strength!
by Mary Ellen McGonagle,
President, MEM Investment Research
Mary Ellen McGonagle breaks down this week’s volatile market action, highlighting areas where selective strength is showing up. Discover setups in energy, healthcare, and AI-linked names that are holding up as other areas weaken....
READ MORE
MEMBERS ONLY
Correction or Opportunity? The Charts Have the Clues
by Jayanthi Gopalakrishnan,
Director of Site Content, StockCharts.com
Tech stocks are tumbling. The AI rally just slammed the brakes. Investors are getting fearful. This week's headlines painted a picture of panic, but beneath the surface, something else may be unfolding.
When the stock market is overstretched, it’s not unusual for it to pull back. We’...
READ MORE
MEMBERS ONLY

Is The Sharp Advance In Technology Stocks Over?
by Mary Ellen McGonagle,
President, MEM Investment Research
Has the rotation into Tech peaked? Or is this just a pause within a longer-term leadership trend? Mary Ellen explores with a look at the sector chart and an individual stock....
READ MORE
MEMBERS ONLY

Change of Character: Why the S&P 500’s Uptrend May Be Breaking Down
by David Keller,
President and Chief Strategist, Sierra Alpha Research
The S&P 500 has broken below its 21-day EMA and key trend channel support, testing its 50-day moving average as market breadth weakens. With tech leaders like NVDA and AVGO tumbling, investors should watch for a possible rotation toward defensive sectors....
READ MORE
MEMBERS ONLY

Technology Selling is Creating Huge Opportunities Elsewhere
by Tom Bowley,
Chief Market Strategist, EarningsBeats.com
Technology stocks may be selling off, but money is rotating into other areas. Check out the charts of the industry groups that are indicating upside breakouts....
READ MORE
MEMBERS ONLY

One Sector Stands Strong as the Most Economically Sensitive Sector Breaks Down
by Arthur Hill,
Chief Technical Strategist, TrendInvestorPro.com
Arthur Hill analyzes the performance of the Health Care sector relative to other S&P 500 sectors. Find out why Health Care shows promise as we head into the end of the year. ...
READ MORE
MEMBERS ONLY
Market Rotation Update: Revealing the Strongest Areas Now
by Julius de Kempenaer,
Senior Technical Analyst, StockCharts.com
Julius builds on his new portfolio framework to reveal where market strength is shifting across asset classes and sectors. While stocks and commodities continue to lead, Julius breaks down the changes happening beneath the surface....
READ MORE
MEMBERS ONLY

Money’s Moving Fast! New Market Leaders Are Emerging
by Tom Bowley,
Chief Market Strategist, EarningsBeats.com
Money’s moving fast, with growth stocks cooling while healthcare and transports heat up. Tom Bowley breaks down the sector rotation creating new opportunities in names like GOOGL, AMD, and breakout healthcare leaders CAH and IDXX....
READ MORE
MEMBERS ONLY

Market Pullback or Pause? Inside the November Dip and What Comes Next for Stocks
Intermarket relationships between stocks, bonds, the US dollar, and commodities are unsettled at the moment. What happens next? Here are the charts investors should be watching for clues....
READ MORE
MEMBERS ONLY

Market Breadth Weakens — Is the S&P 500 in Trouble??

by Frank Cappelleri,
Founder & President, CappThesis, LLC
Follow along as Frank Cappelleri breaks down the S&P 500’s pullback, small-cap growth momentum, biotech leadership, and Bitcoin’s key support test. See what patterns and sector shifts could define the next market move!...
READ MORE
MEMBERS ONLY

Will “Buy the Dips” Work Again in November 2025?
by David Keller,
President and Chief Strategist, Sierra Alpha Research
Identifying a true uptrend means watching for higher lows and key support levels. Charts of CELH, BAC, and CAT show how dip-buying and moving-average support reveal whether bullish momentum will continue or signal a shift toward a bearish phase....
READ MORE
MEMBERS ONLY
Breakouts, Pullbacks & Setups: 10 Must-Watch Charts for November
by Grayson Roze,
Chief Strategist, StockCharts.com
by David Keller,
President and Chief Strategist, Sierra Alpha Research
Grayson Roze and David Keller share ten charts to watch for November, including setups in Celsius, Regeneron, Caterpillar, Eli Lilly, and Shopify. Learn how they use StockCharts tools and trend analysis to locate strength and manage risk in a stretched bull market....
READ MORE
MEMBERS ONLY

Fed Chair Says, “It’s Cloudy”; These Benchmarks Could Blow the Clouds Away

by Martin Pring,
President, Pring Research
Martin Pring analyzes charts of US Treasury yields, which suggest there may be some disagreement between the market and the Fed....
READ MORE
MEMBERS ONLY

The Best Five Sectors This Week, #43
by Julius de Kempenaer,
Senior Technical Analyst, StockCharts.com
Julius presents his weekly update on ranking of US sectors based on Relative Rotation Graphs....
READ MORE
MEMBERS ONLY

Retail Lags, Restaurants Sink: A Technical Check on the U.S. Consumer Story
November's focus will be on consumer-related company earnings, such as retail and restaurants. These will shed light on consumer confidence, an important data point as we head into the holiday season. Here's a technical deep dive into the health of the U.S. consumer....
READ MORE
MEMBERS ONLY

Week Ahead: NIFTY Stalls Near Highs, Awaits Breakout Confirmation
by Milan Vaishnav,
Founder and Technical Analyst, EquityResearch.asia and ChartWizard.ae
Following a rangebound week, the Nifty's technical structure remains bullish, but there's signs of fatigue. Will it breakout, or see corrective moves?...
READ MORE
MEMBERS ONLY
Earnings Shake Up the Market! Where Leadership Is Shifting Now
by Mary Ellen McGonagle,
President, MEM Investment Research
Mary Ellen McGonagle breaks down how recent earnings results are shaking up market leadership and where new strength is emerging. Learn which sectors and stock setups are holding up as investors navigate mixed results and rising volatility....
READ MORE