MEMBERS ONLY

Another New High for the Year?

by David Keller,
President and Chief Strategist, Sierra Alpha Research
In this episode of StockCharts TV'sThe Final Bar, guest Nick Raich of The Earnings Scout focuses in on one sector that has a lot of earnings potential. Host David Keller, CMT explores more new highs in the S&P 500 and, with earnings season starting with force,...
READ MORE
MEMBERS ONLY

Gold Mining Stocks vs Gold: What's the Turnaround Trigger?

by Karl Montevirgen,
The StockCharts Insider
KEY TAKEAWAYS
* Despite common advice, gold mining stocks have faced significant struggles in the past decade
* A decrease in investment for gold exploration and potential rising demand for gold amid global instability suggest these stocks may currently be undervalued
* The VanEck Vectors Gold Miners ETF (GDX) shows promising upward potential,...
READ MORE
MEMBERS ONLY
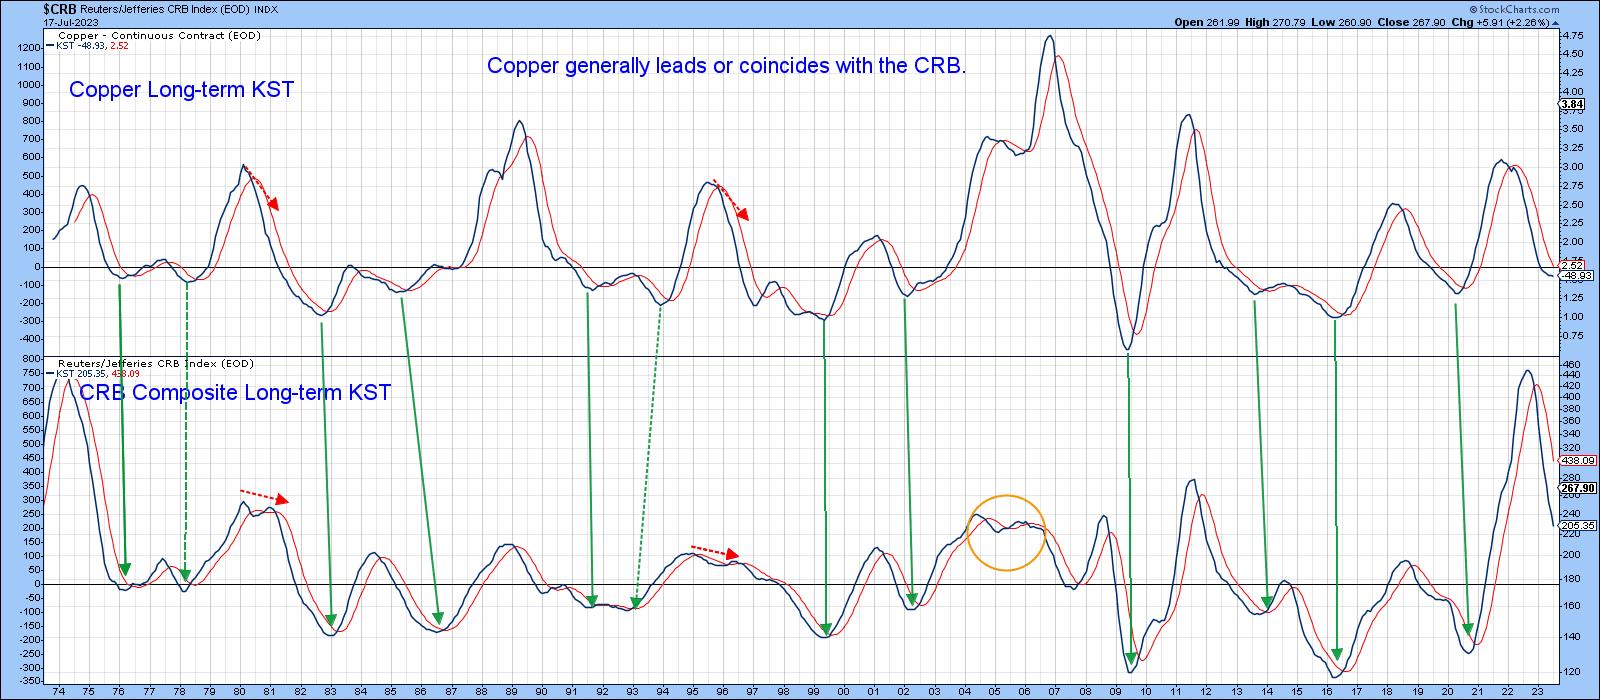
Taking a Deep Dive Into Dr. Copper and What it Means

by Martin Pring,
President, Pring Research
Last week, I pointed out that several indicators were close to triggering a bull market for commodities. Some of those benchmarks have since been met, but none have yet moved decisively in that direction. Now, it's time to take a deep dive into the copper price, as this...
READ MORE
MEMBERS ONLY
Opposite George Week Is Underway!

by Tom Bowley,
Chief Market Strategist, EarningsBeats.com
I always refer to monthly options expiration week as "Opposite George" week. It's a reference to the Seinfeld episode where George Costanza is, as always, down on his luck. Jerry and Elaine suggest that if everything he does in his life is wrong, then why not...
READ MORE
MEMBERS ONLY
S&P 500 Pushing All-Time Highs? Strong Trends Getting Stronger
by David Keller,
President and Chief Strategist, Sierra Alpha Research
In this special episode of StockCharts TV'sThe Final Bar, Dave celebrates the S&P 500 making another new high for 2023 and focuses on two key growth stocks reporting earnings this week. He answers questions on linear vs. logarithmic-scale charts, upside for COIN and breakout potential for...
READ MORE
MEMBERS ONLY

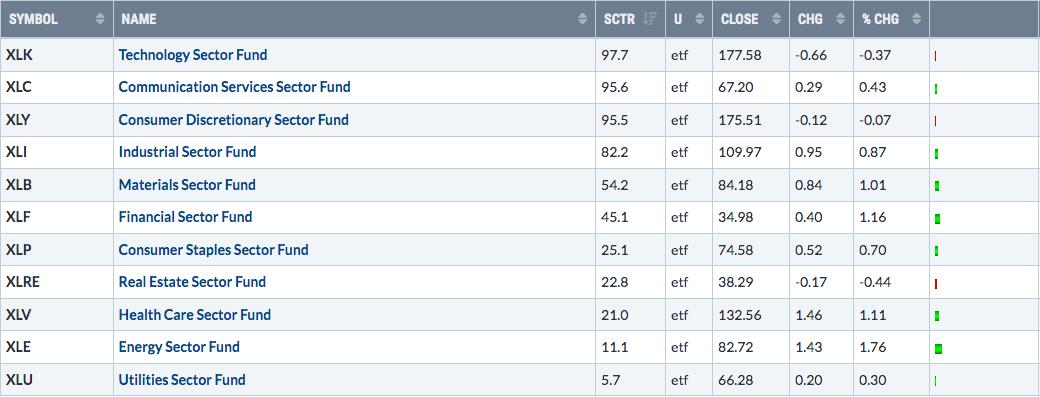
Sector Spotlight: Latest Drop in US Dollar Sending Markets Higher

by Julius de Kempenaer,
Senior Technical Analyst, StockCharts.com
In this episode of StockCharts TV's Sector Spotlight, I address the recent drop in the US dollar and its effect on the US stock market. The asset class segment is then followed by a look at current sector rotation and the increasing number of stocks in the S&...
READ MORE
MEMBERS ONLY
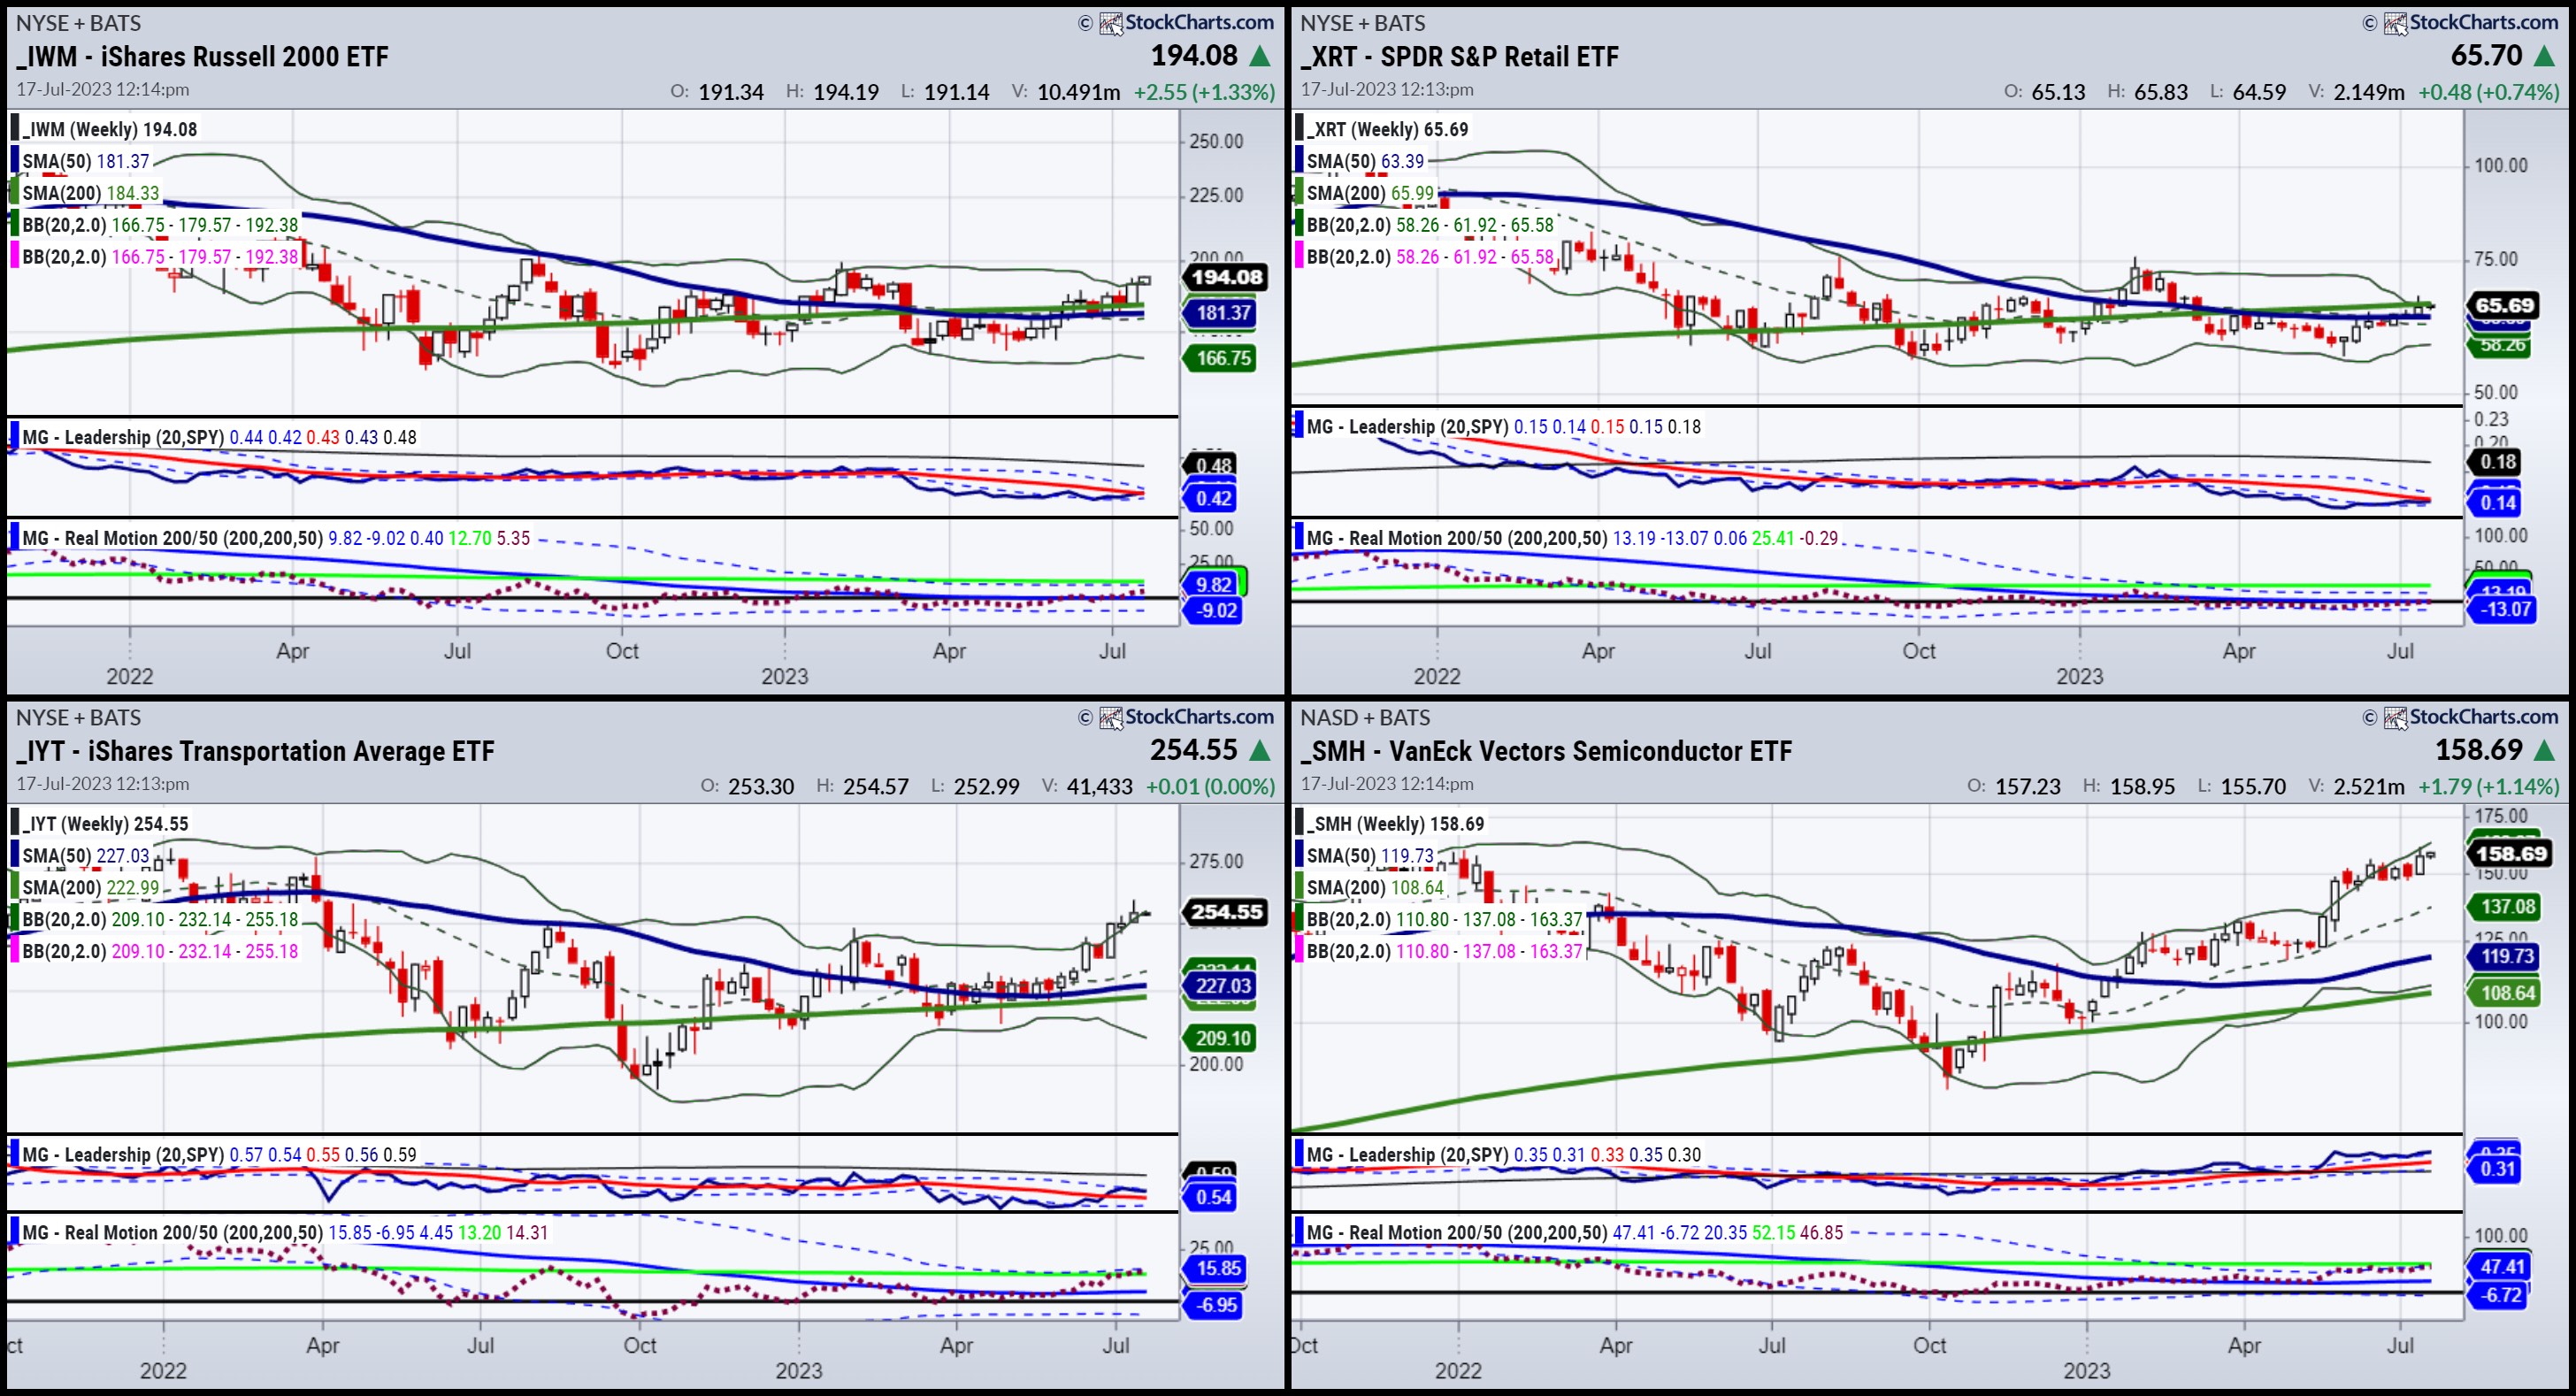
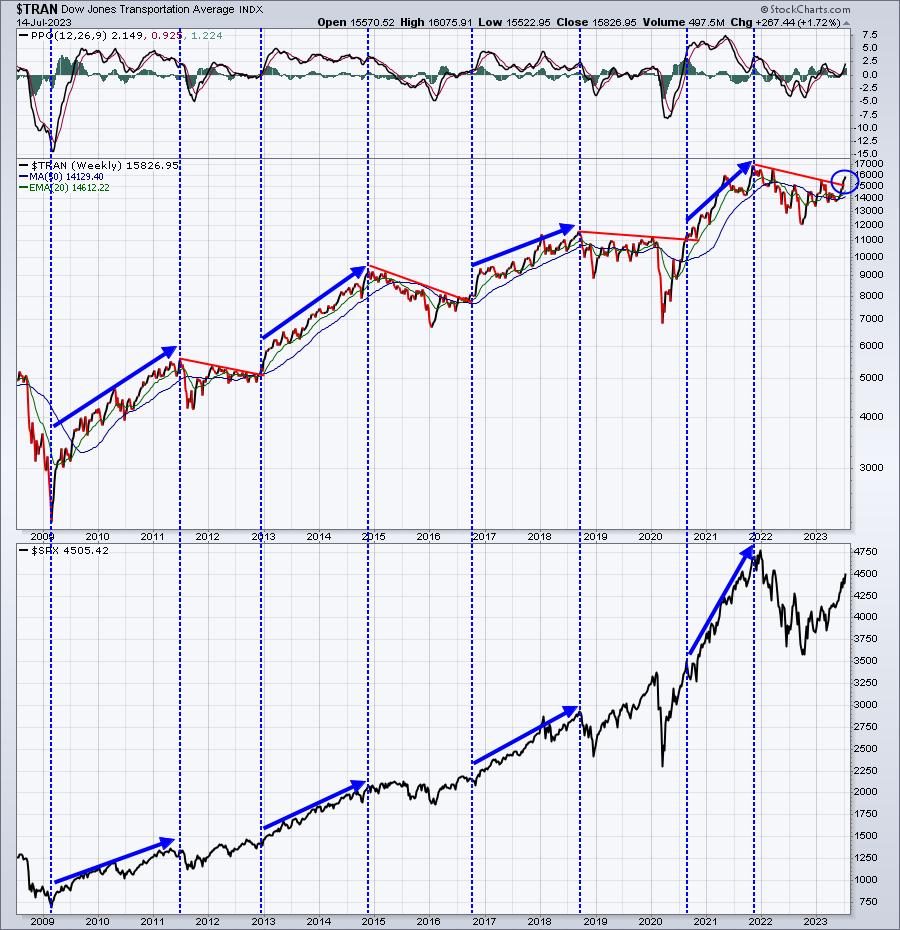
Economic Modern Family Reset in July -- Blueprint
This will be the only Daily for this week. (A new one will be available July 24th.)
As such, two key areas are in focus, both reliable in determining next moves in the market. First, we have the charts of the Economic Modern Family(Russell 2000, Retail, Transportation, Biotech, Semiconductors,...
READ MORE
MEMBERS ONLY
The Halftime Show: The One Indicator That Gave Me an Edge...

by Pete Carmasino,
Chief Market Strategist, Chaikin Analytics
In this week's edition of StockCharts TV'sHalftime, Pete reviews the usual suspects in the markets, starting by looking at mega-cap growth over mega-cap value -- growth is winning. Oil Services, OIH, was breaking out in the last two weeks; Pete shows how to break down the...
READ MORE
MEMBERS ONLY

Week Ahead: While Uptrend Stays Intact In Nifty, Stay Selective And Guard Profits At Higher Levels

by Milan Vaishnav,
Founder and Technical Analyst, EquityResearch.asia and ChartWizard.ae
It was the third week in a row that the markets extended their gains; the NIFTY had staged a breakout when it crossed above the 18880 levels. This has resulted in the NIFTY closing at yet another lifetime high. This has taken the markets into a mildly overbought zone; however,...
READ MORE
MEMBERS ONLY
Sector Spotlight Special: The Impact of Using Different Benchmarks for RRG!
by Julius de Kempenaer,
Senior Technical Analyst, StockCharts.com
In this special episode of StockCharts TV's Sector Spotlight, I address the impact of using different benchmarks on Relative Rotation Graphs and the opportunities for investors to adapt the use of RRGs in different circumstances.
This video was originally broadcast on July 15, 2023. Click anywhere on the...
READ MORE
MEMBERS ONLY
Stay Ahead Of The Curve To Make More Money
by Tom Bowley,
Chief Market Strategist, EarningsBeats.com
Everyone's a stock picker. And to be quite honest, everyone gets hot and everyone gets cold. Every trader has to find strategies that work for him/her and then hit the "rinse and repeat" button. Personally, I've found three keys that have helped me...
READ MORE
MEMBERS ONLY

Follow the Money! New Earnings Tools + Data as Report Season Kicks Off

by Grayson Roze,
Chief Strategist, StockCharts.com
On this week's edition of StockCharts TV'sStockCharts in Focus, Grayson presents some of the exciting new features that have just rolled out across the site. These new tools are going to help you stay on top of all the action this earnings season, showing which companies...
READ MORE
MEMBERS ONLY

MEM TV: Can the Markets Continue Higher on Low Inflation Numbers?

by Mary Ellen McGonagle,
President, MEM Investment Research
In this episode of StockCharts TV'sThe MEM Edge, Mary Ellen reviews where the markets closed after two positive inflation reports. She also shares the strongest areas with specific stocks while highlighting what to be on the lookout for as we head into earnings season.
This video originally premiered...
READ MORE
MEMBERS ONLY
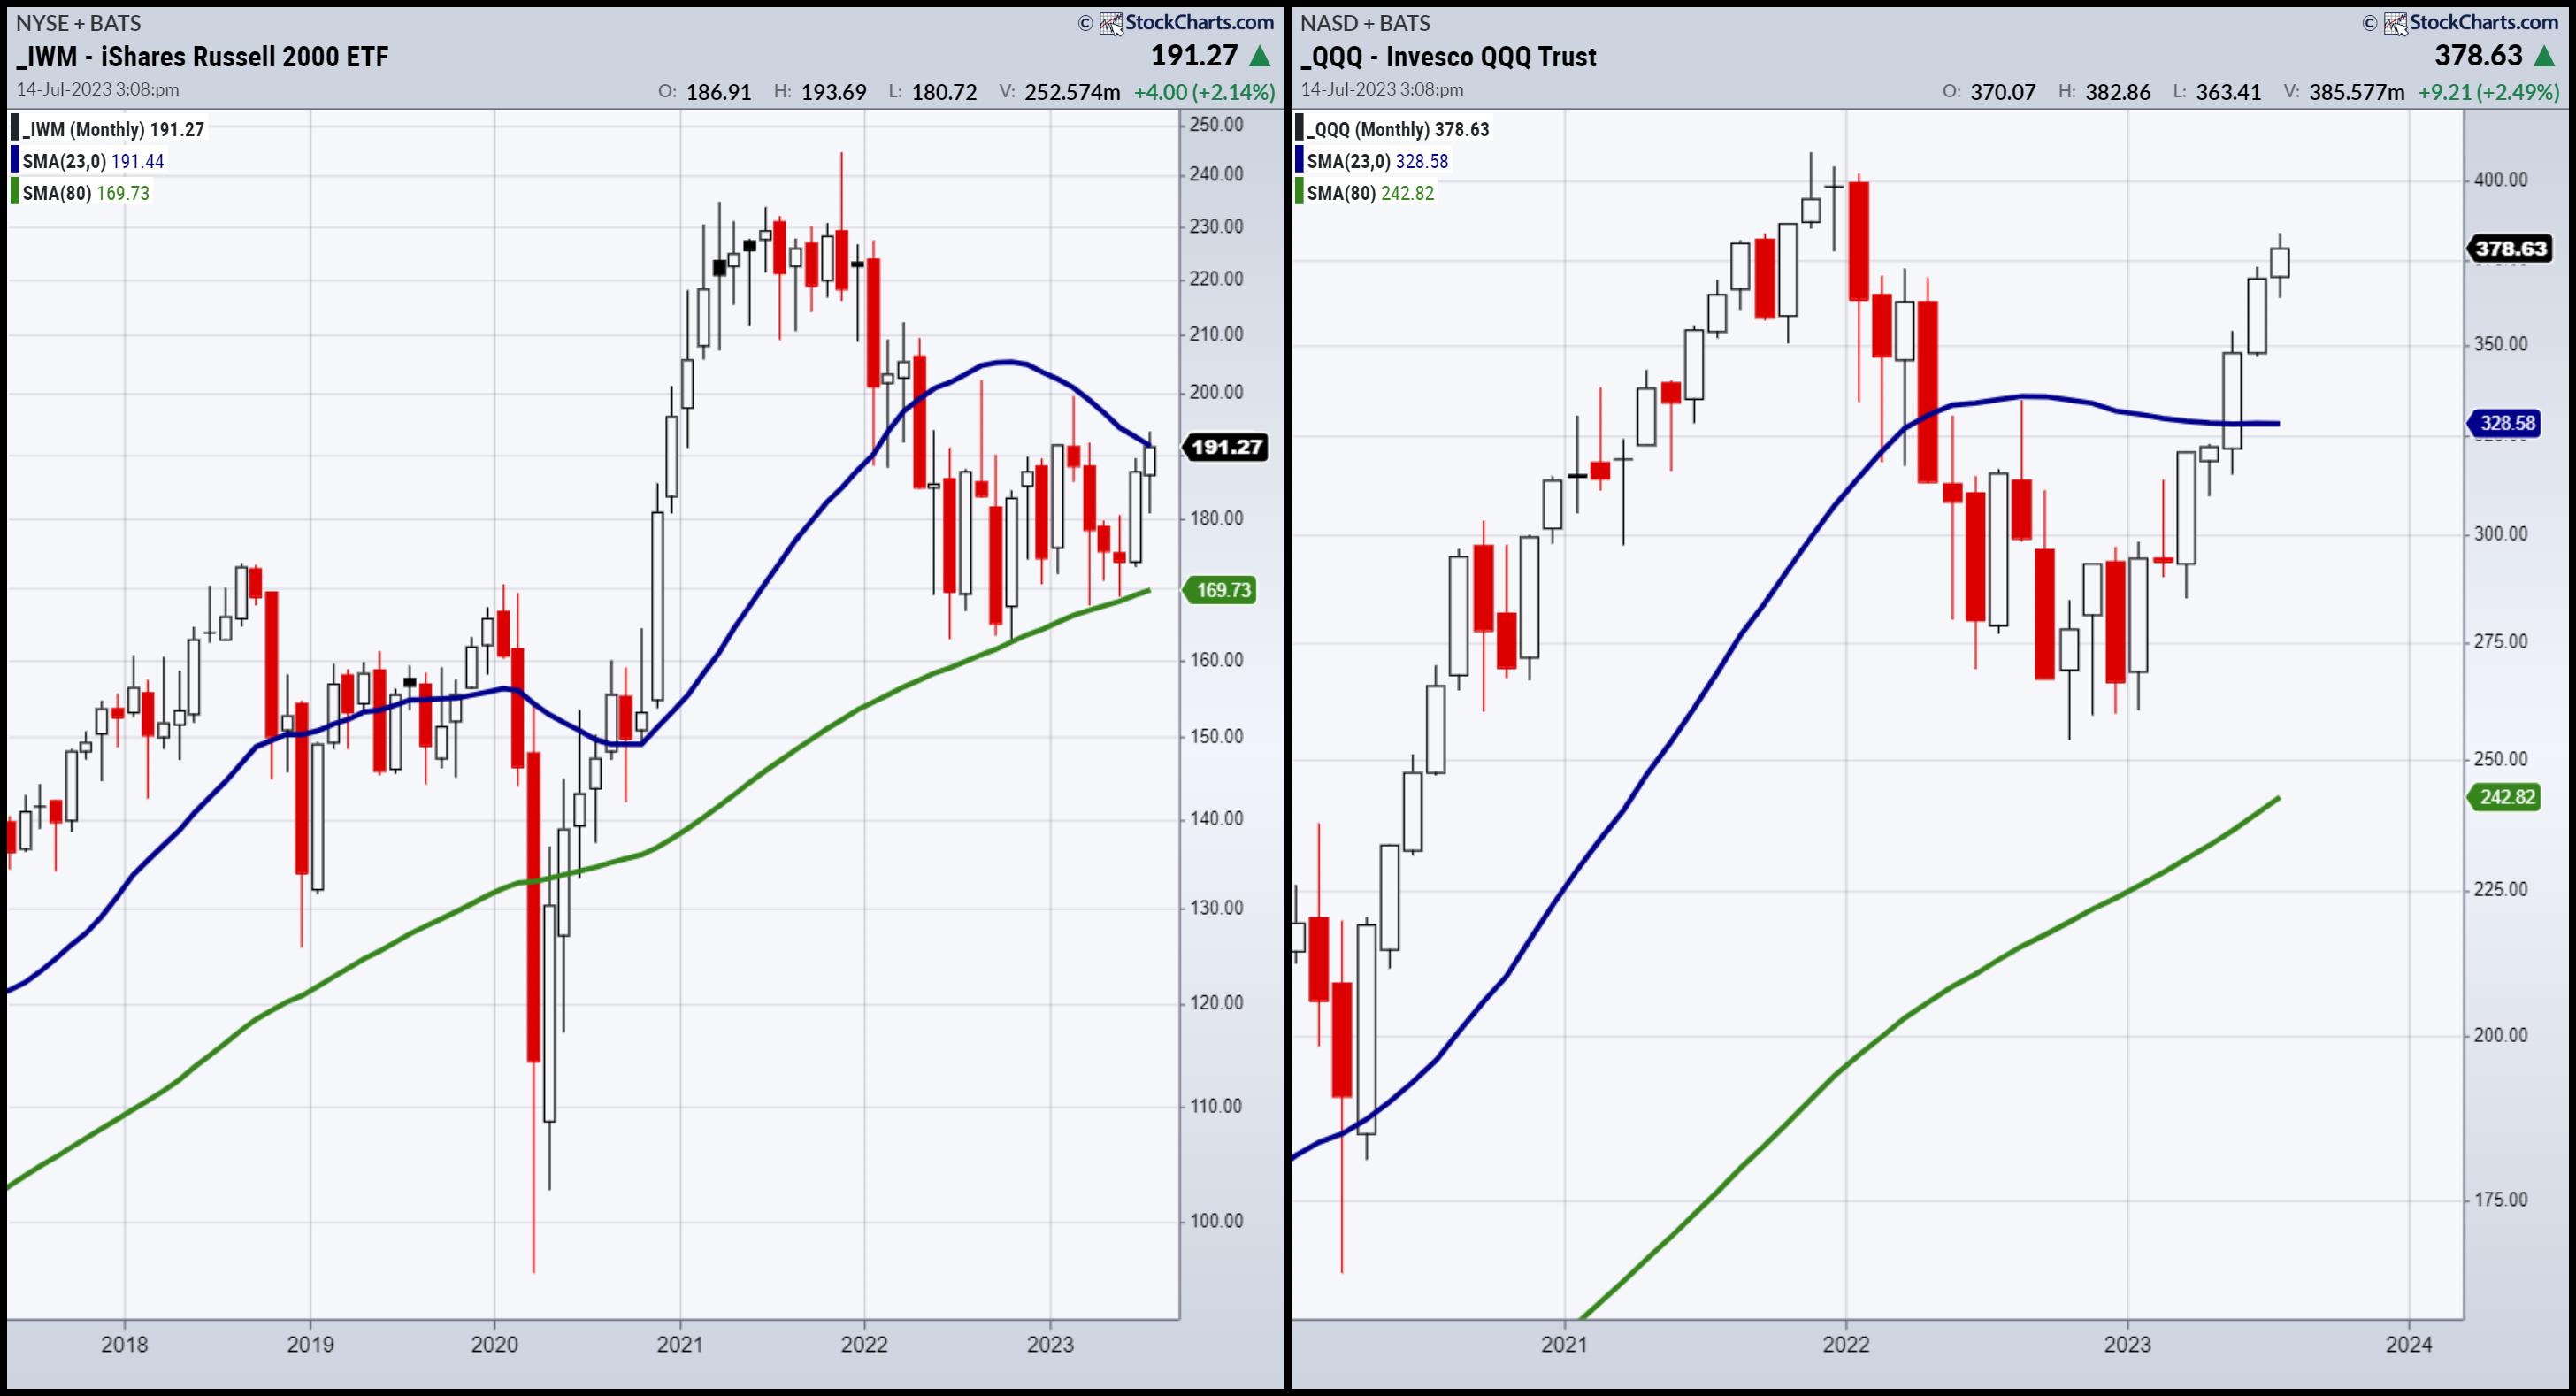
David and Goliath, or the Small vs. Large Caps
In the Bible story, David and Goliath represent resilience and overcoming odds. David, a small sheepherder, places a stone in a sling to hurl at Goliath's head. David gets a clean hit and Goliath falls. David then uses Goliath's sword to kill and decapitate the giant....
READ MORE
MEMBERS ONLY
How to Pick the Best Technical Indicator for You
by David Keller,
President and Chief Strategist, Sierra Alpha Research
In this special episode of StockCharts TV'sThe Final Bar, Dave answers questions from the mailbag on all things technical analysis and market strategy. He shares best practices on charting inflation rates, how the put/call ratio can be used for trend analysis, Elliott Wave corrective patterns, back testing...
READ MORE
MEMBERS ONLY

Breadth Overbought Near-Term

by TG Watkins,
Director of Stocks, Simpler Trading
On this week's edition of Moxie Indicator Minutes, TG notes that it's been a very strong 5 days and the market is starting to take a well-deserved break. This behavior is similar, but opposite, to the 5 down days we had the week before 4th of...
READ MORE
MEMBERS ONLY

Earnings Season in Full Swing: What You Can Expect

by Jayanthi Gopalakrishnan,
Director of Site Content, StockCharts.com
KEY TAKEAWAYS
* Positive momentum in the stock market is driving equities higher
* If earnings continue to be upbeat, the S&P 500 could reach its all time high
* Weaker US dollar is pushing commodity prices higher
As the trading week ends, the better-than-expected earnings from three big banks, Delta...
READ MORE
MEMBERS ONLY

Absolutely Everything Goes Up
by David Keller,
President and Chief Strategist, Sierra Alpha Research
KEY TAKEAWAYS
* The ARK Innovation ETF has been a chronic underperformer in recent years, but 2023 has seen a dramatic turnaround.
* The top holdings of ARKK, especially TSLA, COIN, and ROKU, have been the source of key gains this year.
* Renewed strength from emerging technology is part of a broader...
READ MORE
MEMBERS ONLY

Low Vol-to-High Beta Stock Rotation is Surging
by Julius de Kempenaer,
Senior Technical Analyst, StockCharts.com
KEY TAKEAWAYS
* High BETA vs Low Vol Comparison as an alternative Risk ON/OFF metric
* SPHB:SPLV showing strength for High BETA stocks in all three time frames (M,W,D)
* Preference for High BETA confirms current sector rotation out of defensive sectors
In this week's episode of...
READ MORE
MEMBERS ONLY
What The HECK?! Can an Inverted Yield Curve Really Be Bullish?
by Julius de Kempenaer,
Senior Technical Analyst, StockCharts.com
In this episode of StockCharts TV'sThe Final Bar, guest host Julius de Kempenaer talks to Todd Gordon of TradingAnalysis.com. They cover a broad spectrum of topics, ranging from the big macro picture, to growth value rotation, to the current strength in the consumer discretionary. In the 3-in-3...
READ MORE
MEMBERS ONLY
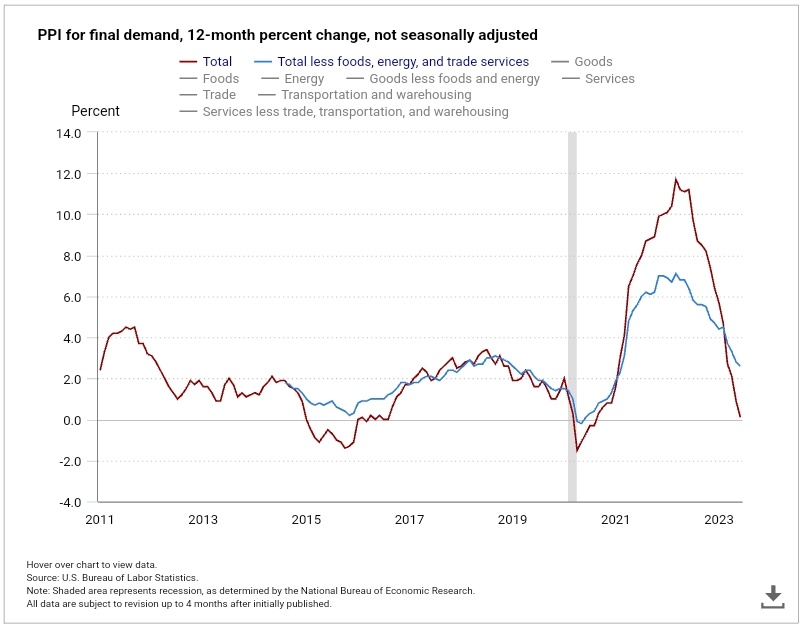
Is Inflation Permanently "Dissed"?
I wish I could say that the clearly impressive trend from peak until now in CPI and PPI is sustainable. However, I am more inclined to say "trough," with more chance of rising inflation numbers going forward rather than the chance of inflation falling further.
Here are some...
READ MORE
MEMBERS ONLY

GNG TV: "All About That Base(ing)" New Go Trends

by Alex Cole,
Co-founder, GoNoGo Charts®

by Tyler Wood,
Co-founder, GoNoGo Charts®
In this edition of the GoNoGo Charts show, Alex and Tyler discuss newly sprouting "Go" trends on an absolute and relative basis, across a wide variety of styles and sectors.
This video was originally recorded on July 13, 2023. Click this linkto watch on YouTube.
Learn more about...
READ MORE
MEMBERS ONLY

Watch These Critical Points in MACD Crossover Signals

by Joe Rabil,
President, Rabil Stock Research
On this week's edition of Stock Talk with Joe Rabil, Joe explains when a crossover signal is timely and when it is not. He also discusses what the crossover is actually telling us, using recent examples to help understand these critical points. Joe then analyses the symbols requests...
READ MORE
MEMBERS ONLY
Top 3 Pitfalls YOU Probably Make When Trading
by David Keller,
President and Chief Strategist, Sierra Alpha Research
In this episode of StockCharts TV'sThe Final Bar, guest Dave Landry, MBA of DaveLandry.com gives us 3 of the most common behavioral pitfalls that traders make. Host David Keller, CMT explores what leadership themes we can uncover after the major moves in today's market and...
READ MORE
MEMBERS ONLY
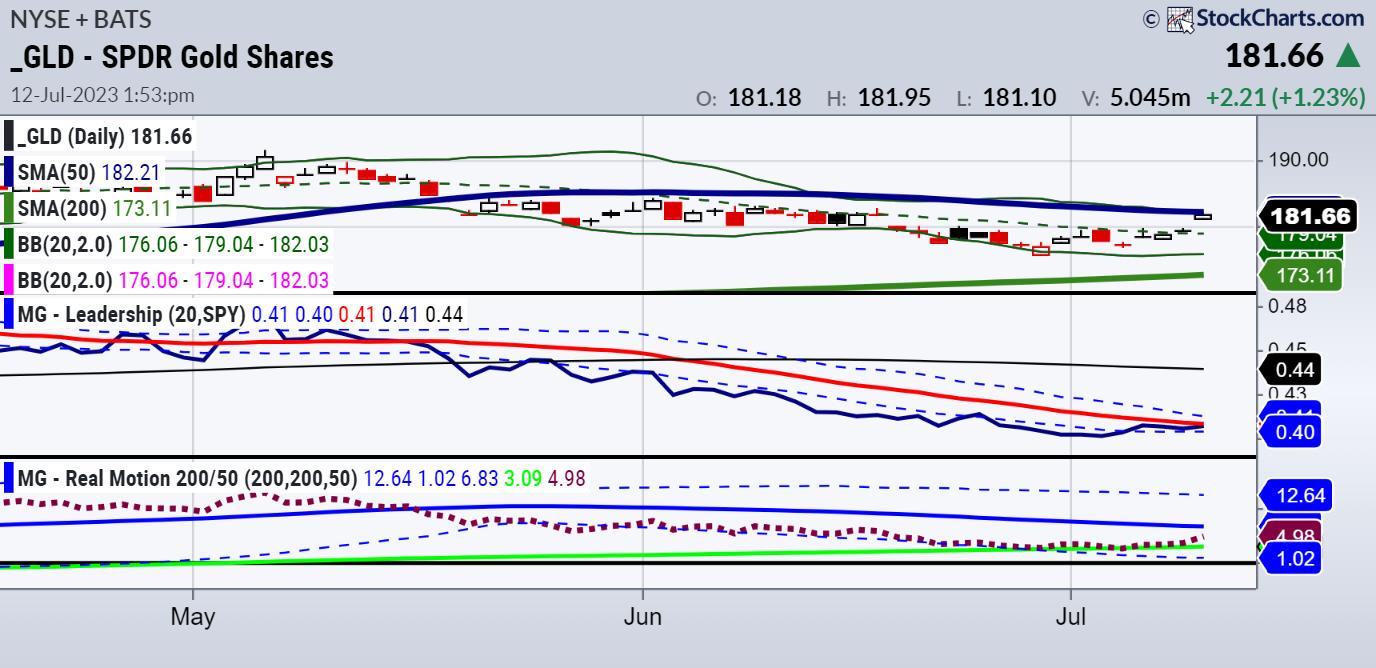
CPI, Bonds, Inflation, Indices and Gold
For today's daily, have a listen to Mish on Real Vision with Ash Bennington as they cover:
* CPI Inflation and market reaction
* What's going on in the Russell and Nasdaq
* How the Fed will respond
* Bonds
* Metals
* Inflation
For more detailed trading information about our blended...
READ MORE
MEMBERS ONLY

Bank Earnings Showdown: Emerging Trends You Need To Know
by Karl Montevirgen,
The StockCharts Insider
by Jayanthi Gopalakrishnan,
Director of Site Content, StockCharts.com
KEY TAKEAWAYS
* JP Morgan Chase is the leader of the pack and could see more upside
* If Wells Fargo beats earnings estimates, the stock may leave its choppy stock price movement behind
* Citigroup, the laggard, may need more than an earnings beat to push the stock higher
Bank earnings hold...
READ MORE
MEMBERS ONLY

The Only Setup That You'll Ever Need

by Dave Landry,
Founder, Sentive Trading, LLC
In this week's edition of Trading Simplified, Dave takes a break from his Jesse Livermore series to show his methodology in action.
Patience is one of the biggest secrets to successful trading. Great trends don't come along every day, so when they do, you have to...
READ MORE
MEMBERS ONLY
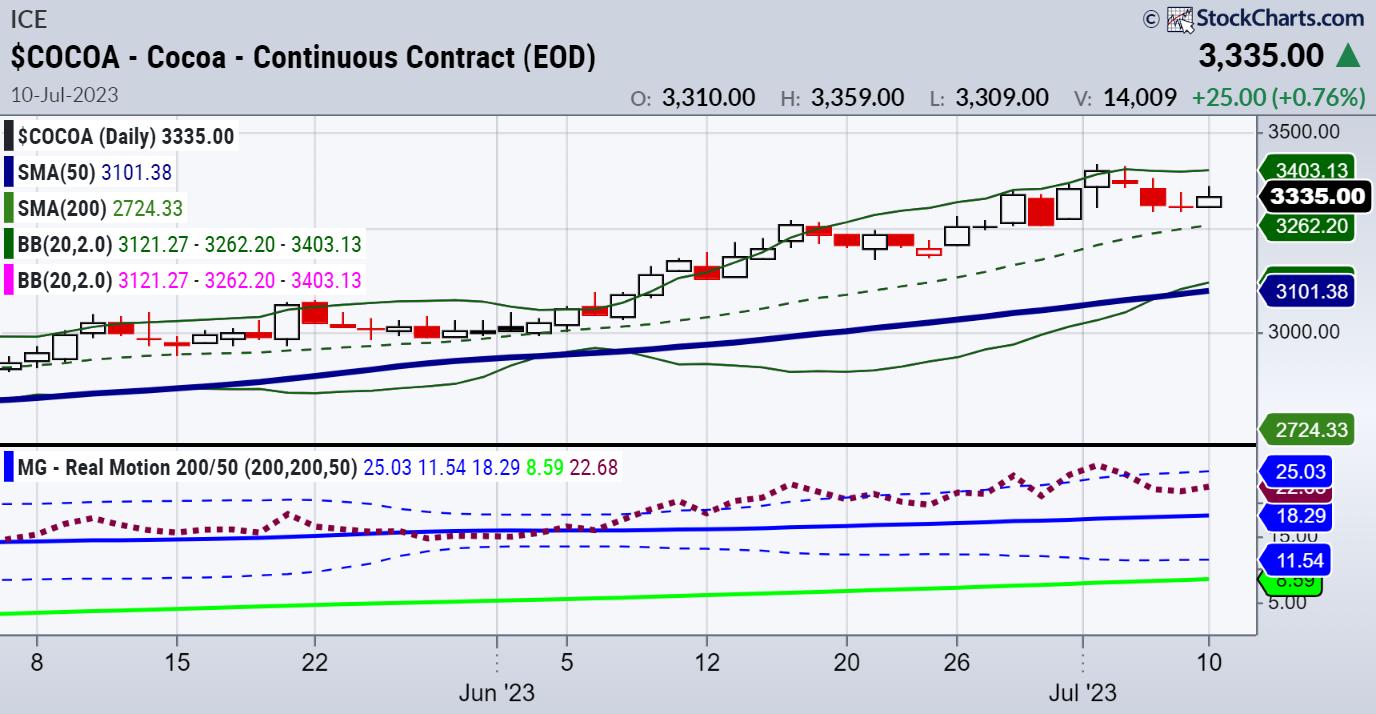
Cocoa Soars: Nobody Knows the Truffles I've Seen
On the heels of the CPI report, out first thing July 12th, and because of El Niño, West Africa expects to see lower average rainfall and higher.
West Africa is the main cocoa grower. The growing season began last October and ends this September. That means already damaged cocoa crops...
READ MORE
MEMBERS ONLY
One Chart SCREAMING Small-Caps Over Large-Caps
by David Keller,
President and Chief Strategist, Sierra Alpha Research
In this episode of StockCharts TV'sThe Final Bar, guest John Lewis of Dorsey Wright Money Management shares how his point & figure chart indicates upside potential for the Russell 2000 index. Host David Keller, CMT speaks to renewed strength in crude oil, energy stocks, NE, ROKU, and COIN....
READ MORE
MEMBERS ONLY
The Halftime Show: Screening for the Strongest Oversold Bullish Stocks
by Pete Carmasino,
Chief Market Strategist, Chaikin Analytics
In this week's edition of StockCharts TV'sHalftime, after sharing his take on current market news and headline events, Pete dives into the charts. Starting with the health of the broader market, he then covers the sectors before moving into his "strong stocks" screener.
This...
READ MORE
MEMBERS ONLY

DP Trading Room: Technology On Its Way Down?

by Erin Swenlin,
Vice President, DecisionPoint.com

by Carl Swenlin,
President and Founder, DecisionPoint.com
Technology has shown leadership on the way up, but will it show it on the way down? In this week's edition of The DecisionPoint Trading Room, Carl looks at the internals and a large double-top that is forming, while Erin covers the sectors in depth. They finish by...
READ MORE
MEMBERS ONLY
Industrials Ignite as Bitcoin Blasts Off
by David Keller,
President and Chief Strategist, Sierra Alpha Research
In this episode of StockCharts TV'sThe Final Bar, Dave highlights top performers in the industrial sector and tracks the renewed rally in Bitcoin after news of a $125K price target. He answers viewer questions on trailing stop indicators, exhaustion gaps, and support and resistance zones.
This video was...
READ MORE
MEMBERS ONLY

Technology Long-Term Double-Top?
by Erin Swenlin,
Vice President, DecisionPoint.com
Admittedly it is early, very early to make a pronouncement that a double-top is "in", but we do have a second top and it could be THE top. We've annotated the prior long-term top from 2021. Technology's bear market began in earnest at that...
READ MORE
MEMBERS ONLY
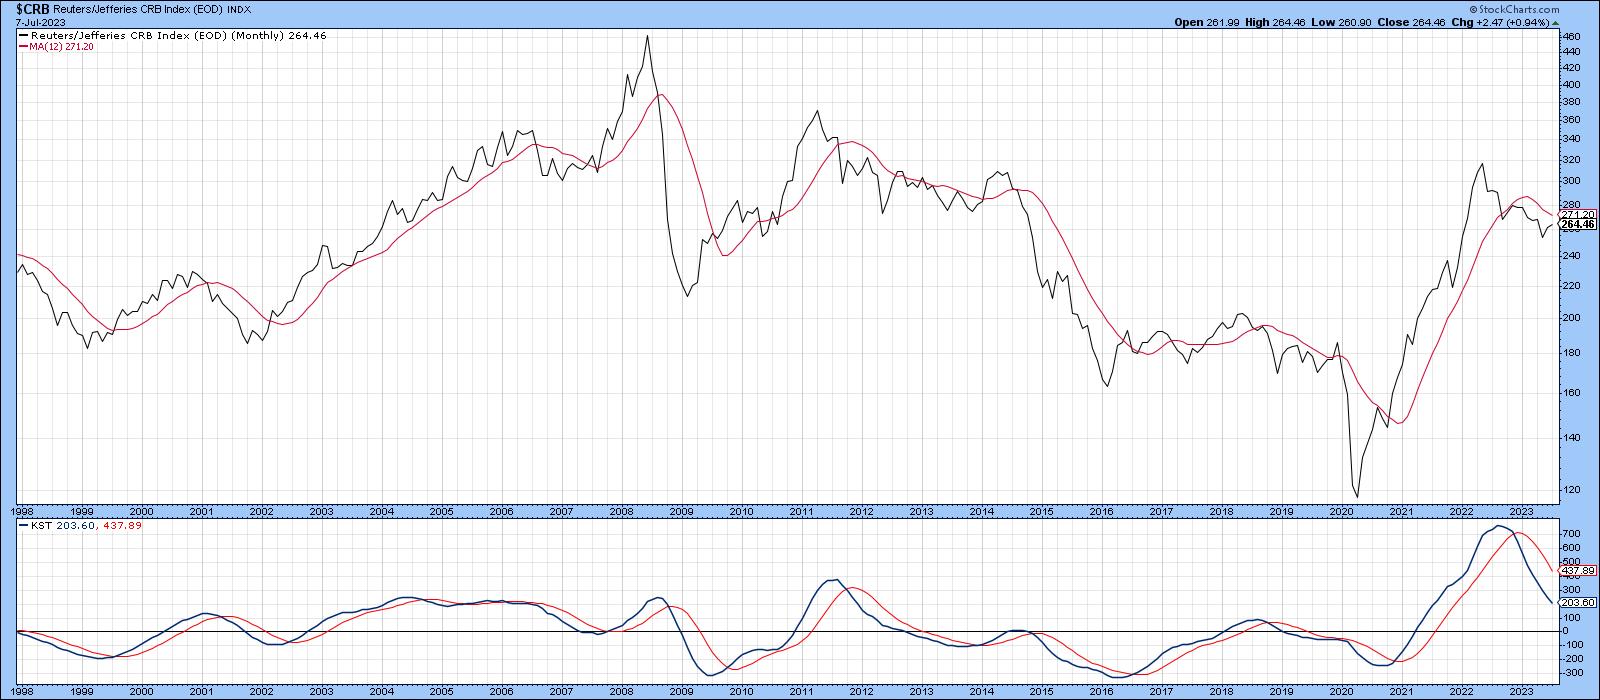
Commodities are in a Bear Market, But These Indicators Say That Could Soon Change
by Martin Pring,
President, Pring Research
I have been bearish on the primary trend of commodities for some time whilst still maintaining a bullish stance on their secular or very long-term trend. In other words, negative over a 9-month-to-2-year outlook, but constructive on a 10-to-20-year one. The secular aspect is important, because history shows primary bear...
READ MORE
MEMBERS ONLY
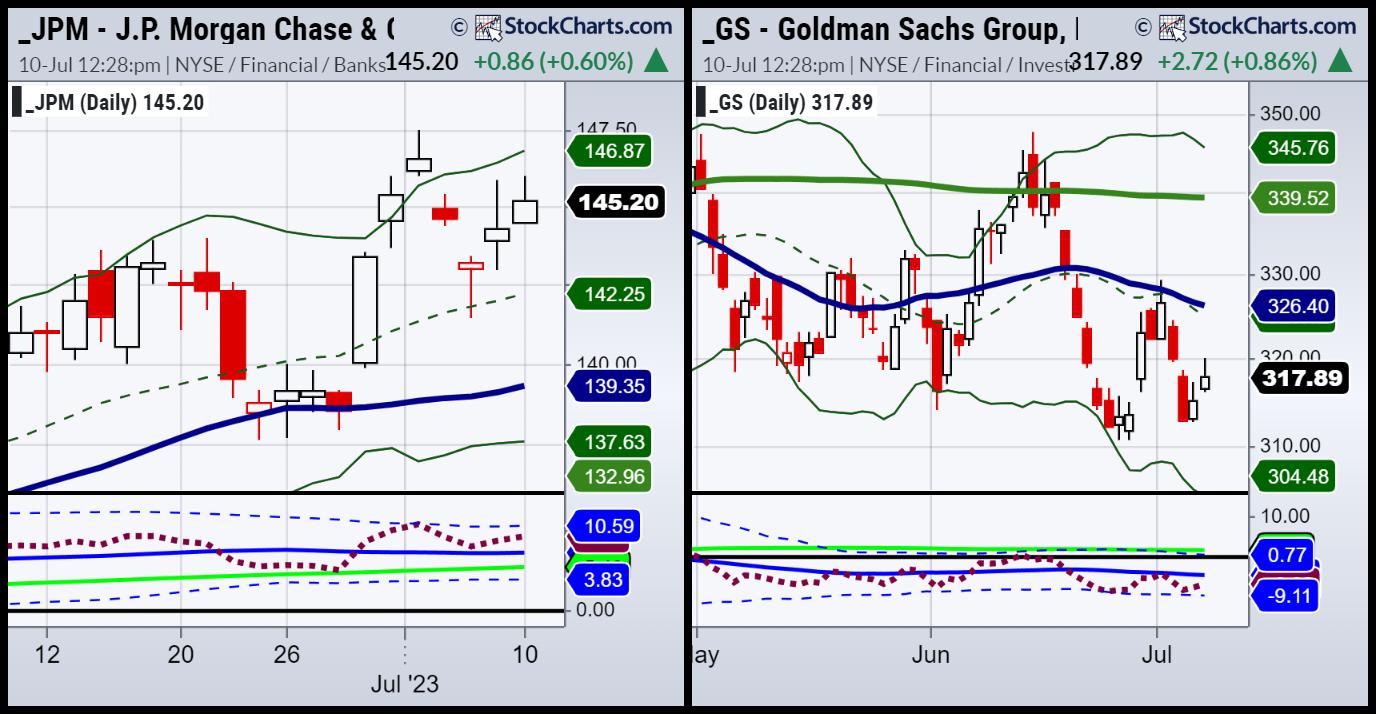
Bank Earnings: JP Morgan vs. Goldman Sachs
JP Morgan kicks off earnings season this Friday, July 14th. Goldman Sachs does not report until next week, on July 19th. That is an auspicious day for us, as the July 6-month calendar range will be established. We will be able to see how each bank and banks in general...
READ MORE
MEMBERS ONLY
Sector Spotlight: Sector Rotation Out of Defensive into Offensive
by Julius de Kempenaer,
Senior Technical Analyst, StockCharts.com
In this episode of StockCharts TV's Sector Spotlight, I go over the current status of asset class rotation, noting the ongoing strength for stocks vis-a-vis other asset classes. After that, he moves to sector rotation and uses the breakdown of the sector universe into offensive, defensive, and sensitive...
READ MORE
MEMBERS ONLY

Manipulation Around Earnings Season Is Insane!
by Tom Bowley,
Chief Market Strategist, EarningsBeats.com
Every quarterly earnings season, we hear the same thing on CNBC and other media outlets. "Earnings are going to be rough this quarter." Blah, blah, blah. After decades of technical, fundamental, and historical research, I've concluded that the games on Wall Street are designed to thoroughly...
READ MORE
MEMBERS ONLY

Week Ahead: NIFTY May Take Breather and Consolidate; Pick Stocks in a Selective Way
by Milan Vaishnav,
Founder and Technical Analyst, EquityResearch.asia and ChartWizard.ae
In the previous weekly technical outlook, it was mentioned that the markets have attempted a strong breakout which can be termed as a major one; this week, it showed some signs of tiredness while still managing to end the week on a positive note. The markets evidently showed some signs...
READ MORE
MEMBERS ONLY
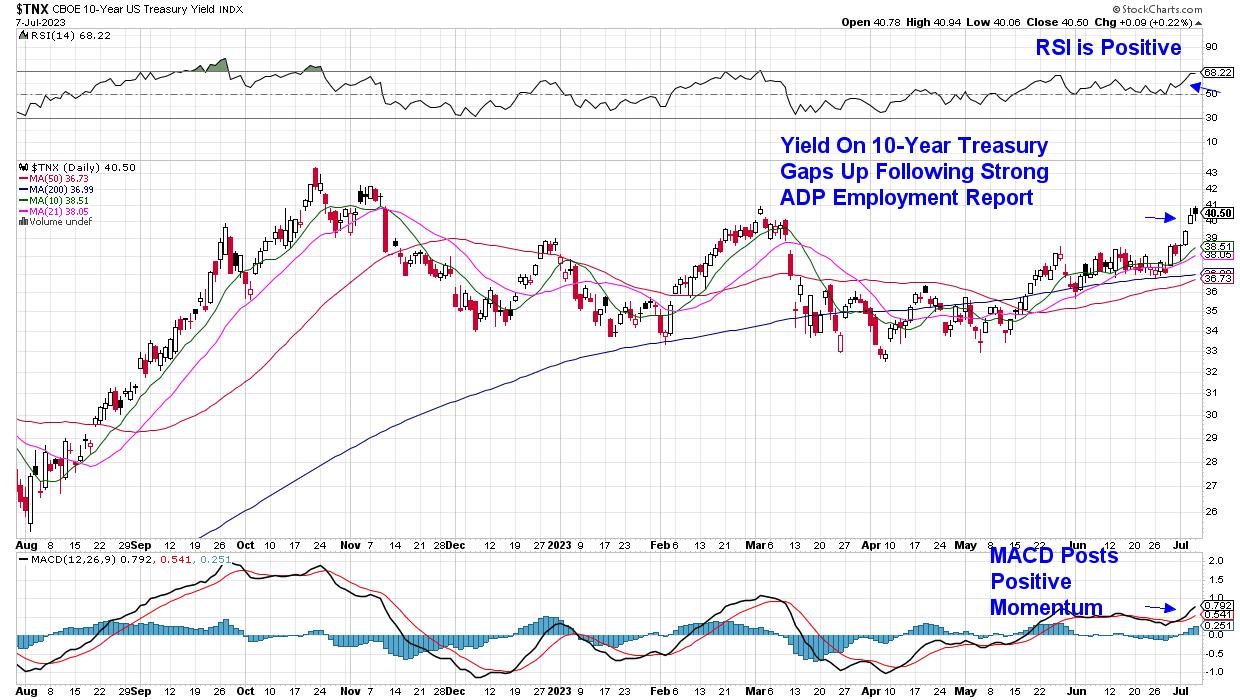
Interest Rates Are on The Rise--And That's Bad News for the Nasdaq
by Mary Ellen McGonagle,
President, MEM Investment Research
The stock market pulled back last week amid news of mixed economic data, as well as the release of notes from the Federal Reserve's latest meeting. Thursday's report from ADP that corporate hiring surged in June was the most impactful report, as it sparked an uptick...
READ MORE
MEMBERS ONLY
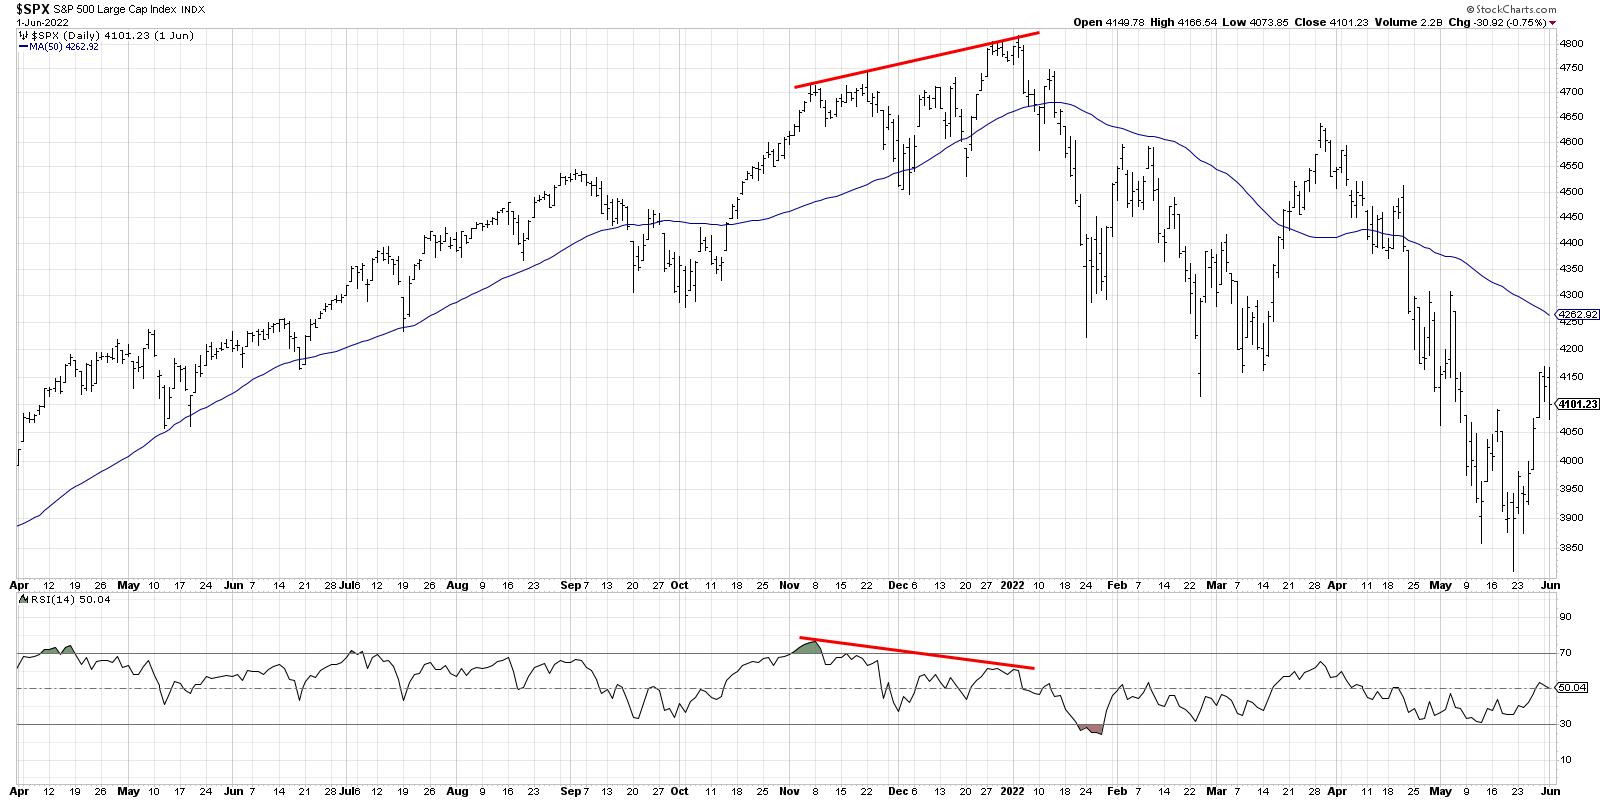
Three Key Charts Showing Bearish Divergences
by David Keller,
President and Chief Strategist, Sierra Alpha Research
KEY TAKEAWAYS
* Bearish momentum divergences suggest exhaustion for buyers after a long bullish phase.
* The 2021 market top was marked by a bearish momentum divergence for the S&P 500.
* Bearish divergences between price and RSI indicate potential downside for leading growth stocks, including AMZN and LRCX.
* The S&...
READ MORE
