MEMBERS ONLY

MEM TV: Sell Your Stock If It Does This

by Mary Ellen McGonagle,
President, MEM Investment Research
In this episode of StockCharts TV'sThe MEM Edge, Mary Ellen reviews pockets of strength amid last week's pullback that signal investor's bias heading into the second half of the year. She also shares key characteristics of successful base breakouts, as well as a rules-based...
READ MORE
MEMBERS ONLY

7 New Tools to Help You Chart Highs, Lows, and Other Crucial Price Levels

by Grayson Roze,
Chief Strategist, StockCharts.com
On this week's edition of StockCharts TV'sStockCharts in Focus, Grayson explores a unique new collection of 7 technical indicators designed to help you identify crucial support and resistance levels and more easily determine how far any security is trading from new highs or lows. You'...
READ MORE
MEMBERS ONLY

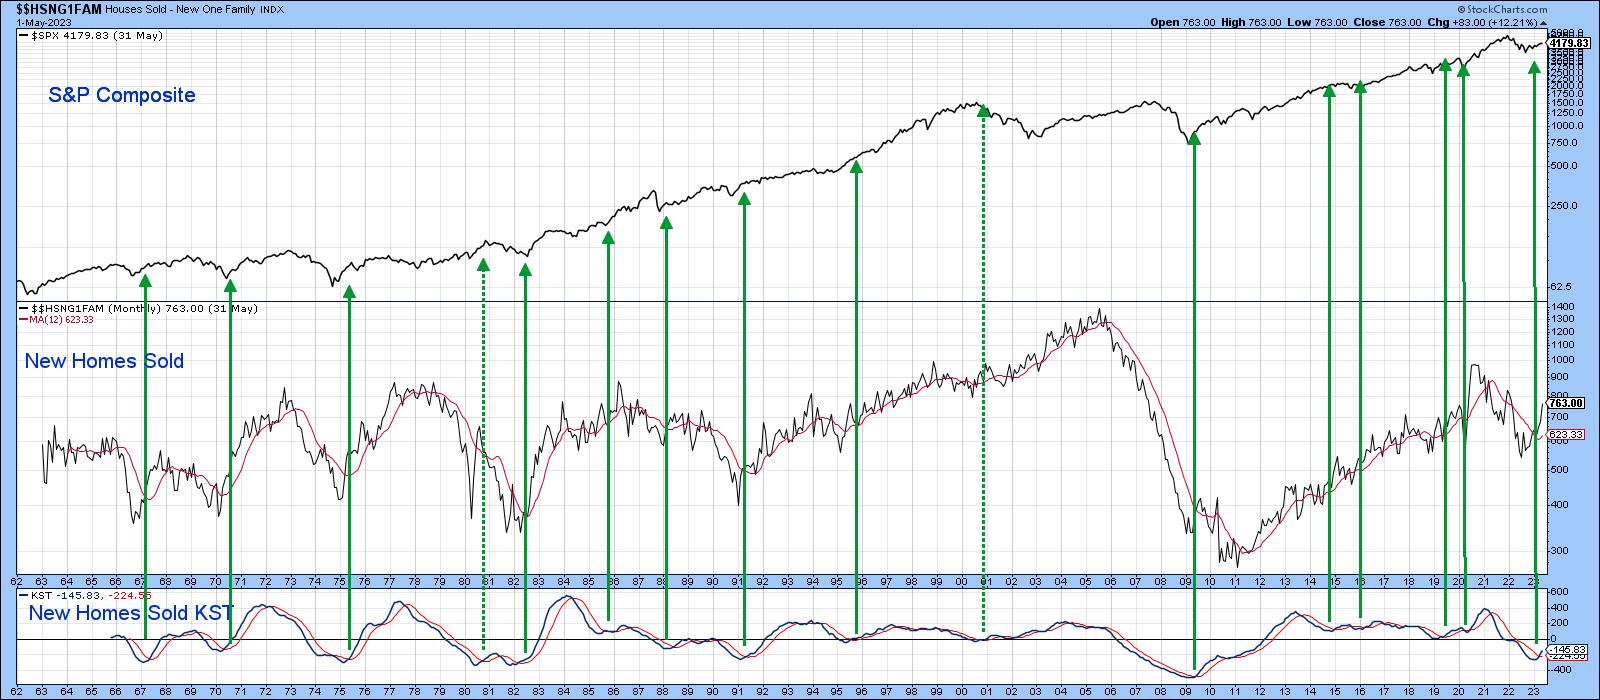
Economic Modern Family--Granny Retail Takes a Bow
Sometimes, it's just that simple.
The Economic Modern Familyhas had its share of rotation.By rotation this year, we mean that, while Semiconductors wowed, Regional Banks soured. We have looked to certain members of the Family to hold their lead and wait for the other members to catch...
READ MORE
MEMBERS ONLY

Bearish Divergences Cause Market to Drop

by David Keller,
President and Chief Strategist, Sierra Alpha Research
In this episode of StockCharts TV'sThe Final Bar, Dave wraps the week with a focus on a growing number of bearish momentum divergences, including on the S&P 500 index itself! He answers viewer questions on trailing stops, taking profits on strong performers, and running technical indicators...
READ MORE
MEMBERS ONLY

Fasten Your Seatbelts: Earnings Season in the Spotlight

by Jayanthi Gopalakrishnan,
Director of Site Content, StockCharts.com
KEY TAKEAWAYS
* The S&P 500 index is approaching its all-time highs
* Investors will be closely watching big bank earnings and their impact on the broader market
* Banking stocks could get a boost if banks report optimistic numbers
On Thursday, the ADP jobs number came in much higher than...
READ MORE
MEMBERS ONLY

Buy the Dips!

by TG Watkins,
Director of Stocks, Simpler Trading
On this week's edition of Moxie Indicator Minutes, TG explains that while the market is still strong out there, we just have to be patient for the right opportunities. Many stocks are flagging before they leg up. It's a fishing kind of market; buy the lows...
READ MORE
MEMBERS ONLY

Are Gold (GLD) and Silver (SLV) Poised for a Rebound?

by Karl Montevirgen,
The StockCharts Insider
KEY TAKEAWAYS
* US job numbers have stirred up worries about interest rates increasing, impacting the dollar and pushing down gold and silver prices
* Despite the downturn, gold and silver are showing signs of a potential comeback, given their resilience at key price levels
* The bull-bear battlefield can be seen in...
READ MORE
MEMBERS ONLY

OIL SERVICE STOCKS LEAD ENERGY SECTOR HIGHER

by John Murphy,
Chief Technical Analyst, StockCharts.com
ENERGY SECTOR LOOKS OVERSOLD... Energy stocks have been one of the year's weakest sectors. The daily bars in Chart 1 show the Energy SPDR (XLE) trading sideways since March and looking oversold. The XLE would need to clear its red 200-day average and falling trendline to signal a...
READ MORE
MEMBERS ONLY

Earnings, Inflation, Yield Curve & July Reset
Mish appeared on Yahoo Finance this morning with Brad Smith and Diane King Hall as a contributor/guest host.
Topics covered:
* Jobs Report
* Yield Curve and the Fed
* Tech and AI
* Earnings Season
* Inflation and impact on consumers
* Technical indicators to assess next market direction
* China
* Mother Nature
* Geopolitics and...
READ MORE
MEMBERS ONLY

GNG TV: CRUZ-ing into Summer!

by Alex Cole,
Co-founder, GoNoGo Charts®

by Tyler Wood,
Co-founder, GoNoGo Charts®
In this edition of the GoNoGo Charts show, Alex and Tyler take a top-down approach to analyzing the markets. As the temperature heats up, the duo look at the hottest assets, sectors and stocks. They finish by looking at multi-time frame analysis for Norwegian Cruise Lines (NCLH).
This video was...
READ MORE
MEMBERS ONLY
Secular Trends Contrasted with Deterioration
by David Keller,
President and Chief Strategist, Sierra Alpha Research
In this episode of StockCharts TV'sThe Final Bar, guest Mary Ann Bartels of Sanctuary Wealth reinforces the strength of long-term secular trends contrasted with short-term deterioration for growth stocks. Meanwhile, Dave highlights one of the FAANG stocks prominently displaying the dreaded bearish momentum divergence!
This video was originally...
READ MORE
MEMBERS ONLY

LUV Stock: Will Tailwinds Make the Stock Soar?
by Jayanthi Gopalakrishnan,
Director of Site Content, StockCharts.com
KEY TAKEAWAYS
* LUV stock has broken a downward sloping trendline on the weekly chart
* LUV's stock price has been gaining altitude rapidly since May
* LUV could be a potential buy if the stock's price holds the 200-day moving average
After a busy holiday travel weekend, it...
READ MORE
MEMBERS ONLY

Finding Wholesale Opportunities

by Joe Rabil,
President, Rabil Stock Research
On this week's edition of Stock Talk with Joe Rabil, Joe explains how to go about finding wholesale opportunities. He defines what that means by explaining the difference between Good Weakness and Bad Weakness. In addition, he goes through the 4 keys to each timeframe to help us...
READ MORE
MEMBERS ONLY

How Bad Could This Selling Get?

by Tom Bowley,
Chief Market Strategist, EarningsBeats.com
The first thing I always look at are the technical conditions. For me, that's a very simple analysis of price/volume. Here's what that looks like right now on the S&P 500 and NASDAQ 100:
S&P 500 ($SPX):
During any uptrend, I...
READ MORE
MEMBERS ONLY

Does Japan's Bullish Resurgence Have Staying Power?
by Karl Montevirgen,
The StockCharts Insider
KEY TAKEAWAYS
* After three quiet decades, Japanese stocks are making a comeback
* The rise is powered by factors like improved company management, cheaper stock prices compared to the US, a weaker yen, and companies giving more money back to shareholders
* The $64 price level is key for the MSCI Japan...
READ MORE
MEMBERS ONLY

Expect A Very Strong Earnings Report From This High Flyer!
by Tom Bowley,
Chief Market Strategist, EarningsBeats.com
We're about a week away from the start of Q2 earnings season, so now's the time to start doing your pre-earnings season homework. I'm not sure what that means to everyone else, but for me, it's all about evaluating relative strength. Which...
READ MORE
MEMBERS ONLY
Red Flags Raised by Bearish Engulfing Patterns
by David Keller,
President and Chief Strategist, Sierra Alpha Research
In this episode of StockCharts TV'sThe Final Bar, Dave talks through potential red flags on two key growth stocks as the market uptrend pushes into the second half of the year. He answers viewer questions on tracking "smart money" behavior, navigating double top patterns and scanning...
READ MORE
MEMBERS ONLY

The Halftime Show: Momentum on Our Side, But It's All About the Pace

by Pete Carmasino,
Chief Market Strategist, Chaikin Analytics
As the markets wake up from the holiday, they are anticipating, and worrying about, what the Fed's next move will be. In this week's edition of StockCharts TV'sHalftime, reflecting on a previous video, Pete points out that it's not what the Fed...
READ MORE
MEMBERS ONLY
Why Rising Short Rates Could be Bullish for Stocks

by Martin Pring,
President, Pring Research
There has been a notable shift in expectations concerning rate hikes going forward, as several Fed spokesmen have floated the idea of additional hikes later in the year. Rising interest rates are generally seen as a negative factor for stocks, as they increase borrowing costs for companies, lowering their profitability...
READ MORE
MEMBERS ONLY
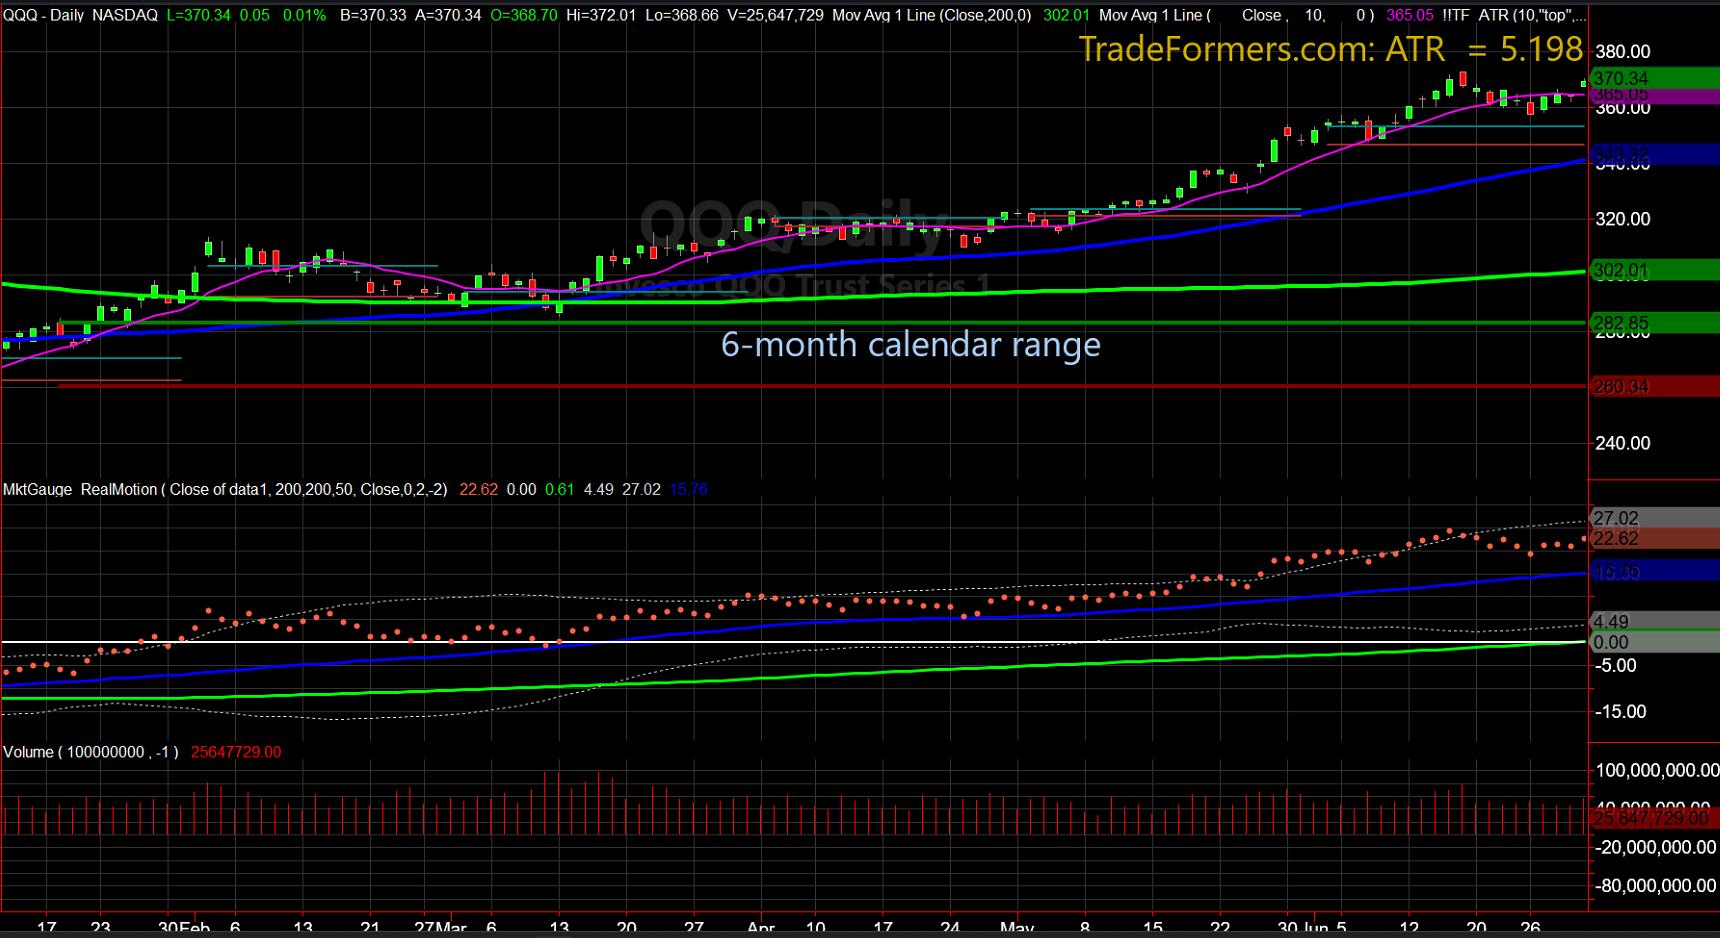
Sell in July and Go Away? Calendar Range Reset
One of the most interesting things about July in the market is the biannual reset of the 6-month calendar range. Above is a chart of the NASDAQ 100, with the January 6-month calendar range drawn in. (To clarify, it is the solid green line that goes perfectly horizontal across the...
READ MORE
MEMBERS ONLY
Top 10 Stocks to Watch in July 2023, Part 2
by Grayson Roze,
Chief Strategist, StockCharts.com
In this episode of StockCharts TV'sThe Final Bar, Part 2 of a two-part special examining the Top Ten Stocks to Watch in July 2023, Grayson Roze walks through #5-#1, including UBER, BLD, and more.
This video was originally broadcast on July 4, 2023. Click on the above...
READ MORE
MEMBERS ONLY
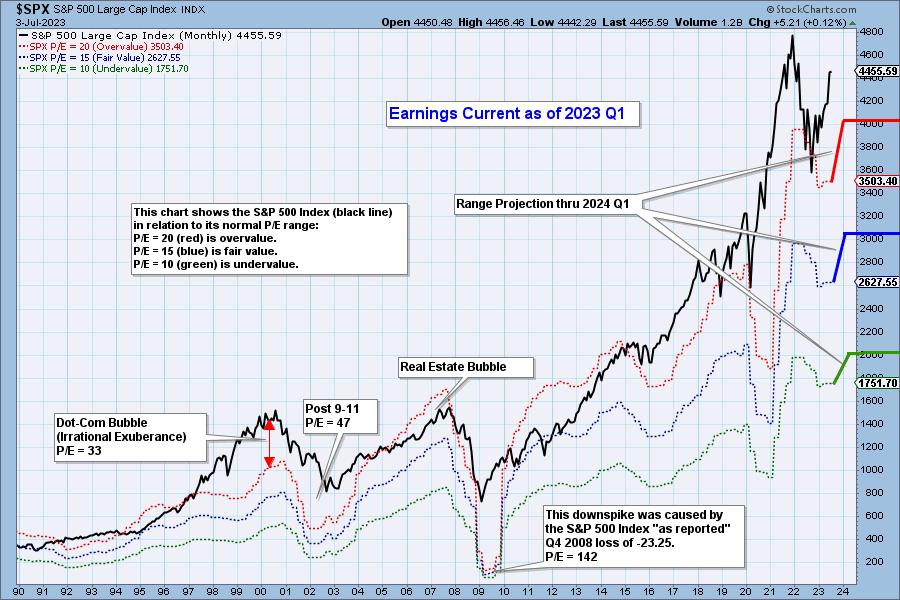
S&P 500 2023 Q1 Earnings Show Improvement

by Carl Swenlin,
President and Founder, DecisionPoint.com
The following chart shows the normal value range of the S&P 500 Index, indicating where the S&P 500 would have to be in order to have an overvalued P/E of 20 (red line), a fairly valued P/E of 15 (blue line), or an undervalued...
READ MORE
MEMBERS ONLY
Top 10 Stocks to Watch in July 2023, Part 1
by David Keller,
President and Chief Strategist, Sierra Alpha Research
In this episode of StockCharts TV'sThe Final Bar, Part 1 of a two-part special examining the Top Ten Stocks to Watch in July 2023, Dave covers #10-#6, including AAPL, FDX, and more. Stay tuned for Part 2 tomorrow, in which Grayson will follow up with #5-#1....
READ MORE
MEMBERS ONLY

Sector Spotlight: Two Sectors Hitting New All-Time Closing High

by Julius de Kempenaer,
Senior Technical Analyst, StockCharts.com
In this episode of StockCharts TV's Sector Spotlight, I assess the monthly charts following the end of June. Bond-related asset classes remain vulnerable, while commodities are struggling to remain afloat. The stock/bond ratio is now sending a very clear signal. In US sectors, all eyes are on...
READ MORE
MEMBERS ONLY

The First Half of 2023 Was Very Bullish, But What Should We Expect in the Second Half?
by Tom Bowley,
Chief Market Strategist, EarningsBeats.com
Have you noticed how every roadblock the bears use against the bulls just quietly goes away over time? I just chuckle. There have been SO many bullish signals over the past year, but pessimists/bears don't give in easily and that's actually good for the stock...
READ MORE
MEMBERS ONLY
A Glimpse at the Next 6 Months in the Markets
With last week's strong economic stats and inflation basically flatlined, many believe there will be a soft landing and no recession. However, there are stats saying that, with the yield curve so inverted (most since 1983), recession can and probably will still happen.
Recession can take time to...
READ MORE
MEMBERS ONLY

Week Ahead: NIFTY Makes Strong Attempt to Breakout; Extending the Move Crucial

by Milan Vaishnav,
Founder and Technical Analyst, EquityResearch.asia and ChartWizard.ae
After testing the prior top of 18887 multiple times during the last five sessions, the Indian equity markets finally attempted a long-awaited breakout by moving past this point and closing near the high point of the week. While the market breadth improved a bit, the volatility continued to remain near...
READ MORE
MEMBERS ONLY

What's Next for QQQ: Super Bullish to Super Bearish
by David Keller,
President and Chief Strategist, Sierra Alpha Research
Exactly how long is this raging bull market driven by mega-cap growth stocks supposed to last? I was taught that, when price trends higher over time, there would often be brief countertrend pullbacks along the way. Apple (AAPL) has completely ignored that market truismand managed to ride this unrelenting ascent...
READ MORE
MEMBERS ONLY
MEM TV: Three Key Signals That This Market Will Go Higher
by Mary Ellen McGonagle,
President, MEM Investment Research
In this episode of StockCharts TV'sThe MEM Edge, Mary Ellen highlights bullish characteristics exhibited during last week's rally while also reviewing what drove price action. She also shares the anatomy of a downtrend reversal and how to buy stocks on a pullback.
This video was originally...
READ MORE
MEMBERS ONLY
SNEAK PEEK! Revealing The Future Of StockCharts With New "Technology Previews"
by Grayson Roze,
Chief Strategist, StockCharts.com
On this week's edition of StockCharts TV'sStockCharts in Focus, Grayson presents an inside look at the next generation of StockCharts with this exclusive "Technology Preview". We're hard at work on new charting features, powerful trading tools and exciting enhancements across the entire...
READ MORE
MEMBERS ONLY

Is the Stock Market Overvalued? Here's How To Know
by Jayanthi Gopalakrishnan,
Director of Site Content, StockCharts.com
KEY TAKEAWAYS
* The Nasdaq 100 Index ($NDX) has outperformed the S&P 500, DJIA, and Nasdaq Composite
* Momentum indicators can help identify a slowing down in equities
* The difference between the 10 and 2-year Treasury spread is deeply inverted
The first half of 2023 is ending on a positive...
READ MORE
MEMBERS ONLY
Powerful 2-Timeframe Setup
by Joe Rabil,
President, Rabil Stock Research
On this week's edition of Stock Talk with Joe Rabil, Joe shows the criteria he is looking for when trading 2 timeframes. He covers the MA setup on both timeframes, price setup, and the preferred momentum conditions to this approach. This approach can be used in any 2...
READ MORE
MEMBERS ONLY
GNG TV: Rotation into Industrials, New "Go" Trend
by Alex Cole,
Co-founder, GoNoGo Charts®
by Tyler Wood,
Co-founder, GoNoGo Charts®
In this edition of the GoNoGo Charts show, Alex and Tyler review rangebound charts across macro drivers such as yields (TNX), currency (UUP), and commodities (GLD, USO). Relative stability offers a low volatility backdrop for Equities to sustain the bullish Go trend conditions. Within the S&P 500, rotation...
READ MORE
MEMBERS ONLY

Small-Cap Value Stocks Unexpected Driver for Market
by Julius de Kempenaer,
Senior Technical Analyst, StockCharts.com
KEY TAKEAWAYS
* Rotation continues in favor of growth
* Large Cap Segments Generally Beating Value
* Small-Cap Value Stocks Stand Out
Growth, Value, Size
It has been a while since I addressed the rotations of Growth vs. Value and their different size variations. The RRG above shows these rotations on the weekly...
READ MORE
MEMBERS ONLY

ECONOMICALLY-SENSITIVE STOCKS OUTPERFORM -- MATERIALS ON VERGE OF UPSIDE BREAKOUT
by John Murphy,
Chief Technical Analyst, StockCharts.com
TRANSPORTS GAIN, UTILITIES LOSE... Chart 1 shows transportation stocks rising while utilities are falling. The significance of the chart is that it suggests that investors are turning more positive. That's because stronger transports suggest a stronger economy while falling utilities show that investors are turning less defensive. Airlines...
READ MORE
MEMBERS ONLY

A Few Bitcoin Buy Targets (If You're Betting On a Thaw)
by Karl Montevirgen,
The StockCharts Insider
KEY TAKEAWAYS
* Institutional interest signals end of crypto winter
* Technical indicators show strong bullish momentum in Bitcoin, but also suggest a potential near-term pullback
* Bitcoin is a speculative trade driven largely by sentiment in absence of real fundamentals
Bitcoin has been on a strong but volatile uptrend over the last...
READ MORE
MEMBERS ONLY

U.S. Oil Reserves Drop to 40-Year Lows
On June 12th, Goldman Sachs (GS) came out stating how bearish they are on oil. I wrote a Daily about it on June 20th.
It's not uncommon for me to stick my neck out and go against the big analysts. Heck, I have made a career out of...
READ MORE
MEMBERS ONLY

The Wisdom of Jesse Livermore, Part 9

by Dave Landry,
Founder, Sentive Trading, LLC
In this week's edition of Trading Simplified, Dave shows his methodology in action with another "free roll," a "so long and thanks for all the fish" trade, a new mystery chart, and a not "dead money" trade. He also presents a trade...
READ MORE
MEMBERS ONLY
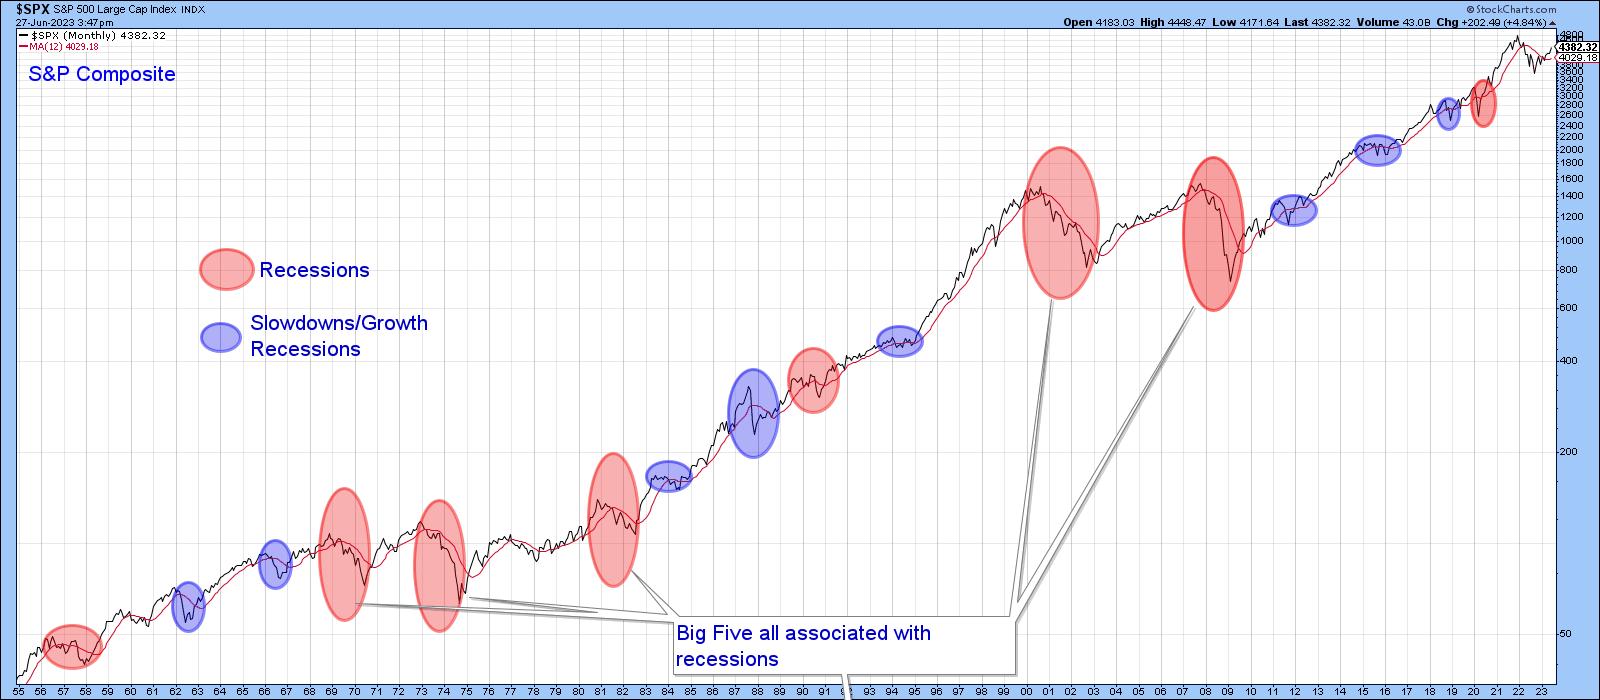
These Charts Explain Why Stocks Have Been Rallying Since October
by Martin Pring,
President, Pring Research
The ellipses in Chart 1 reflect economic events that have adversely affected the stock market since the 1950s. The pink ones reflect recessions, and those colored in blue indicate setbacks that anticipated economic slowdowns. Slowdowns develop when some economic sectors slip into recession, but that weakness is insufficient to push...
READ MORE
MEMBERS ONLY

Lululemon Stock: Try This Simple Analysis Before You Buy
by Jayanthi Gopalakrishnan,
Director of Site Content, StockCharts.com
KEY TAKEAWAYS
* Lululemon stock could move higher in sync with the Consumer Discretionary sector
* LULU is trending higher above its 200-week moving average
* LULU could find support at its 50-day simple moving average before moving higher
Athleisure wear became trendy during the pandemic—what's not to like about...
READ MORE
