MEMBERS ONLY

The Market's Muscle: What Broad Tech Strength Says About This Bull Run

by Jayanthi Gopalakrishnan,
Director of Site Content, StockCharts.com
Mega-cap tech stocks powered markets higher, but strength across the sector shows this rally is strong. Learn how to track it with these charts....
READ MORE
MEMBERS ONLY

When Market Leaders Falter: What Recent Moves in the Magnificent 7 Mean for Investors

by David Keller,
President and Chief Strategist, Sierra Alpha Research
As the Magnificent 7 dictate the tone for the S&P 500, their charts reveal early signs of fatigue amid mixed earnings reactions. Technical discipline remains essential as investors assess whether these former leaders can sustain their uptrends into year-end....
READ MORE
MEMBERS ONLY

The Lazy Trader’s Guide to StockCharts — Tools That Do the Work for You

by Grayson Roze,
Chief Strategist, StockCharts.com
Grayson Roze shows how to become the laziest chartist possible—without losing performance. Learn how StockCharts’ sample charts, chart packs, and scans can instantly build a pro-level setup in your account....
READ MORE
MEMBERS ONLY

MAG7 Powers Market; Breadth Wanes, But Still Bullish; QQQ Two Standard Deviation Move

by Arthur Hill,
Chief Technical Strategist, TrendInvestorPro.com
The primary driving forces in the stock market are the QQQ and key mega-cap companies. In this article, Arthur Hill shares his insights and observations on the technical price action in the Mag7 ETF and QQQ. ...
READ MORE
MEMBERS ONLY

StockCharts Insider: How to Find a Seasonal Edge in Stocks by Cracking the Market’s Hidden Calendar

by Karl Montevirgen,
The StockCharts Insider
Before We Dive In…
For every story a chart tells, there are stories hidden from plain view. One story tends to repeat itself almost like clockwork, though it also comes with variations. That’s what seasonality is all about: odd months where stocks tend to shine, stumble, or stall. In...
READ MORE
MEMBERS ONLY

Falling Rates, Rising Profits, and a Relentless Tech Rally

by Tom Bowley,
Chief Market Strategist, EarningsBeats.com
Earnings are surging, rates keep falling, and tech stocks are exploding higher. Tom Bowley breaks down the rally driving the Nasdaq to new highs and the sectors powering the market into year-end....
READ MORE
MEMBERS ONLY

Head and Shoulders Tops: Classic Signals, Key Phases, and a Surprise Reversal
by David Keller,
President and Chief Strategist, Sierra Alpha Research
Dave Keller explores the classic head and shoulders top, breaking down its three key phases with examples from JNJ and Dominion, plus a failed pattern in Nucor that turned into a bullish reversal....
READ MORE
MEMBERS ONLY

5 Stocks Showing Powerful ADX Signals

by Joe Rabil,
President, Rabil Stock Research
Joe Rabil explains how to use ADX to spot strength, trend, and breakout setups across different timeframes. He highlights five stocks with strong ADX patterns and reviews the latest S&P market conditions and stock requests to watch....
READ MORE
MEMBERS ONLY

Jensen > Jay: NVIDIA Takes the Spotlight from the Fed and Mag 7 Earnings
NVIDIA shares reached a record $5 trillion in market cap. Here's a deep dive into the stock's price action and what could keep it in the driver's seat....
READ MORE
MEMBERS ONLY

This Head and Shoulders Pattern Looked Perfect… Until It Failed!
by David Keller,
President and Chief Strategist, Sierra Alpha Research
Learn how to spot valid head and shoulders patterns and when to walk away. David Keller, CMT, shows how failed setups can signal strength and potential bullish reversals....
READ MORE
MEMBERS ONLY

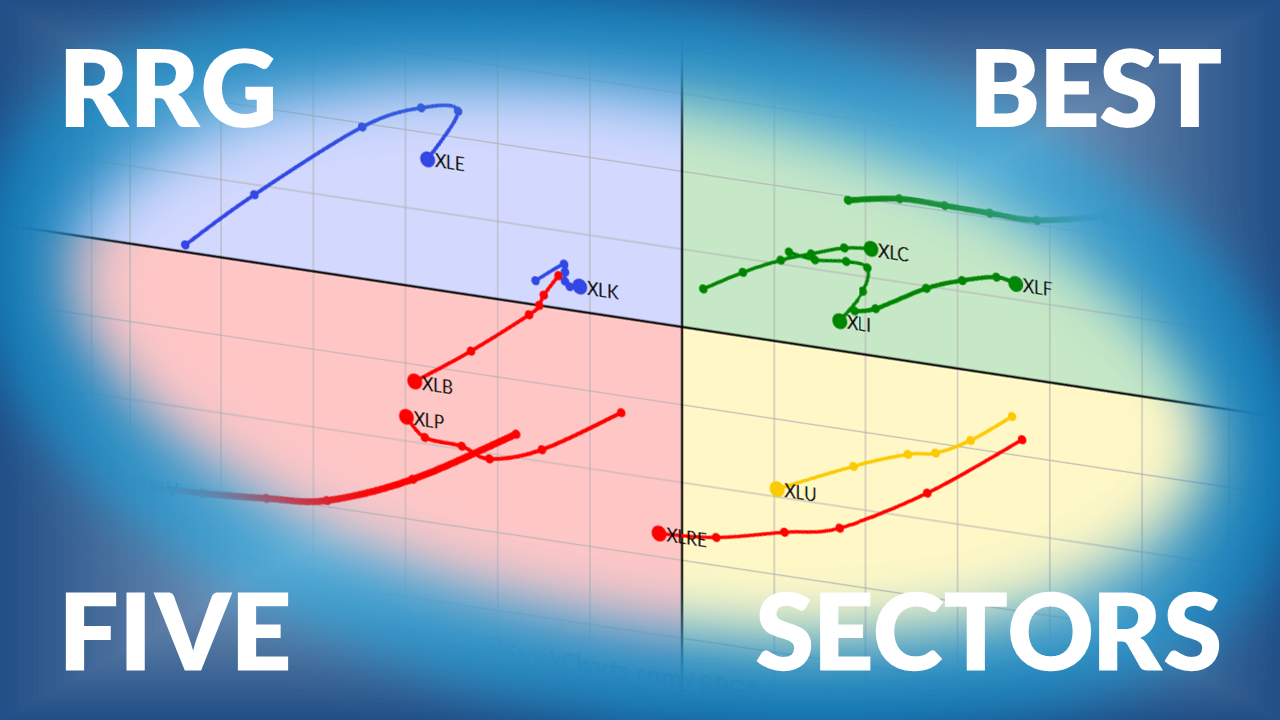
The Best Five Sectors This Week, #42

by Julius de Kempenaer,
Senior Technical Analyst, StockCharts.com
Weekly update on US sector rotation based on Relative Rotation Graphs....
READ MORE
MEMBERS ONLY

Year-End Rally Watch: How Sector Rotation Is Fueling the Bull Case
It's a market-moving week with the FOMC meeting, mega-cap earnings, and global trade headlines taking place. These tools will help you keep track of sector rotation, yield trends, and the next potential leg of the rally....
READ MORE
MEMBERS ONLY

The Week Ahead: Will Nifty Confirm a Trend Shift?

by Milan Vaishnav,
Founder and Technical Analyst, EquityResearch.asia and ChartWizard.ae
The Indian markets remained within a narrow range, but the NIFTY is making a breakout attempt. Can it move from consolidation to a trending phase?...
READ MORE
MEMBERS ONLY

Earnings Season Heats Up! New Leaders Emerging

by Mary Ellen McGonagle,
President, MEM Investment Research
Mary Ellen McGonagle highlights the new market leaders emerging as earnings season intensifies. Find out which setups and sectors are showing strength as the rally broadens beyond the mega-caps....
READ MORE
MEMBERS ONLY

Make Room, AI: This Sector Is Quietly Taking the Lead
by Mary Ellen McGonagle,
President, MEM Investment Research
The Health Care sector is emerging as the next area of strength. Mary Ellen presents a deep dive into the sector and a stock that could break out....
READ MORE
MEMBERS ONLY
Markets Back on Top! Here’s What’s Driving the Momentum
by Jayanthi Gopalakrishnan,
Director of Site Content, StockCharts.com
After taking a little breather, the market is back to setting new records. The Dow just topped 47,000 for the first time, and the S&P 500 and Nasdaq weren’t slackers either.
Here’s how the major indexes wrapped up the week.
* Dow Jones Industrial Average ($INDU)...
READ MORE
MEMBERS ONLY

3 Key Influences on Stock Performance; Bullish Continuation Patterns for Two Cybersecurity Stocks
by Arthur Hill,
Chief Technical Strategist, TrendInvestorPro.com
In a bullish market environment, with the technology sector leading the way and cybersecurity stocks in an uptrend, Arthur presents a couple of stocks that may be poised to break out....
READ MORE
MEMBERS ONLY

Three Charts That Prove the Power of Process Over Prediction
by David Keller,
President and Chief Strategist, Sierra Alpha Research
Technical analysis is about having a consistent process of evaluating the evidence. Dave revisits three charts he highlighted at the end of September, reviews how the technical picture has changed, and updates his thesis using price and momentum techniques....
READ MORE
MEMBERS ONLY

Strong Earnings and Lower Rates to Drive S&P 500 Higher
by Tom Bowley,
Chief Market Strategist, EarningsBeats.com
Falling U.S. Treasury yields have contributed to the bullish rally in equities. Here's an analysis of how the bull market can help identify leading industry groups and the stocks that lead the groups....
READ MORE
MEMBERS ONLY

Find High-Reward Counter-Trend Options Before They Break Out

by Tony Zhang,
Chief Strategist, OptionsPlay
Catch market reversals before the crowd! Tony Zhang reveals how to scan, rank and trade high-probability options setups with the OptionsPlay Add-on for StockCharts....
READ MORE
MEMBERS ONLY

StockCharts Insider: GMMA—Your Market X-Ray
by Karl Montevirgen,
The StockCharts Insider
Before We Dive In…
You’re about to learn something unique: how to gauge trend strength and seize market opportunities using two sets of eyes. The GMMA splits price action into short-term and long-term views, giving you two perspectives on the same market. With one eye on fast-money moves and...
READ MORE
MEMBERS ONLY

Will These Broken Charts Overcome Bearish Divergences?
by David Keller,
President and Chief Strategist, Sierra Alpha Research
Bearish momentum divergences can help provide a game plan for confirming potential price breakdowns. We review three charts to see how they have evolved since a bearish rotation, and focus on identifying potential entry points for the next rally phase....
READ MORE
MEMBERS ONLY
The Best Five Sectors This Week, #41
by Julius de Kempenaer,
Senior Technical Analyst, StockCharts.com
Weekly update on Sector Rotation based on Relative Rotation Graphs...
READ MORE
MEMBERS ONLY

StockCharts Insider: The Cloud Hack Many Traders Overlook (But Shouldn’t)
by Karl Montevirgen,
The StockCharts Insider
Before We Dive In…
Here’s today’s play: you’ll run the Entered Ichimoku Cloud scan to spot buy-the-dip candidates, use the SCTR to find the strongest stocks, and then you’ll flip to the charts to see which candidates may be worth pursuing. Plus, you’ll learn how...
READ MORE
MEMBERS ONLY

Week Ahead: Nifty Breaks Symmetry, But Breadth and VIX Signal Caution
by Milan Vaishnav,
Founder and Technical Analyst, EquityResearch.asia and ChartWizard.ae
The Nifty broke out above a long-running symmetrical triangle pattern. But with weak market breadth and a spike in volatility, how vulnerable is this rally?...
READ MORE
MEMBERS ONLY
A Steady Week with a Little Market Drama
by Jayanthi Gopalakrishnan,
Director of Site Content, StockCharts.com
It was one of those weeks! The stock market traded in a relatively flat range, although there were a few bursts of volatility. Overall, things were relatively stable, with the broader indexes staying within last Friday’s trading range.
We did get a little bit of a scare on Thursday...
READ MORE
MEMBERS ONLY

The Dreaded Hindenburg Omen Fires Again
by David Keller,
President and Chief Strategist, Sierra Alpha Research
The Hindenburg Omen is a macro technical indicator which was designed by reviewing the common characteristics of previous bull market tops. Dave breaks down the components of this indicator, reviews signals from the last 10 years, and discusses implications for the S&P 500 in Q4 2025....
READ MORE
MEMBERS ONLY

The StockCharts Game Show: Can You Beat These StockCharts Pros?
by Tom Bowley,
Chief Market Strategist, EarningsBeats.com
by Julius de Kempenaer,
Senior Technical Analyst, StockCharts.com
by Grayson Roze,
Chief Strategist, StockCharts.com
Grayson Roze hosts Tom Bowley and Julius de Kempenaer in a fast-paced StockCharts Game Show showdown! See who dominates in this fun, competitive battle of charting tools, trading terms, and quick wit....
READ MORE