MEMBERS ONLY
The Economic Modern Family & the MOST IMPORTANT Data Ever
Admittedly, numbers are sexy.
Think about how much focus all the economic stats that came out this past week got on all media. Each one was the defining one for the markets and economy, according to the talking heads.
CPI and PPI softer? That's it, inflation is over....
READ MORE
MEMBERS ONLY

MEM TV: Earnings Season Pumps Markets

by Mary Ellen McGonagle,
President, MEM Investment Research
In this episode of StockCharts TV'sThe MEM Edge, Mary Ellen reviews the market's price action and which sectors are outperforming as inflation fades and the economy weakens. She also shares the sharp impact that earnings are having on select stocks.
This video was originally broadcast on...
READ MORE
MEMBERS ONLY

Bullish Moxie Setups Working

by TG Watkins,
Director of Stocks, Simpler Trading
On this week's edition of Moxie Indicator Minutes, TG shows how he has had a bullish lean to the markets and how that has been setting up with the indexes and a few tickers. The market seems to have liked the PPI report, and so Thursday was a...
READ MORE
MEMBERS ONLY

AN INTERMARKET LOOK AT GOLD

by John Murphy,
Chief Technical Analyst, StockCharts.com
GOLD RALLY STALLS AT OVERHEAD RESISTANCE... Gold has risen to the highest level in a year and has been attracting a lot of attention lately. Gold is traditionally viewed as a safe haven asset when investors are concerned about the state of the economy in an inflationary environment. The weekly...
READ MORE
MEMBERS ONLY

Overbought until it Turns – Using the McClellan Oscillator for Condition and the PPO for Timing

by Arthur Hill,
Chief Technical Strategist, TrendInvestorPro.com
Overbought and oversold conditions are tricky because stocks can become overbought/oversold and remain overbought/oversold as the move continues. This is why traders need another indicator or chart signal for confirmation. Today's article to look at some recent overbought/oversold conditions and use the PPO for timing....
READ MORE
MEMBERS ONLY

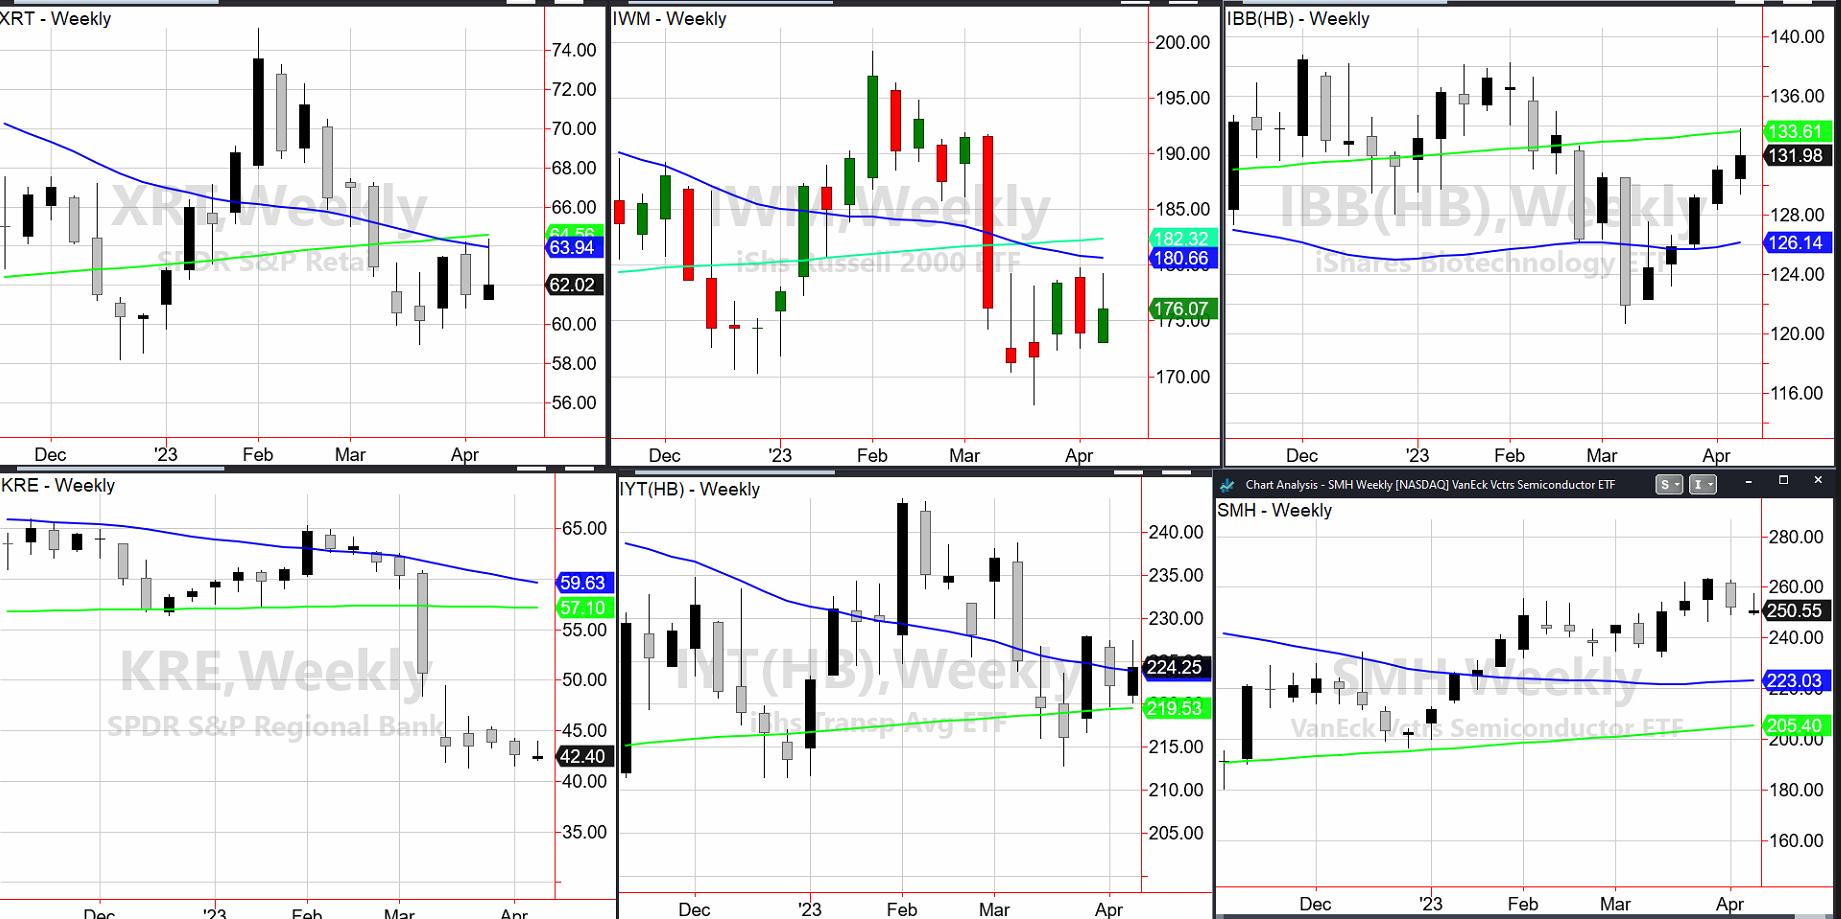
Oil, Chips and 4 Indices
For today, please enjoy a video taking you through the ever important energy and chips sectors along with the 23-month moving averages in the 4 indices.
For more detailed trading information about our blended models, tools and trader education courses, contact Rob Quinn, our Chief Strategy Consultant, to learn more....
READ MORE
MEMBERS ONLY

GNG TV: "Go" Trends at Resistance Means Reversion

by Alex Cole,
Co-founder, GoNoGo Charts®

by Tyler Wood,
Co-founder, GoNoGo Charts®
Mean reversion is the opposite of trend following. Investment strategies that leverage this occurrence, look to profit on countertrend moves. After an extended price move, asset prices can return to normal or average levels, either within a trading range or within standard deviations of a moving average or trend line....
READ MORE
MEMBERS ONLY

Mild Recession? Three Indicators That Can Offer Insights

by Karl Montevirgen,
The StockCharts Insider

by Jayanthi Gopalakrishnan,
Director of Site Content, StockCharts.com
It's all about inflation and earnings. Will the Fed continue to raise interest rates after two key gauges of prices came in lower than estimates? After the recent regional bank fallout, will bank earnings be strong enough to lift the Financial sector out of its doldrums?
The government&...
READ MORE
MEMBERS ONLY

How You Can Reduce Risk and Improve Timing When Swing Trading

by Joe Rabil,
President, Rabil Stock Research
On this week's edition of Stock Talk with Joe Rabil, Joe shows how he uses multiple time frames to reduce risk and improve timing when swing trading. He explains what qualifies as a setup, what to look for as a trigger, and how to use the upper timeframe...
READ MORE
MEMBERS ONLY

Bullish Compression in Consumer Staples
The Complete Trader, which we have featured in previous Dailys, is one of my favorite go-tos for trading ideas.
The columns help determine the trade setup. For example, an "Inside Day" that is also in a bullish stock phase. Also a narrow range that shows a narrower trading...
READ MORE
MEMBERS ONLY

Bonds Like to Move It: How to Forecast Market Volatility
by Jayanthi Gopalakrishnan,
Director of Site Content, StockCharts.com
Occasionally, the stock market gets hit with unpredictable black swan events. These throw the market into panic mode and send investors rushing to sell their positions. It can be a terrifying experience for individual investors and traders. Wouldn't it be great to see market volatility ahead of time?...
READ MORE
MEMBERS ONLY

A Day in the Life of a Trader

by Dave Landry,
Founder, Sentive Trading, LLC
Have you ever wondered what a trader does during a trading day? This is the episode for you! In this week's edition of Trading Simplified, Dave walks you through his daily routine, from waking up until bedtime. He also shares a setup that triggered in his "Methodology...
READ MORE
MEMBERS ONLY

Sector Spotlight: Surge in Oil Revives Rotation to Energy Stocks

by Julius de Kempenaer,
Senior Technical Analyst, StockCharts.com
On this episode of StockCharts TV's Sector Spotlight, I put the spotlight on Energy, starting off with a look at the rotation of various commodity groups and a focus on the group of Energy-related commodities. Following this assessment, I move to the Energy sector and the stocks inside...
READ MORE
MEMBERS ONLY
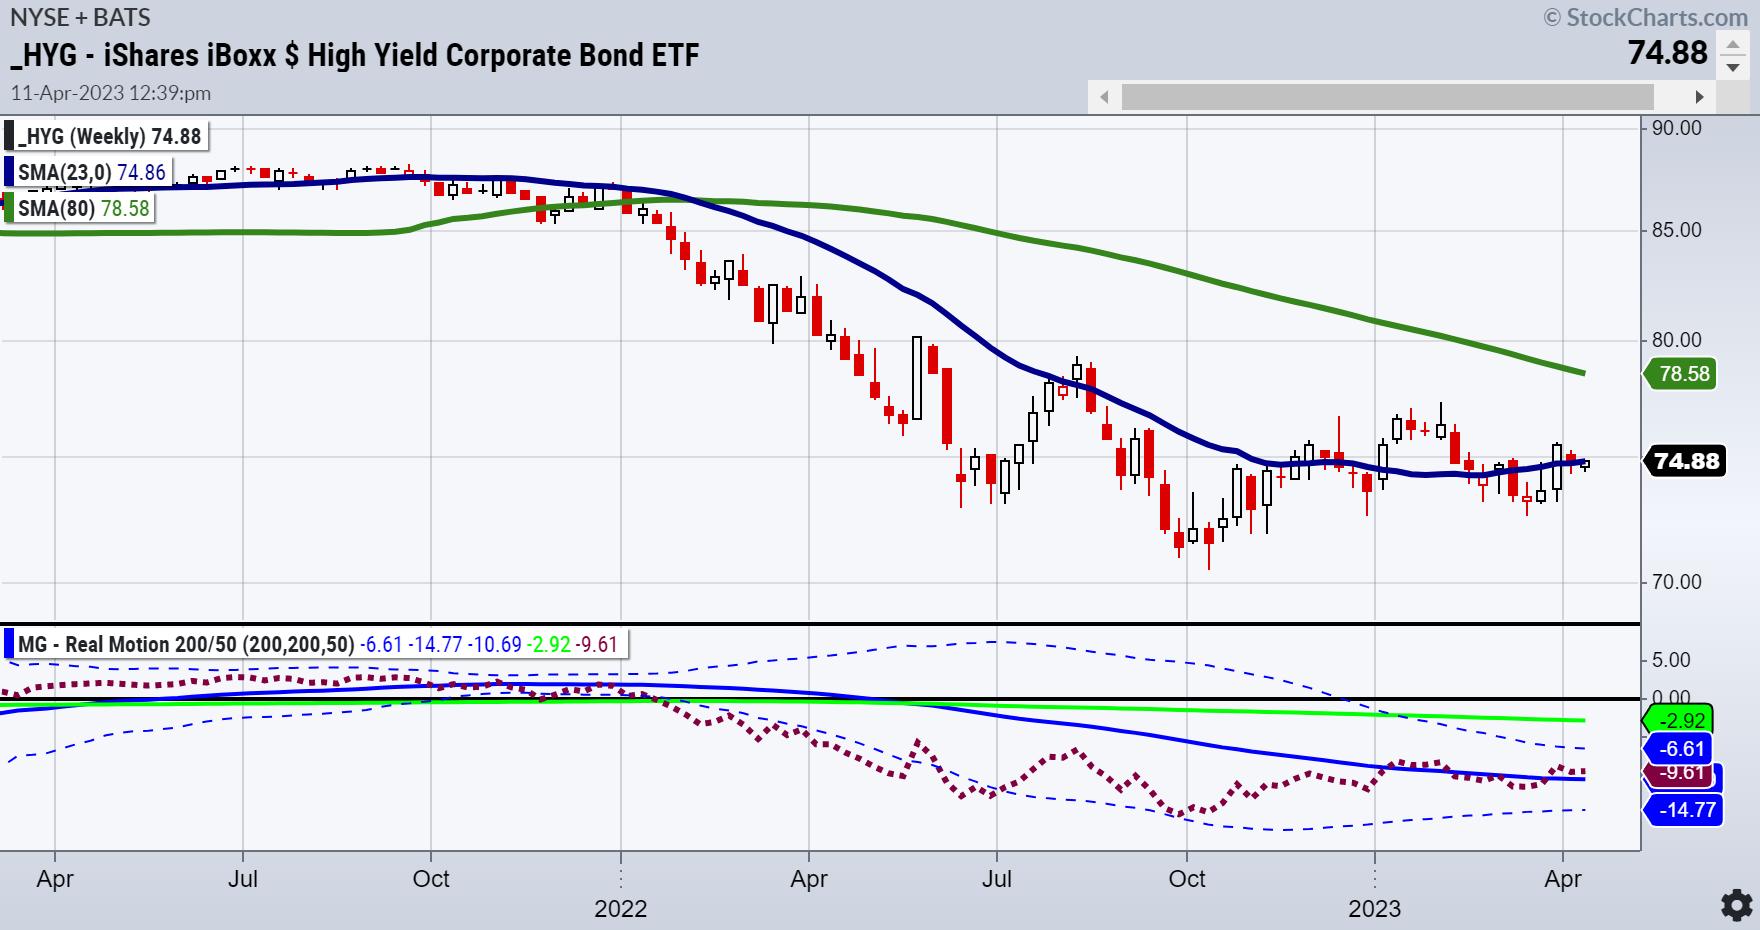
Junk Bonds: Best Equity Predictor
Junk bonds are high-risk, high-yield bonds issued by companies with lower credit ratings. These bonds are also known as speculative-grade bonds or high-yield bonds, as they offer a higher rate of return than investment-grade bonds, but come with a higher risk of default. Companies that issue junk bonds have lower...
READ MORE
MEMBERS ONLY

Bitcoin Blitzes the $30K Line (But Can It Hold?)
by Karl Montevirgen,
The StockCharts Insider
Bitcoin is something of a paradox. Its name suggests a single and unified "object" (a type of cryptocurrency), yet it's essentially an umbrella term mixing together several conflated and perhaps conflicting views. In other words, there's a lot of sentiment and speculation surrounding a...
READ MORE
MEMBERS ONLY

Sensitive Sectors are Holding the Keys to Unlock Upside Potential
by Julius de Kempenaer,
Senior Technical Analyst, StockCharts.com
The daily RRG for US sectors is showing an interesting picture. Out of all eleven sectors, only four are on a negative trajectory.
Industrials is inside the lagging quadrant at a very short tail, and more or less in a static position, which means that the sector is in a...
READ MORE
MEMBERS ONLY
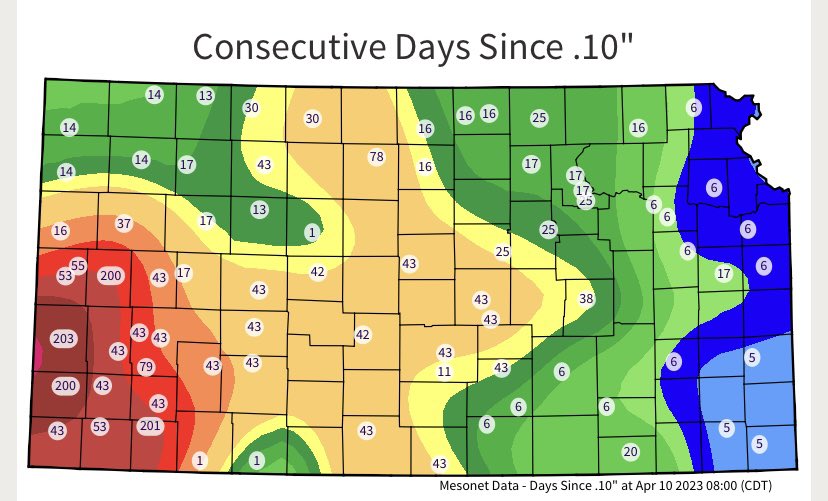
Drought in Key Regions for Major U.S. Crops
The chart shows how many days have passed since any significant rain in the major crop growing regions in the U.S.
Initial yield estimates for this year's U.S. winter wheat crop have been hammered by persistent drought. 12 Southwest Kansas counties dominate the area of drought....
READ MORE
MEMBERS ONLY

DP Trading Room: Equal-Weight RSP vs. SPY

by Erin Swenlin,
Vice President, DecisionPoint.com

by Carl Swenlin,
President and Founder, DecisionPoint.com
On this week's edition of The DecisionPoint Trading Room, Carl opens with a discussion of Regional Banks and gives us a link to a video that explains the safety of brokerage versus savings account insurance. He also covers why we use relative strength of the SPY v. the...
READ MORE
MEMBERS ONLY
The Halftime Show: Relative Strength Sell Signals

by Pete Carmasino,
Chief Market Strategist, Chaikin Analytics
In this week's edition of StockCharts TV'sHalftime, Pete shares some lists available to Chaikin Analytics subscribers and shows how the signals are reacting to current events in the market. He also shares some names that are giving relative strength sell signals, and how he's...
READ MORE
MEMBERS ONLY

Crude Oil Reaches an Interesting Juncture

by Bruce Fraser,
Industry-leading "Wyckoffian"
Wyckoff analysis of this essential commodity is currently revealing. The trend of Crude Oil has a major influence on not only most sectors of the stock market, but it is also a key cost input for the production of almost all goods, services, and other commodities. Since March of 2022,...
READ MORE
MEMBERS ONLY
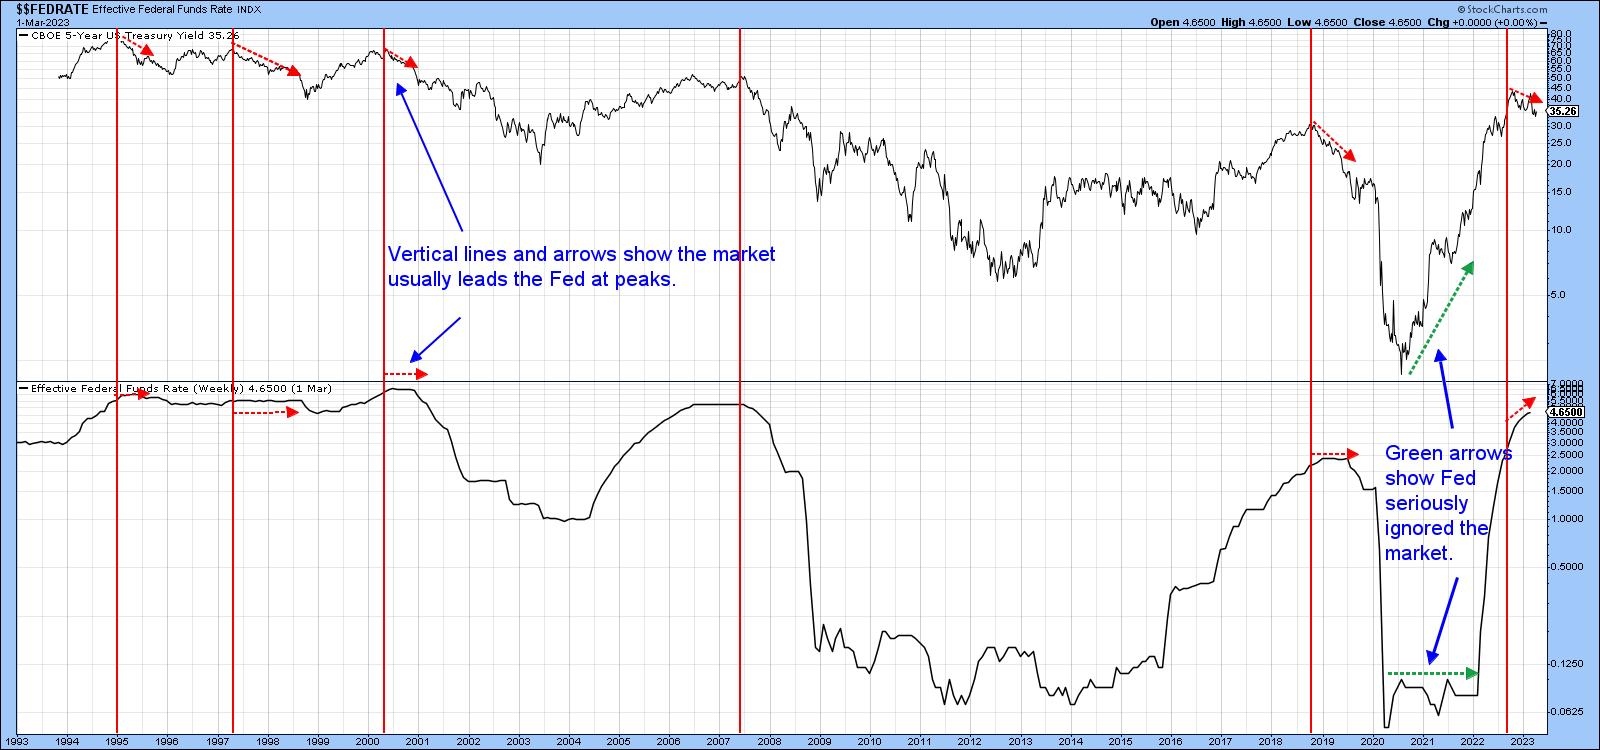
Mr. Powell, Tear Down These Interest Rates

by Martin Pring,
President, Pring Research
These are not my words, but those of Mr. Market, who is doing his best to let the central bank know that rates are too high. Chart 1, for instance, compares the market-driven 5-year yield to that of the Effective Federal Funds. The dashed green arrows indicate that, in 2021,...
READ MORE
MEMBERS ONLY

Patience Required As A Handle Forms

by Tom Bowley,
Chief Market Strategist, EarningsBeats.com
Cintas Corp (CTAS) is just 1 of 83 companies that have qualified to be on our most powerful ChartList, our Bullish Trifecta ChartList. In order to make it, it must be on our (1) Strong Earnings ChartList (SECL - tracks companies that beat quarterly revenue and EPS estimates), (2) Strong...
READ MORE
MEMBERS ONLY

Why Try To Call Tops And Bottoms? It's Easy!
by Tom Bowley,
Chief Market Strategist, EarningsBeats.com
Okay, first when I say "it's easy", I'm not saying it's easy to call tops and bottoms. Instead, I'm say that answering that rhetorical question is easy. If you can call a top, you can exit equities with your capital...
READ MORE
MEMBERS ONLY
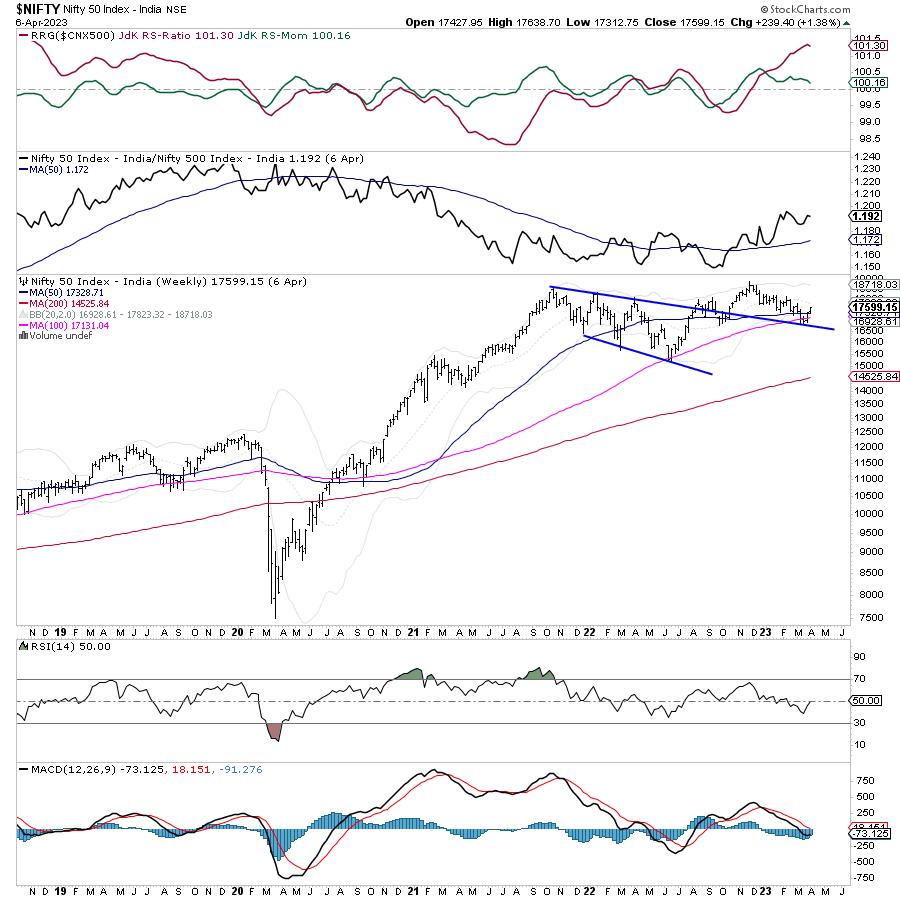
Week Ahead: NIFTY Remains Prone to Profit-Taking; Low Levels of VIX Warrants Caution at Current Levels

by Milan Vaishnav,
Founder and Technical Analyst, EquityResearch.asia and ChartWizard.ae
In a week that was shortened by Good Friday, the Indian equities extended their gains as they moved above crucial resistance points. The NIFTY had a strong and positive previous week, but had halted its up move near important resistance levels. Over the past four sessions, the index managed to...
READ MORE
MEMBERS ONLY
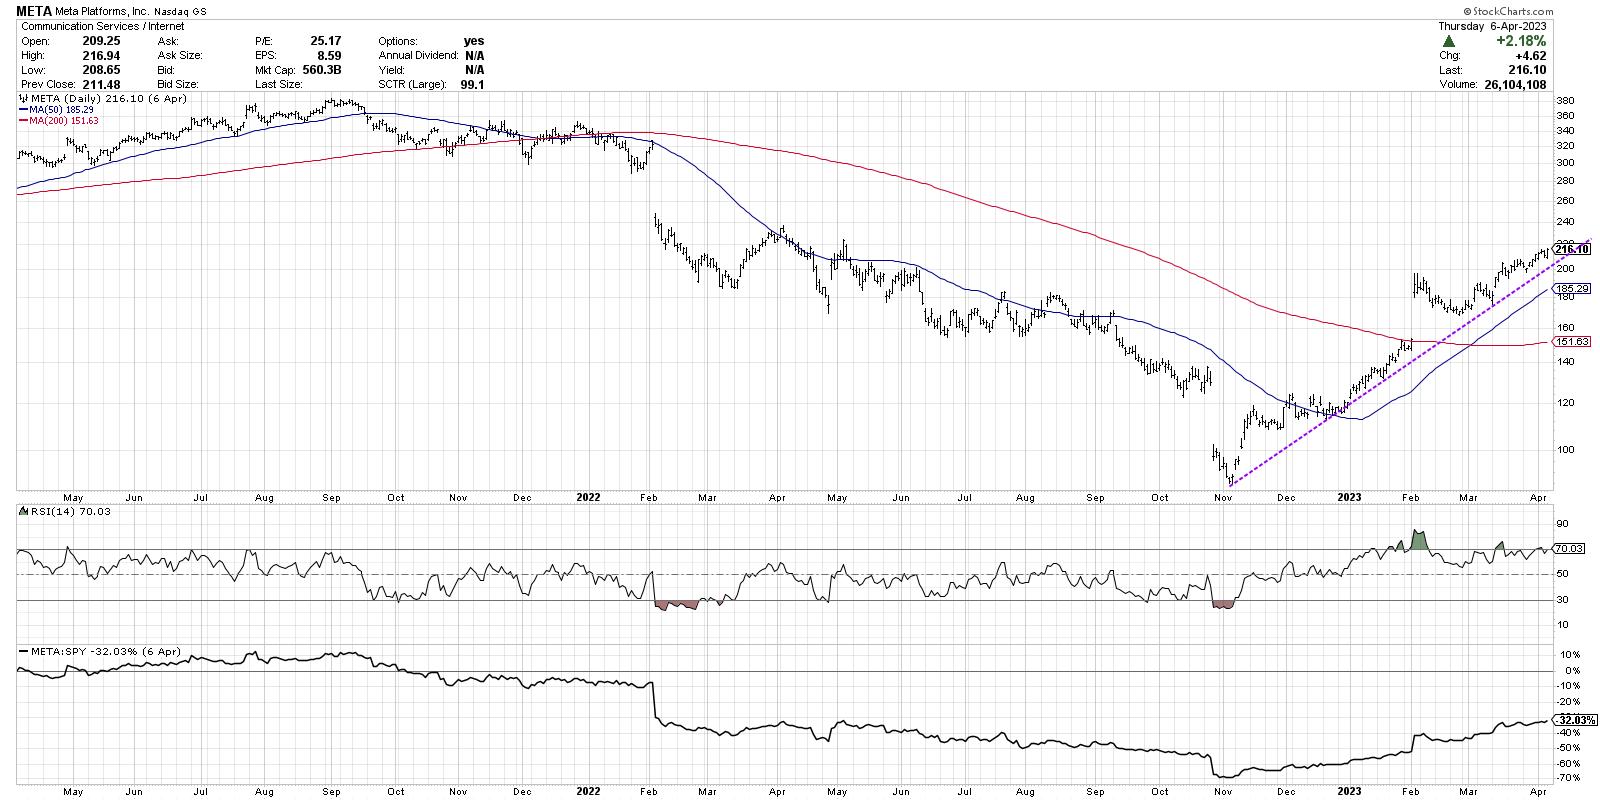
Key Levels for the FAANG Stocks

by David Keller,
President and Chief Strategist, Sierra Alpha Research
A number of my conversations this week on The Final Bardealt with the challenges presented by narrow leadership. Joe Rabil pointed out theweakness in small caps,and Jeff Huge focused on the difference between theYTD returns of FAANG stocksversus pretty much everything else.
Why is narrow leadership such a problem?...
READ MORE
MEMBERS ONLY
MEM TV: Recession Fears Drive Sector Rotation
by Mary Ellen McGonagle,
President, MEM Investment Research
In this episode of StockCharts TV'sThe MEM Edge, Mary Ellen reviews the impact of weak economic data on the markets as defensive areas outperformed and growth stocks took a break. She also details how to identify a downtrend reversal amid sector rotation.
This video was originally broadcast on...
READ MORE
MEMBERS ONLY
The Stock Market in 2023 is Like Picasso's Cubist Period
Pablo Picasso is known as the father of cubist painting. He and others used geometric shapes and patterns to represent a specific form. Cubism, in Picasso's mind, was created to emphasize the different ways of seeing the world around us. Picasso painted cubes and shapes using the concept...
READ MORE
MEMBERS ONLY

PG Stock: A Strong Defensive Investment Play
by Jayanthi Gopalakrishnan,
Director of Site Content, StockCharts.com
You invest in the stock market to make money, but you also want to preserve your capital. And in an investment environment dominated by uncertainty—regional bank fallout, inflation, rising interest rates, geopolitical tensions—investors are leaning towards implementing defensive strategies for their portfolios.
One of the defensive sectors that...
READ MORE
MEMBERS ONLY

Scanning Made Easy: A Beginner's Guide to Custom Scans

by Grayson Roze,
Chief Strategist, StockCharts.com
On this week's edition of StockCharts TV'sStockCharts in Focus, Grayson is back to walk you through the scanning tools on StockCharts and explain the basics of creating custom screens. He digs into one of his own custom checklist scans, breaking things down line by line to...
READ MORE
MEMBERS ONLY
How Big Moves Begin
by TG Watkins,
Director of Stocks, Simpler Trading
On this week's edition of Moxie Indicator Minutes, markets look poised to move higher, so TG takes a look at higher time frame charts to get a feel for how they begin. He then drills down to the Daily and Hourly to find out exactly how they moved....
READ MORE
MEMBERS ONLY

STOCKS END WEEK LITTLE CHANGED -- BUT MARKET BREADTH IS LAGGING BEHIND
by John Murphy,
Chief Technical Analyst, StockCharts.com
EQUAL WEIGHTED SPX LAGS BEHIND...Stocks were little changed on the shortened trading week and have maintained their intermediate uptrend. The black bars in Chart 1 show the S&P 500 having reached the highest level in two months. The SPX also remains above moving average lines and may...
READ MORE
MEMBERS ONLY

Waning Participation Within a Key Benchmark Could Spell Trouble
by Arthur Hill,
Chief Technical Strategist, TrendInvestorPro.com
Breadth is holding up for Nasdaq 100 ($NDX) stocks, but deteriorating for S&P 500 index ($SPX) stocks. I view this as a warning sign for the stock market. Breadth indicators measure the degree of participation. For example, the percentage of S&P 500 stocks above the 50-day...
READ MORE
MEMBERS ONLY

Riding the Sector Rotation Wave: How to Seize Surging Stocks
by Karl Montevirgen,
The StockCharts Insider
Getting a jump on a sector rotation is like accelerating into a blind curve. What could go wrong? Well, your timing may be way too early. Your sector selection of sectors may be off. You may be pre-empting a false signal. And so on.
The good news is that some...
READ MORE
MEMBERS ONLY
GNG TV: US Equities Offer Diversified Opportunities
by Alex Cole,
Co-founder, GoNoGo Charts®
by Tyler Wood,
Co-founder, GoNoGo Charts®
In this edition of the GoNoGo Charts show, Alex and Tyler deliver a view of relative and absolute trends across the investible landscape. The S&P 500 (SPY) confirms a "Go" trend on both daily and weekly timeframes, and Gold ($GLD) shows further upside as the "...
READ MORE
MEMBERS ONLY
Powerful RSI Setup to Use During Corrections
by Joe Rabil,
President, Rabil Stock Research
On this week's edition of Stock Talk with Joe Rabil, Joe explains how he uses the short-term RSI 5 to help with timing in a strong trend. He shows how this can be used in conjunction with the Relative Strength line when the market is going through a...
READ MORE
MEMBERS ONLY
US Stocks May Be Trending Higher: Check Out These Charts
by Alex Cole,
Co-founder, GoNoGo Charts®
by Tyler Wood,
Co-founder, GoNoGo Charts®
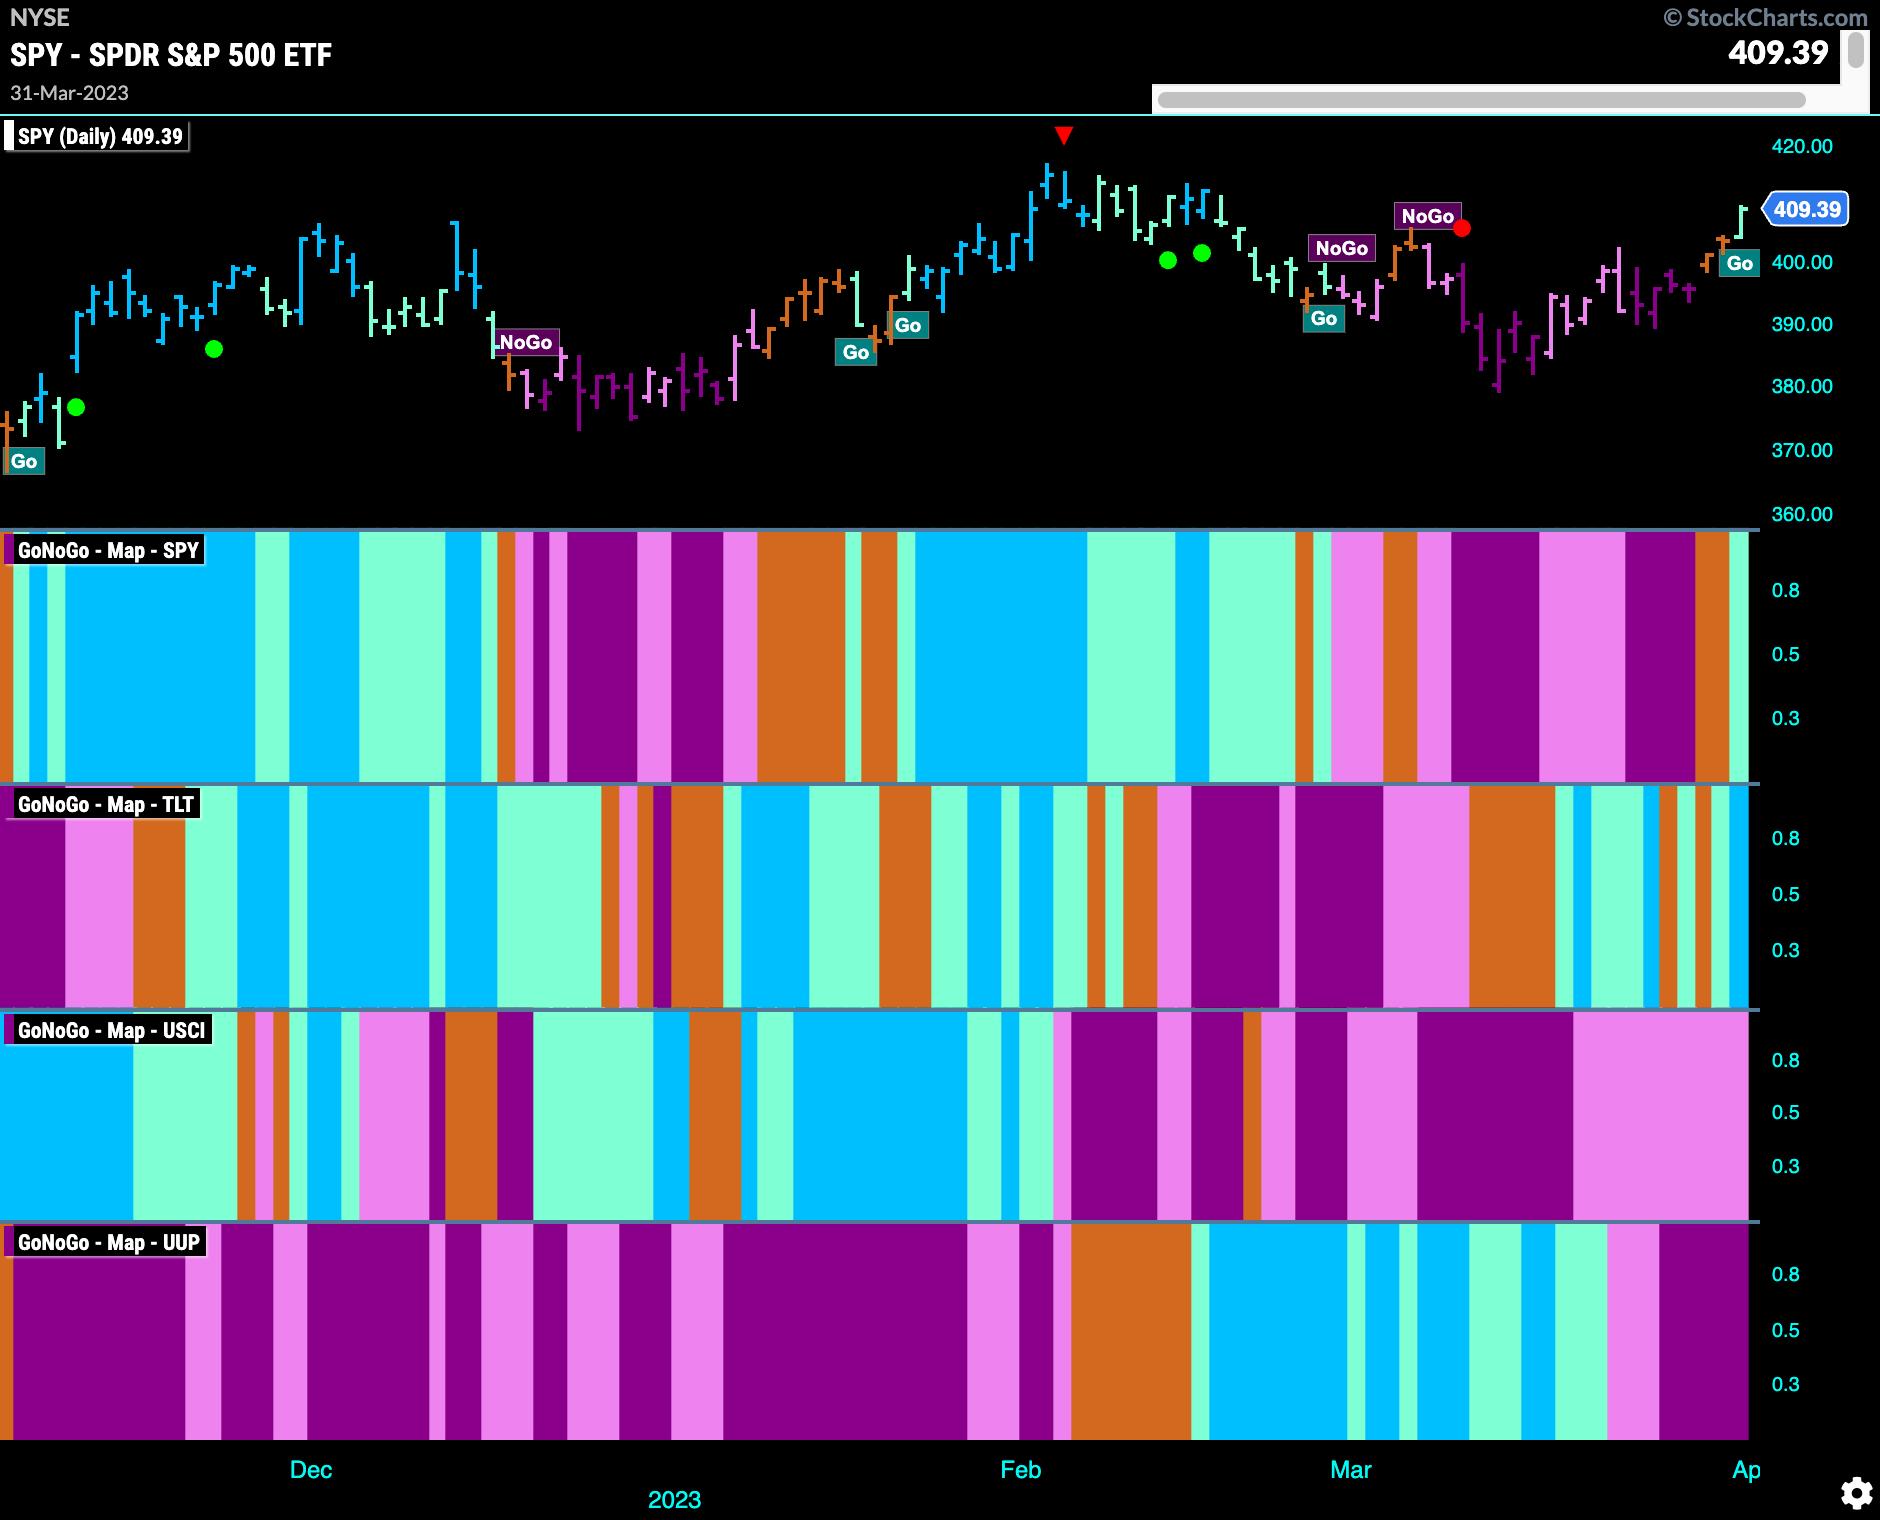
Welcome to this week's Flight Path.
Look at the GoNoGo Asset map below. Equities have turned! There's a "Go" bar at the end of the week that, as you'll see, also lines up with a new "Go" trend on the...
READ MORE
MEMBERS ONLY

Crude Oil: Obstacles Ahead of $100
by Karl Montevirgen,
The StockCharts Insider
The surprise OPEC+ production cuts last week had investors frantically positioning themselves in anticipation of the opportunities, risks, and opportunity risks surrounding crude oil exposure.
What Just Happened?
On Monday, OPEC+ announced it was reducing its output by 1.16 million barrels per day. The cuts are to begin in...
READ MORE
MEMBERS ONLY

Bonds, Eurodollar, Metals, Oil, and a Pick
In the last few Daily blogs, we have covered a lot, from the silver to gold ratio, to long bonds, to the Euro vs. the dollar. And that's not all!
We have looked at the 23-month moving average and how that has been an incredibly reliable indicator to...
READ MORE
MEMBERS ONLY

How to Find the Best Stocks to Trade: It's About Scans
by Jayanthi Gopalakrishnan,
Director of Site Content, StockCharts.com
April is Financial Literacy Month—a good excuse to bump up your financial knowledge so you can be better equipped to manage your personal finances. To support your financial journey, StockCharts is featuring several articles in April that focus on how you can take advantage of the educational tools that...
READ MORE
MEMBERS ONLY
The Wisdom of Livermore, Part 1
by Dave Landry,
Founder, Sentive Trading, LLC
Jesse Livermore is one of the most famous (and infamous) traders of all time. In his classic (written under a pen name) Reminiscences of a Stock Operator, he tells his story of how he became a successful trader. Livermore's focus on price and human nature made him a...
READ MORE
