MEMBERS ONLY
Mish's Daily: Lithium -- The Electrification of Transportation
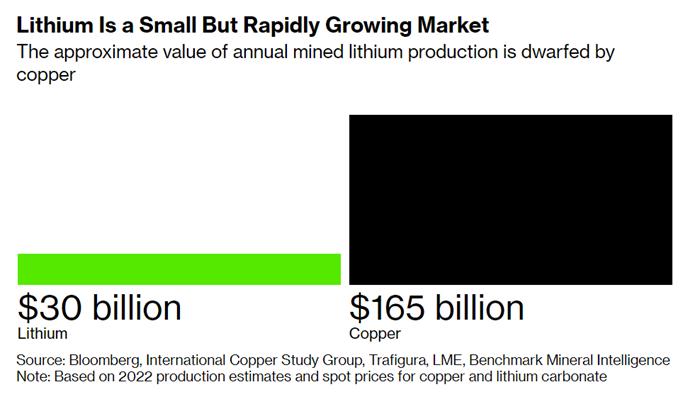
The race to secure lithium supplies is on.
While lithium demand multiplies, geopolitical concerns between China and the West have made securing a reliable supply of lithium more difficult. Lithium is becoming one of the world's most-sought commodities, yet the annual amount globally is still tiny. Battery makers...
READ MORE
MEMBERS ONLY

Dollar and Commodities Poised at Possible Inflection Points

by Martin Pring,
President, Pring Research
The Dollar Index has had a good run to the upside, but is starting to show some possible signs of fatigue. That potential weakness could take the form of an actual reversal in its primary uptrend, or an intermediate counter-correction. At the same time, commodities, which often (but certainly not...
READ MORE
MEMBERS ONLY

Sector Spotlight: Sector Rotation Model Shows the Way

by Julius de Kempenaer,
Senior Technical Analyst, StockCharts.com
On this episode of StockCharts TV's Sector Spotlight, I update the theoretical sector rotation model with my current observations of the ongoing rotation of sectors on the Relative Rotation Graph. For this, I use the equal-weight sector universe, as well as the charts of the four macro economic...
READ MORE
MEMBERS ONLY

The Usual Leaders Are Lagging

by Carl Swenlin,
President and Founder, DecisionPoint.com
As of today, five of the eight major indexes we track have IT Trend Model BUY signals. This is determined by the 20EMA being above the 50EMA (Silver Cross). This is a good start toward broad market recovery, but unfortunately, all eight indexes have LT Trend Model SELL signals, which...
READ MORE
MEMBERS ONLY

Another Risk OFF Signal
by Julius de Kempenaer,
Senior Technical Analyst, StockCharts.com
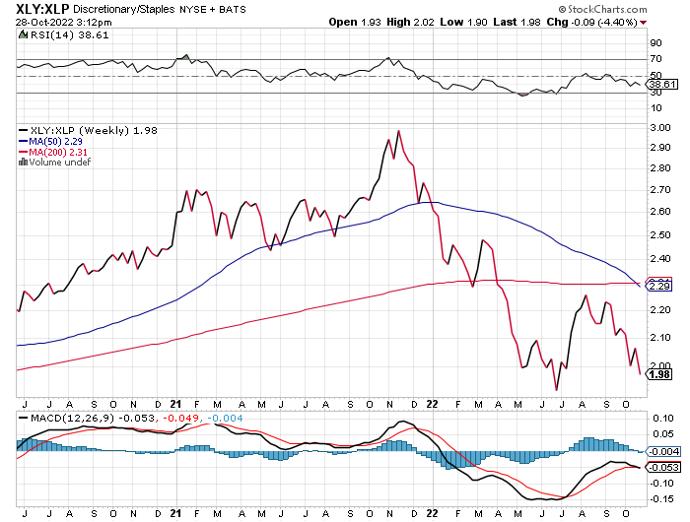
Discretionary vs Staples Rotation
While preparing for my show Sector Spotlight this week and trying to put things together in a meaningful fashion, I also remembered to look at the XLY:XLP ratio.
When you look at the positioning of the various sectors that are likely to outperform during the...
READ MORE
MEMBERS ONLY

Boeing Stock: Is It Ready for Takeoff?

by Jayanthi Gopalakrishnan,
Director of Site Content, StockCharts.com
Tech stocks, once the favorite among investors, seem to be losing some of their bling. Since the middle of earnings season, investors seem to be shifting towards the more non-glamorous materials and industrial stocks. Take a quick view of charts of the three broader indexes—Dow Jones Industrial Average ($INDU)...
READ MORE
MEMBERS ONLY

DP Trading Room: Market Still Holding Up

by Erin Swenlin,
Vice President, DecisionPoint.com
by Carl Swenlin,
President and Founder, DecisionPoint.com
On this week's edition of The DecisionPoint Trading Room, Carl gives us his perspective on why this bear market bottom is different than prior bear market rallies. What is keeping him bullish? He and Erin look talk about the VIX and the current fear factor (or lack thereof)...
READ MORE
MEMBERS ONLY

Midterm Election Results: Why Should the Stock Market Care?
Conventional wisdom is that the Democrats will retain the Senate and lose the House, but there's a chance the Republicans could easily sweep both chambers. With the midterm elections tomorrow, it's still too early to call the outcome of many of the races, and we may...
READ MORE
MEMBERS ONLY

Be Selective and Protect Yourself!

by Pete Carmasino,
Chief Market Strategist, Chaikin Analytics
On this week's edition of StockCharts TV'sHalftime, presented by Chaikin Analytics, Pete Carmasino is back with his take on the current bear market rally, including the volatility and some unusual breakouts in stocks. The message for today is to be selective in the stocks you focus...
READ MORE
MEMBERS ONLY

Copper Breaks With an Outsized Move

by Arthur Hill,
Chief Technical Strategist, TrendInvestorPro.com
The S&P 500 Index ($SPX) moved to a new low from June to October 2022, but copper held up better with a higher low and broke short-term resistance with an outsized move this week. A breakout with an outsized move shows above-average strength and it looks like the...
READ MORE
MEMBERS ONLY
Not All Boats Are Sinking With the Market's Tide: Check Out These Areas That Are Poised for Further Upside

by Mary Ellen McGonagle,
President, MEM Investment Research
It was a tough week for investors after Fed Chairman Jerome Powell put a halt to a two-week rally, which had been fueled by sharp gains in companies reporting Q3 earnings results ahead of lowered estimates. Going into this week, the S&P 500 Index ($SPX) had bullishly broken...
READ MORE
MEMBERS ONLY

Weekend Daily: Has "Dr. Copper" Signaled a New Round of Inflation?
As we await the midterm elections next week, there was massive speculation about China loosening COVID-19 restrictions.
Additionally, with a lack of global copper inventories, metals and miners erupted on Friday. Global X Copper Miners (COPX) found significant support twice at the 200-week moving average. COPX sold off at critical...
READ MORE
MEMBERS ONLY

MEM TV: Should You Buy the Pullback?
by Mary Ellen McGonagle,
President, MEM Investment Research
In this episode of StockCharts TV'sThe MEM Edge, Mary Ellen reviews earnings winners that pulled back and the best way to trade them. She also highlights pockets of strength that continue to emerge despite a down market as well as the primary drivers of market price action.
This...
READ MORE
MEMBERS ONLY

Unpacking the Jobs Report: Is the Labor Market Softening?
by Jayanthi Gopalakrishnan,
Director of Site Content, StockCharts.com
The Bureau of Labor Statistics released its October jobs report today. The number of jobs added was higher than the consensus forecasts.
Key Points of October Jobs Report
* Non-farm payrolls rose by 261,000 in October, higher than the 200,000 economists expected.
* Average hourly earnings were up 0.4%...
READ MORE
MEMBERS ONLY

The Pearls Of Wisdom I Took Away From ChartCon 2022: Part 1

by Gatis Roze,
Author, "Tensile Trading"
I'm going to share with you some of the gems and pearls of wisdom that I personally took away from the recent ChartCon 2022 Investor Conference. You may recall some of these nuggets. Others you won't because they occurred in belly-to-belly discussions behind the scenes.
Therein...
READ MORE
MEMBERS ONLY

SECTOR ROTATION MODEL REMAINS BEARISH

by John Murphy,
Chief Technical Analyst, StockCharts.com
SECTOR ROTATION MODEL .. One of the more useful ways to help determine the state of the stock market and the economy is to compare how various market sectors are performing. Certain market sectors do better at market tops, while others do better at market bottoms. Chart 1 shows the Stockcharts...
READ MORE
MEMBERS ONLY

The Fed Stays Hawkish

by TG Watkins,
Director of Stocks, Simpler Trading
On this week's edition of Moxie Indicator Minutes, TG discusses the FOMC on 11.02.22 and how Jerome Powell stayed on course and hawkish for the Q&A session. With the market unable to find any hope to cling to regarding a pivot of easing conditions,...
READ MORE
MEMBERS ONLY
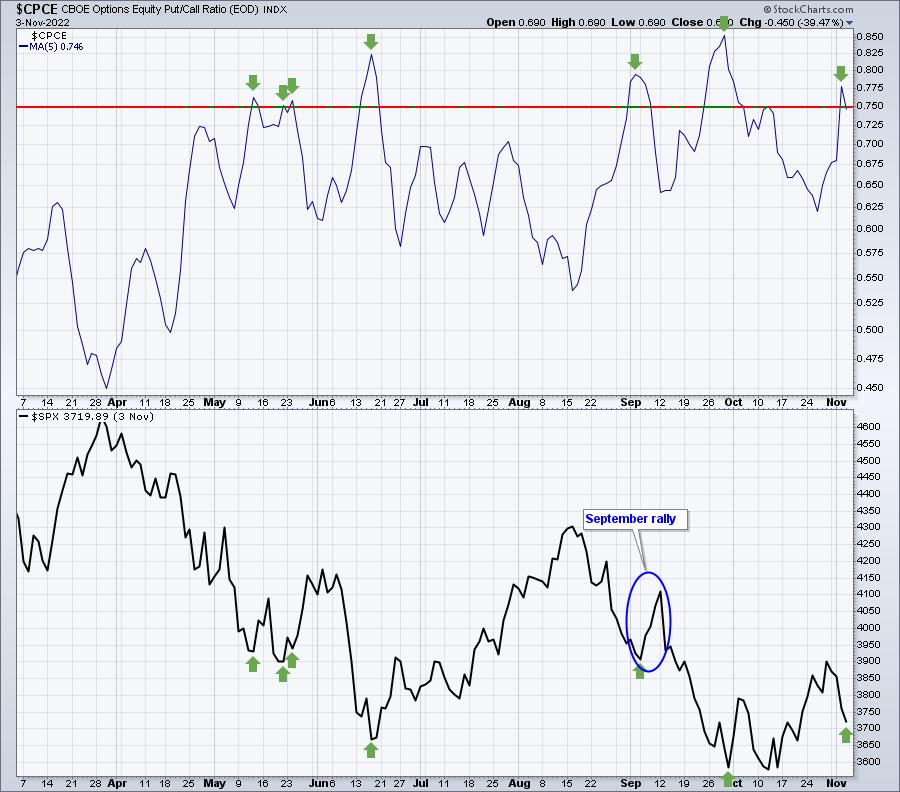
The VIX Is Screaming to GET IN NOW!

by Tom Bowley,
Chief Market Strategist, EarningsBeats.com
My two favorite sentiment indicators are (1) the 5-day moving average of the equity-only put-call ratio ($CPCE) and (2) the Volatility Index. On September 6th, I wrote about the elevated CPCE likely providing a short-term market bottom, and it did; the S&P 500 jumped 5% in a week....
READ MORE
MEMBERS ONLY

GILD: Could the Stock Return to its Glory Days?
by Jayanthi Gopalakrishnan,
Director of Site Content, StockCharts.com
Between 2012 and 2015, Gilead Sciences (GILD) enjoyed a nice rally. Since then, the stock has been through a rough patch. But its third-quarter 2022 earnings and revenue may be the spark the stock needed to bring it back to life.
GILD beat estimates when the company reported after the...
READ MORE
MEMBERS ONLY

GNG TV: Really? Another Relief Rally?

by Alex Cole,
Co-founder, GoNoGo Charts®
In this week's edition of the GoNoGo Charts show, Alex takes a look at the markets from a GoNoGo perspective. Using a top-down approach, he discusses the major asset classes and what we are seeing in terms of trend. Diving into macro drivers such as rates, the dollar...
READ MORE
MEMBERS ONLY

MACD Tactics to Improve Timing

by Joe Rabil,
President, Rabil Stock Research
On this week's edition of Stock Talk with Joe Rabil, Joe gives an explanation of how MACD works in multiple time frames and how this is a powerful tool to help improve timing. He shows how 2 timeframes can work together when using MACD and a simple moving...
READ MORE
MEMBERS ONLY

Fed Hikes Interest Rates, Hurts Consumers and Hits Granny Retail
The Fed has never raised the target interest rate four times in a row, with a 75 basis point each time – till today. They still need to beat inflation.
Today, they harmed retail stocks, hurt consumers, and decreased real estate values.
Granny Retail was gaining strength and displaying demonstrated Triple...
READ MORE
MEMBERS ONLY

Signs the Bear Market Rally May Be Over
by Martin Pring,
President, Pring Research
Last time I reviewed the stock market, many of the Indexes had just experienced a bullish outside bar (see chart for the DIA). Since several of the oscillators had reached oversold readings, the idea of a rally seemed appropriate. By the same token, its important to remember that there is...
READ MORE
MEMBERS ONLY

Fed Raises Rates: Stock and Bond Markets Fall on Uncertainty
by Jayanthi Gopalakrishnan,
Director of Site Content, StockCharts.com
The Fed may have raised interest rates by 75 basis points, but what's more important is the Fed's tone. Is it still hawkish, or did it shift to a more neutral stance?
A 75-basis point rate hike was already baked in, so today's decision...
READ MORE
MEMBERS ONLY

Super Simple System for Crypto

by Dave Landry,
Founder, Sentive Trading, LLC
On this week's edition of Trading Simplified, Dave talks about how his methodology involves being patient and doing your homework, even when conditions aren't fantastic and you're waiting for setups/entries. He then shows a simple system for Crypto and other markets using live...
READ MORE
MEMBERS ONLY

3 Things I'll Be Watching After Today's Fed Policy Statement
by Tom Bowley,
Chief Market Strategist, EarningsBeats.com
Like all of you, I'm just waiting. The Fed concludes its two-day meeting this afternoon and its latest policy decision will be released at 2pm ET. It's widely expected that the Fed will raise the fed funds rate by 75 basis points. Anything other than that...
READ MORE
MEMBERS ONLY

Look Who's Leading Now
Since the market's dramatic intraday reversal at the lows of the year on Oct. 13, the equity indexes have rallied in the face of headwinds from rising interest rates, lowered earnings expectations, big high-profile earnings misses, and the uncertainty of tomorrow's Fed announcement.
This may be...
READ MORE
MEMBERS ONLY
Sector Spotlight: Stocks Rally, But Monthly Trend Remains Down
by Julius de Kempenaer,
Senior Technical Analyst, StockCharts.com
It's the 150th episode of StockCharts TV's Sector Spotlight! This week, I tackle the long-term trends in asset classes and sectors, looking at the monthly Relative Rotation Graphs and the monthly price charts. Despite the recent rally in stocks and the strong recovery for most sectors...
READ MORE
MEMBERS ONLY

Markets are Shifting; Should Your Trading Strategy Shift Too?
Mish is at the Money Show, so I (Wade Dawson) am filling in for two days till she returns, and I already managed to miss her daily publishing deadline.
Sorry folks. I am posting this late or early now, but all of you are included, and all of you have...
READ MORE
MEMBERS ONLY

Strong Rotation to Value Stocks
by Julius de Kempenaer,
Senior Technical Analyst, StockCharts.com
Over the last 13 weeks, a notable shift from growth to value stocks has taken place. After a rotation from leading, through weakening, into lagging between April and mid-October, the tail for value stocks has re-entered the leading quadrant at a strong RRG-Heading.
Generally, value stocks are seen as more...
READ MORE
MEMBERS ONLY
DP Trading Room: Silver Cross Index Crossovers
by Erin Swenlin,
Vice President, DecisionPoint.com
by Carl Swenlin,
President and Founder, DecisionPoint.com
On this week's edition of The DecisionPoint Trading Room, Carl and Erin discuss their study of the Silver Cross Index (SCI) positive and negative crossovers and how they are helping determine not only bias, but possible entries/exits in the market as a whole. Carl covers the bullish...
READ MORE
MEMBERS ONLY

This Industry Group Is Churning Out Hugely Profitable Trades
by Tom Bowley,
Chief Market Strategist, EarningsBeats.com
If a huge recession is looming, someone forgot to tell the apparel retail group ($DJUSRA), because their absolute and relative strength is undeniable right now. The past three months have seen many stocks within this space SOAR. Here's the visual of the DJUSRA on both an absolute and...
READ MORE
MEMBERS ONLY

Week Ahead: NIFTY Likely To See A Buoyant Start; Moving Past Key Levels Likely

by Milan Vaishnav,
Founder and Technical Analyst, EquityResearch.asia and ChartWizard.ae
After spending nearly 10 weeks below the falling trend line pattern resistance and taking support at important levels, the NIFTY has finally attempted to break above this significant resistance pattern. In the short trading week interrupted by a holiday, the markets continued inching higher while keeping their head above the...
READ MORE
MEMBERS ONLY

The Most Important Stat That No One Is Talking About
by Tom Bowley,
Chief Market Strategist, EarningsBeats.com
Most of you are probably aware by now that I'm not a fan of CNBC, or any media for that matter. It's because their goals and objectives differ from mine. I want to educate. They want clicks, viewership, and ad revenue. Whatever it takes to achieve...
READ MORE
MEMBERS ONLY
MEM TV: How Much Higher Can We Go?
by Mary Ellen McGonagle,
President, MEM Investment Research
In this episode of StockCharts TV'sThe MEM Edge, Mary Ellen reviews the primary drivers of this week's rally, as well as which sectors have moved into an uptrend. She then shares the next area of possible upside resistance.
This video was originally broadcast on October 28,...
READ MORE
MEMBERS ONLY

Portfolio Tracking Made Easy with Automatic Alerts & Reports

by Grayson Roze,
Chief Strategist, StockCharts.com
On this week's edition of StockCharts TV'sStockCharts in Focus, Grayson shares how to automate some of your portfolio tracking routines. Starting from scratch, he'll walk you through creating a sample portfolio using a ChartList, then show you how to set that portfolio up with...
READ MORE
MEMBERS ONLY
Weekend Daily: Can Investors Trust This Rally?
GDP data painted a somewhat roseate picture for the US economy this week. Yet inflation is still rising.
The PCE price index climbed by 0.3% in a month and was up 6.2% from the prior year. Still very far from the Fed's 2% inflation target. Consumer...
READ MORE
MEMBERS ONLY

The Perfect Chart for Navigating 2022

by David Keller,
President and Chief Strategist, Sierra Alpha Research
Bruce Fraser joined me on The Final Bar this week and shared a thought-provoking point & figure chart of the S&P 500 index. With the recent upswing, you can use a horizontal count to identify potential upside targets for the bear market rally. (Yes, I am still labeling...
READ MORE
MEMBERS ONLY

DOW TESTS 200-DAY LINE TO LEAD MARKET HIGHER -- HEALTHCARE SPDR MAY BE BOTTOMING -- BIOTECHS LOOK STRONG
by John Murphy,
Chief Technical Analyst, StockCharts.com
DOW TESTS 200-DAY LINE... October has turned to be a strong month for the market, and industrials in particular. Chart 1 shows the Dow Industrials reaching a two month high and trying to close above its 200-day moving average. The Dow has gained more than 5% for the week and...
READ MORE
MEMBERS ONLY
Big-Cap Tech Gets Taken Down
by TG Watkins,
Director of Stocks, Simpler Trading
On this week's edition of Moxie Indicator Minutes, TG discusses how nearly every big cap tech name got crushed on earnings this week which has weighed heavily on the QQQ. However, the IWM and DIA have done quite well with SPY in the middle. Will the market be...
READ MORE
