MEMBERS ONLY

RRG Update: Is Tech Ready to Break Out?

by Julius de Kempenaer,
Senior Technical Analyst, StockCharts.com
This week, Julius shows how the Technology sector is edging toward leadership, alongside Industrials and soon-to-follow Communication Services. He highlights breakout lines for SPY, XLK, and XLC, noting that conviction climbs when daily and weekly RRG tails align to point northeast together. Bitcoin is sprinting into the leading quadrant next...
READ MORE
MEMBERS ONLY
S&P 500 Bullish Patterns: Are Higher Highs Ahead?

by Frank Cappelleri,
Founder & President, CappThesis, LLC
In this market update, Frank breaks down recent developments across the S&P 500, crypto markets, commodities, and international ETFs. He analyzes bullish and bearish chart patterns, identifies key RSI signals, and demonstrates how "Go No Go Charts" can support your technical analysis. You'll also...
READ MORE
MEMBERS ONLY

Top Sectors to Watch + The 18 SMA Setup Every Trader Should Know

by Joe Rabil,
President, Rabil Stock Research
In this video, Joe analyzes which sectors to focus on when selecting new stocks. He demonstrates how to use the 18-period simple moving average (SMA) on monthly, weekly, and daily charts to identify the strongest stock patterns and the best timeframes to trade. He then provides chart analysis on the...
READ MORE
MEMBERS ONLY

S&P 500 Slide Explained: What Past Price Action Reveals About Market Dips
by Frank Cappelleri,
Founder & President, CappThesis, LLC
On Wednesday, only 4% of the S&P 500's holdings logged gains — a pretty rare occurrence. Since the start of 2024, this has only happened three other times:
* August 5, 2024: The last day of the summer correction
* December 18, 2024: The Fed's hawkish cut...
READ MORE
MEMBERS ONLY
S&P 500, Bitcoin & XLK: What the Charts Are Saying Now
by Frank Cappelleri,
Founder & President, CappThesis, LLC
In this video, Frank dives into some of his favorite features on StockCharts.com. He then dissects the S&P 500 and Bitcoin price action, before exploring the the XLK Technology ETF's explosive move off the lows. He also highlights a few recent trade ideas and setups...
READ MORE
MEMBERS ONLY
Where the Market Goes Next: Key Resistance Levels + Top Bullish Stocks to Watch Now

by Mary Ellen McGonagle,
President, MEM Investment Research
Want to know where the stock market is headed next? In this week's market update, Mary Ellen McGonagle analyzes key resistance levels and reveals what's fueling the current uptrend. She highlights top bullish setups among U.S. leadership stocks, plus global names showing strength.
This video...
READ MORE
MEMBERS ONLY
Fed Watch: Key Bullish Patterns in the S&P 500, Utilities, and Crypto
by Frank Cappelleri,
Founder & President, CappThesis, LLC
KEY TAKEAWAYS
* Bullish chart patterns, such as the inverse head-and-shoulders and cup with handle, are in play in the S&P 500.
* Utilities are breaking to new 50-day highs.
* Bitcoin and Ethereum continue to signal rising risk appetite.
The S&P 500 ($SPX) wrapped up Tuesday just below...
READ MORE
MEMBERS ONLY
Hidden Gems: Bullish Patterns Emerging in These Country ETFs
by Joe Rabil,
President, Rabil Stock Research
In this video, Joe highlights key technical setups in select country ETFs that are showing strength right now. He analyzes monthly and weekly MACD, ADX, and RSI trends that are signaling momentum shifts. Joe also reviews the critical level to watch on the S&P 500 (SPX), while breaking...
READ MORE
MEMBERS ONLY

Equities? Fuhgeddaboudit! Alternative Assets are Leading

by Arthur Hill,
Chief Technical Strategist, TrendInvestorPro.com
KEY TAKEAWAYS
* A simple ranking shows leadership in alterative assets and commodities.
* Stocks are not the place to be because the vast majority are below their 200-day SMAs.
* Bitcoin is holding up relatively well as it sets up with a classic corrective pattern.
Trading is all about the odds. Trade...
READ MORE
MEMBERS ONLY

Bitcoin Holds Up, but Remains Short of Relative Breakout
by Arthur Hill,
Chief Technical Strategist, TrendInvestorPro.com
KEY TAKEAWAYS
* Traders may consider alternatives, such as Bitcoin, in bear markets.
* Bitcoin and SPY are positively correlated long-term, but one period stands out.
* Even though Bitcoin shows short-term relative strength, it is short of a relative breakout.
Stocks are in a freefall with selling pressure spreading into industrial metals...
READ MORE
MEMBERS ONLY

Bitcoin Faces Important Technical Test

by Martin Pring,
President, Pring Research
Over the weekend, Donald Trump declared the creation of a U.S. strategic crypto reserve, which will include Bitcoin and four other cryptocurrencies. The price immediately responded with a substantial rally over the weekend, but, by the close of business on Monday, had given up all of those gains. That...
READ MORE
MEMBERS ONLY

Growth Stocks Tumbling; Where to Find Safe Havens Now!
by Mary Ellen McGonagle,
President, MEM Investment Research
Growth stocks just took a sharp hit—what does it mean for the market? In this video, Mary Ellen breaks down the impact, reveals why NVDA could soar higher, and highlights safer stocks with strong upside potential!
This video originally premiered February 28, 2025. You can watch it on our...
READ MORE
MEMBERS ONLY
Hidden MACD SIGNAL? Key Trade Signals Explained!
by Joe Rabil,
President, Rabil Stock Research
In this exclusive StockCharts video, Joe breaks down reverse divergences (hidden divergence), key upside & downside signals, and how to use ADX and Moving Averages for better trades! Plus, he examines market trends and viewer symbol requests!
This video was originally published on February 26, 2025. Click this link to...
READ MORE
MEMBERS ONLY
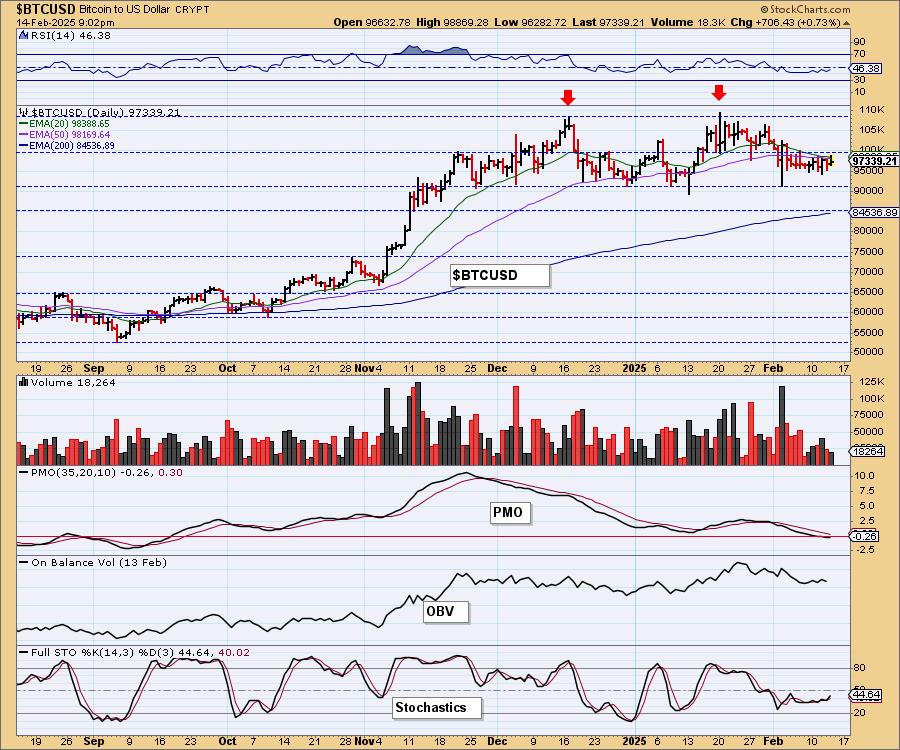
Double Tops In Bitcoin and the Dollar

by Erin Swenlin,
Vice President, DecisionPoint.com
As part of the DP Alert, we cover Bitcoin and the Dollar every market day. We have been watching some bearish indications on both Bitcoin and the Dollar with the double top chart patterns.
On Bitcoin, price has been moving mostly sideways above support at 90,000. This happens to...
READ MORE
MEMBERS ONLY

Quantum Computing Stocks You NEED to See
by Joe Rabil,
President, Rabil Stock Research
In this exclusive StockCharts video, Joe shares the details of his favorite MACD setup. Joe then covers NVDA, and cryptocurrencies, before covering which Quantum Computing stocks look the best right now, including IONQ and RGTI. Finally, he goes through the symbol requests that came through this week, including AAPL, COIN,...
READ MORE
MEMBERS ONLY

Bullish AND Bearish Options Trade Ideas

by Tony Zhang,
Chief Strategist, OptionsPlay
In this video, Tony starts the week with a very different tone as he looks at how markets are currently playing out. He then shares individual trade ideas, pointing out which ones they continue to have a bullish or bearish outlooks on. He looks at some key stocks including META,...
READ MORE
MEMBERS ONLY
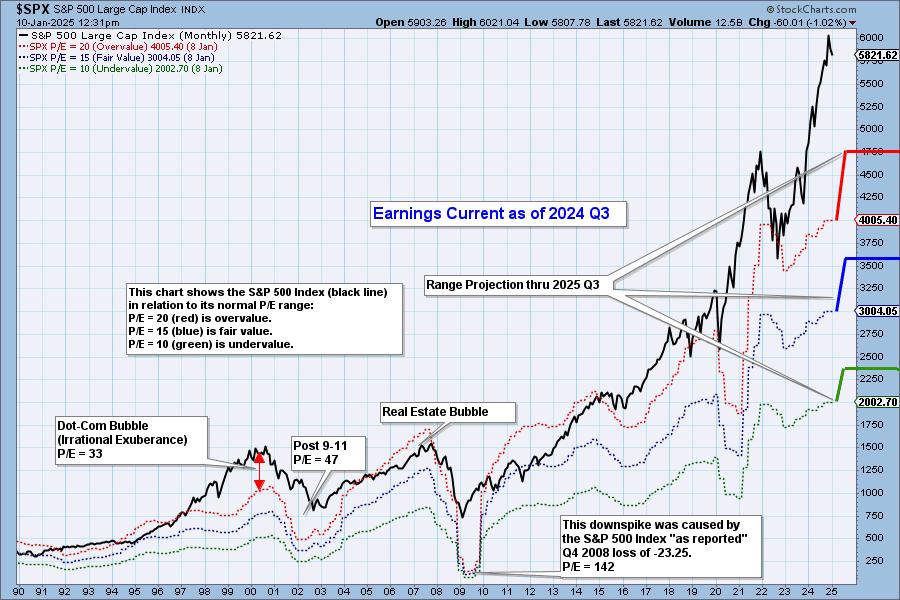
S&P 500 Earnings 2024 Q3: Still Overvalued

by Carl Swenlin,
President and Founder, DecisionPoint.com
S&P 500 earnings are in for 2024 Q3, and here is our valuation analysis.
The following chart shows the normal value range of the S&P 500 Index, indicating where the S&P 500 would have to be in order to have an overvalued P/E...
READ MORE
MEMBERS ONLY
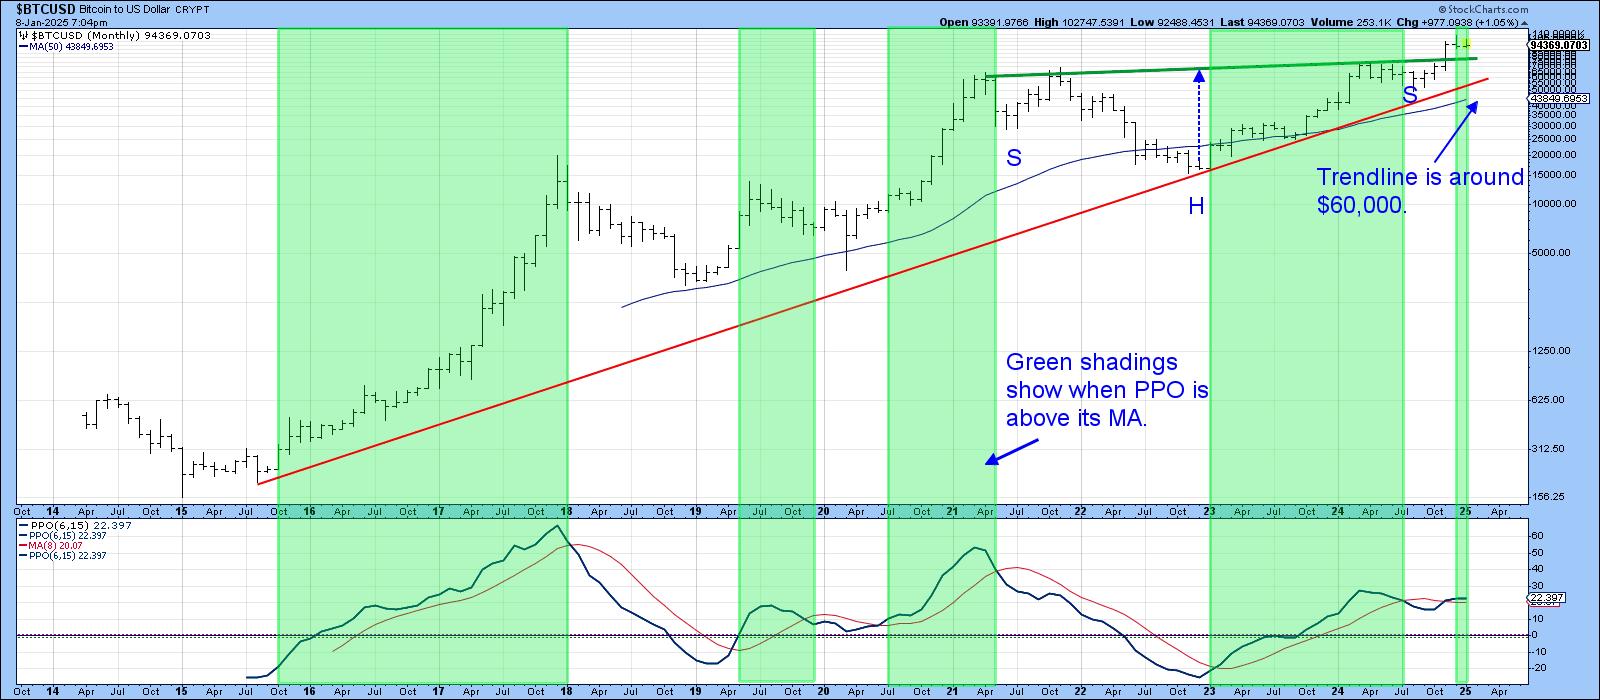
Is The First Domino About to Fall for the Bitcoin Bull Market?
by Martin Pring,
President, Pring Research
The Long-Term Picture
No market goes up forever and, at some point, Bitcoin will top out. It's currently down about 12% from its peak, set on December 17 less than 4 weeks ago, so there is scant evidence at this point indicating a primary bear market. For example,...
READ MORE
MEMBERS ONLY

These Riskier Areas Start the New Year RALLY!
by Mary Ellen McGonagle,
President, MEM Investment Research
In this video, Mary Ellen analyzes the divergence between the S&P 500 and the Nasdaq while highlighting some of the areas driving Growth stocks. She also talks about the continuation rally in Energy and Utility stocks and shares which stocks are driving these areas higher.
This video originally...
READ MORE
MEMBERS ONLY
Is This ADX Pattern a Warning Sign for Investors?
by Joe Rabil,
President, Rabil Stock Research
In this exclusive StockCharts video, Joe shares a specific ADX pattern that's signaling potential exhaustion in the momentum right now. Joe analyzes three other market periods that displayed this pattern and the resulting correction which followed. He then discusses some of the most attractive looking cryptos, as well...
READ MORE
MEMBERS ONLY
The Trump Trade? Not All as MAGA as You Might Think
by Martin Pring,
President, Pring Research
The "Trump Trade" refers to the market reaction and investment strategies that emerged following Donald Trump's election victories and his economic policies. It describes the shift in market sentiment driven by anticipated pro-business policies, tax cuts, and deregulation under his administration.
Investors initially rushed into sectors...
READ MORE
MEMBERS ONLY

Stock Market Sell-Off: Is the Bull Market Over?

by Jayanthi Gopalakrishnan,
Director of Site Content, StockCharts.com
KEY TAKEAWAYS
* Broader stock market indexes got a bearish jolt on Wednesday.
* Gold, silver, and cryptocurrencies joined the equity selloff.
* Treasury yields and the US dollar jump higher.
Uncertainty in the stock market makes it difficult to make investment decisions. When investors sell off stocks, everyone follows without giving it...
READ MORE
MEMBERS ONLY
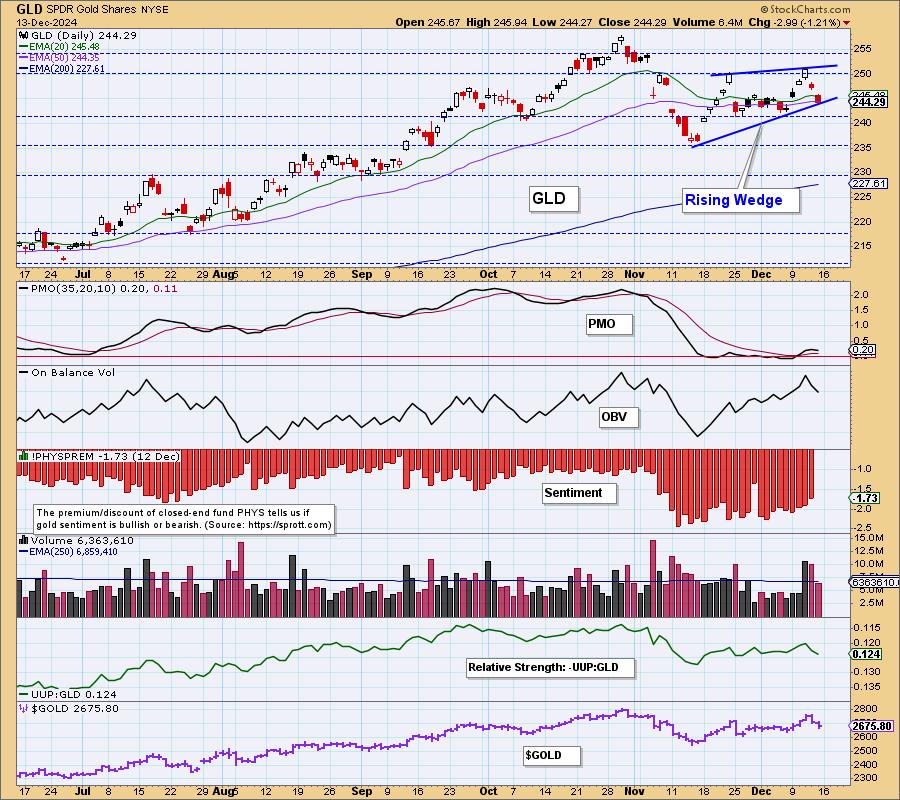
Bearish Formation Threatens Gold's Advance
by Carl Swenlin,
President and Founder, DecisionPoint.com
After the November pullback, GLD began to rally again. This week, on Wednesday, price exceeded the nearest November top, which made official the new rising trend from the November low. Brief celebration ends the following day as GLD tops, setting the top boundary for a bearish rising wedge formation. Rising...
READ MORE
MEMBERS ONLY
The Stock Market's Simmering Rally: Indexes Keep Setting New Highs
by Jayanthi Gopalakrishnan,
Director of Site Content, StockCharts.com
KEY TAKEAWAYS
* The broader stock market indexes continue to notch new record highs.
* Risk appetite is strong as Bitcoin rises while Treasury yields and volatility retreat.
* Earnings from Oracle, Adobe, Broadcom, and Costco may move the stock market next week.
The first trading week in December started on a positive...
READ MORE
MEMBERS ONLY

Market Movements Today: Investors Rejoice as Stocks Rally, Bitcoin and Gold Backslide
by Jayanthi Gopalakrishnan,
Director of Site Content, StockCharts.com
KEY TAKEAWAYS
* Stocks and bond prices rallied on Monday in response to President-elect Trump's pick for Treasury Secretary.
* Gold and oil prices fell steeply as concerns of geopolitical risks ease.
* Small and mid-cap stocks were the leaders in today's equity rally.
It's a short...
READ MORE
MEMBERS ONLY

An All-Around Rally: Navigating Stocks, US Dollar, Gold, and Bitcoin Price Action
by Jayanthi Gopalakrishnan,
Director of Site Content, StockCharts.com
KEY TAKEAWAYS
* Broader equity indexes ended the week on a positive note, with small- and mid-caps gaining momentum.
* Gold regained its bullish momentum, and the US dollar surged.
* Bitcoin skyrocketed and crossed the 10K level, but closed lower.
The last full trading week before the Thanksgiving holiday has ended on...
READ MORE
MEMBERS ONLY
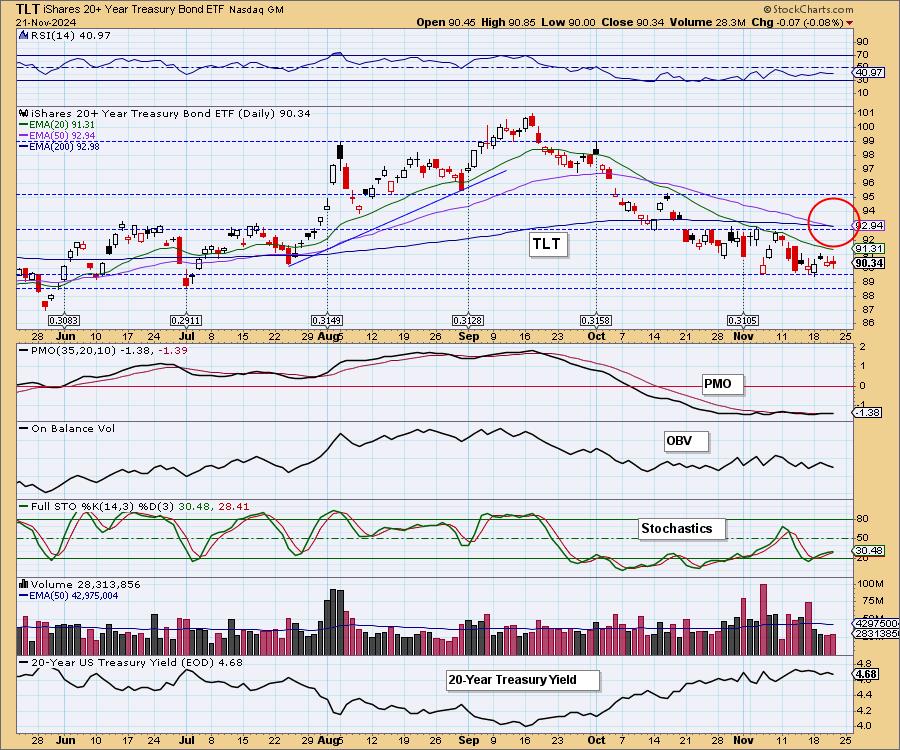
Bonds Get Death Cross SELL Signal
by Carl Swenlin,
President and Founder, DecisionPoint.com
Today, the 20-Year Bond ETF (TLT) 50-day EMA crossed down through the 200-day EMA (Death Cross), generating an LT Trend Model SELL Signal. This was the result of a downtrend lasting over two months. We note that the PMO has been running flat below the zero line for a month,...
READ MORE
MEMBERS ONLY
Don't Miss These Breakouts Poised to Trade Higher!
by Mary Ellen McGonagle,
President, MEM Investment Research
In this StockCharts TV video, Mary Ellen reveals what took place last week and how the markets closed. She also revealed what drove price action, and what to be on the lookout for next week. In addition, she shares several stocks that broke out of powerful bases on bullish news....
READ MORE
MEMBERS ONLY

Riding the Cryptocurrency Wave: How to Maximize Your Gains

by Karl Montevirgen,
The StockCharts Insider
KEY TAKEAWAYS
* With a new administration set to take office in January, it may be time to seriously reconsider cryptocurrencies.
* Three cryptocurrencies to keep an eye on are Bitcoin, Ethereum, and (strangely) Dogecoin.
* Despite cryptocurrencies being a noisy market, the right tools can help guide you toward smarter decisions.
With...
READ MORE
MEMBERS ONLY

Are Extremely Overbought Conditions Good or Bad for Stocks?

by David Keller,
President and Chief Strategist, Sierra Alpha Research
When a stock shows an RSI value above 80, is that a good thing or a bad thing? In this video, Dave reviews a series of examples showing this "extreme overbought" condition, highlights how these signals usually occur not at the end of, but often earlier in an...
READ MORE
MEMBERS ONLY

It's GAME ON for These Stocks
by Joe Rabil,
President, Rabil Stock Research
In this exclusive StockCharts video, Joe shows a specific trade setup in multiple timeframes that identifies the start of an important trend. He explains the 4 keys to this setup and shows 5 examples of stocks meeting the criteria right now. Joe then covers numerous indices, commodities, 10-year Rates, and...
READ MORE
MEMBERS ONLY

A Strong Week: Stocks, Gold, and Crypto's Robust Performance
by Jayanthi Gopalakrishnan,
Director of Site Content, StockCharts.com
KEY TAKEAWAYS
* The S&P 500 and Dow Jones Industrial Average closed at record highs.
* Gold prices are on fire, closing at a record high.
* Bitcoin breaks out of a consolidation pattern.
Despite a light economic data week, the stock market continued its rally, with the S&P...
READ MORE
MEMBERS ONLY
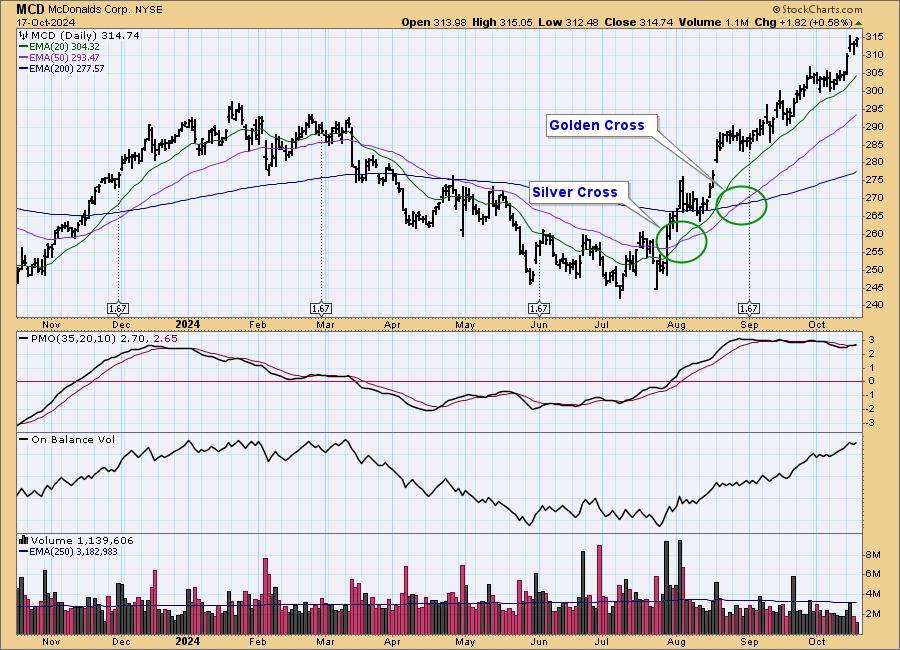
Signal Scoreboard As Good As It Gets
by Carl Swenlin,
President and Founder, DecisionPoint.com
At DecisionPoint, we track intermediate-term and long-term BUY/SELL signals on twenty-six market, sector, and industry group indexes. The long-term BUY signals are based upon the famous Golden Cross, which is when the 50-day moving average crosses up through the 200-day moving average. (We use exponential moving averages -- EMAs....
READ MORE
MEMBERS ONLY

Why the MACD Crossover Signal is SO Important
by Joe Rabil,
President, Rabil Stock Research
In this exclusive StockCharts TV video, Joe shares the MACD downside crossover signal and explains the different ways it can play out when it takes place above the MACD zero line. These downside crossovers can lead to opportunities depending on other criteria, including the ADX action. He then shows how...
READ MORE
MEMBERS ONLY

With 2024 Q2 Earnings In, Market Remains Very Overvalued
by Carl Swenlin,
President and Founder, DecisionPoint.com
S&P 500 earnings are in for 2024 Q2, and here is our valuation analysis.
The following chart shows the normal value range of the S&P 500 Index, indicating where the S&P 500 would have to be in order to have an overvalued P/E...
READ MORE
MEMBERS ONLY

How to Use the ADX Indicator (Trend Strength Explained)
by Joe Rabil,
President, Rabil Stock Research
In this exclusive StockCharts TV video, Joe presents an introduction to the Average Directional Index (ADX), sharing how it is calculated and how to use it. He highlights some of the strengths, and weaknesses, of this powerful indicator. He then analyzes Bitcoin, NVDA, and AVGO, and finishes up the show...
READ MORE
MEMBERS ONLY

The Fed Cut Discount Rate | Larry's "Family Gathering" September 19, 2024 Recording

by Larry Williams,
Veteran Investor and Author
Interest rates have been cut -- what now? Larry presents his thoughts in this edition of the Family Gathering video.
In this month's Family Gathering video, Larry begins with what he calls the "Fed Cut Discount Rate" and what it means. What does history make of...
READ MORE
MEMBERS ONLY

Why Stock Outperformance Might be ENDING!
by Julius de Kempenaer,
Senior Technical Analyst, StockCharts.com
In this video from StockCharts TV,Julius takes a look at rotations in an asset allocation RRG. He compares fixed-income-related asset classes, commodities, the US dollar, Bitcoin and stocks to a balanced portfolio of 60% stocks/40% bonds. The long-lasting outperformance of stocks seems to be coming to an end....
READ MORE
MEMBERS ONLY
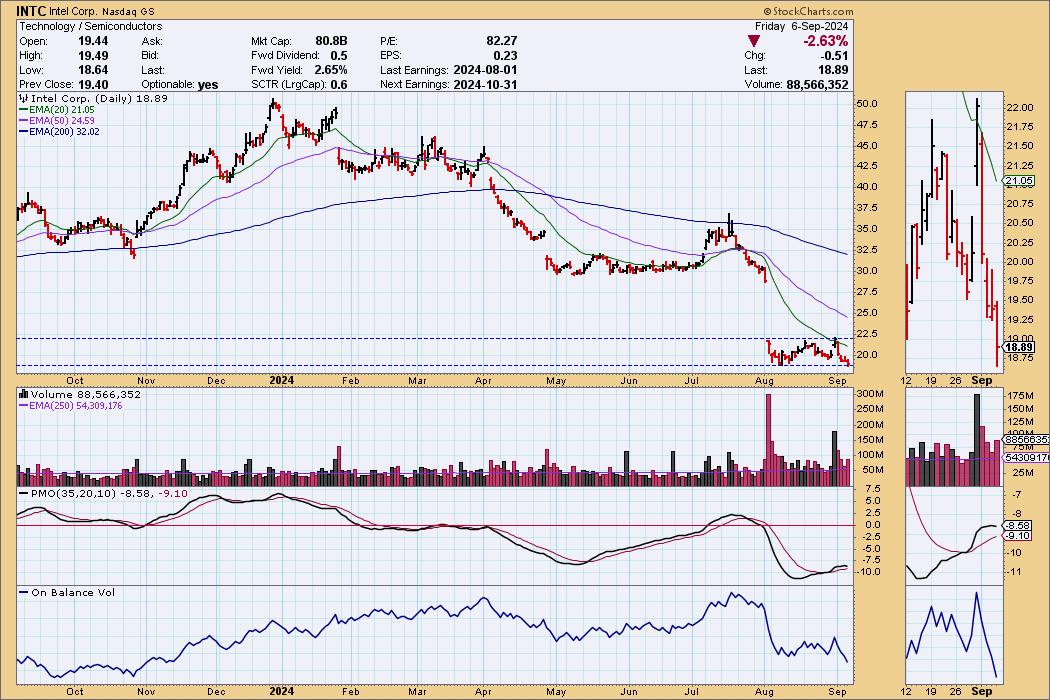
Is It Time to Buy Intel?
by Carl Swenlin,
President and Founder, DecisionPoint.com
I've been around long enough to remember when Intel (INTC) was the NVIDIA of the day. Now, INTC is under severe pressure, having suspended its dividend, and is currently being considered for removal from the Dow 30 Industrial Average. Oh, how the mighty have fallen!
With INTC having...
READ MORE
MEMBERS ONLY
The Best Reversal Patterns (Trading Strategy Explained)
by Joe Rabil,
President, Rabil Stock Research
In this exclusive StockCharts TV video, Joe shares how he identifies and trades a reversal pattern. Highlighting what causes him to focus in on a stock, he shares the 1-2-3 reversal pattern, along with the keys in MACD and ADX that allow you to improve the risk/reward equation in...
READ MORE