MEMBERS ONLY
Navigating Uncertain Times: Market Recap with Mish Schneider
In this special edition of StockCharts TV'sThe Final Bar, Mish Schneider, Chief Strategist at MarketGauge, takes over for Dave Keller to share her thoughts on the daily Market Recap during a day of uncertain news.
This video originally premiered on October 9, 2023. Watch on our dedicated Final...
READ MORE
MEMBERS ONLY
What We Will Use to Ascertain the Market's Next Moves
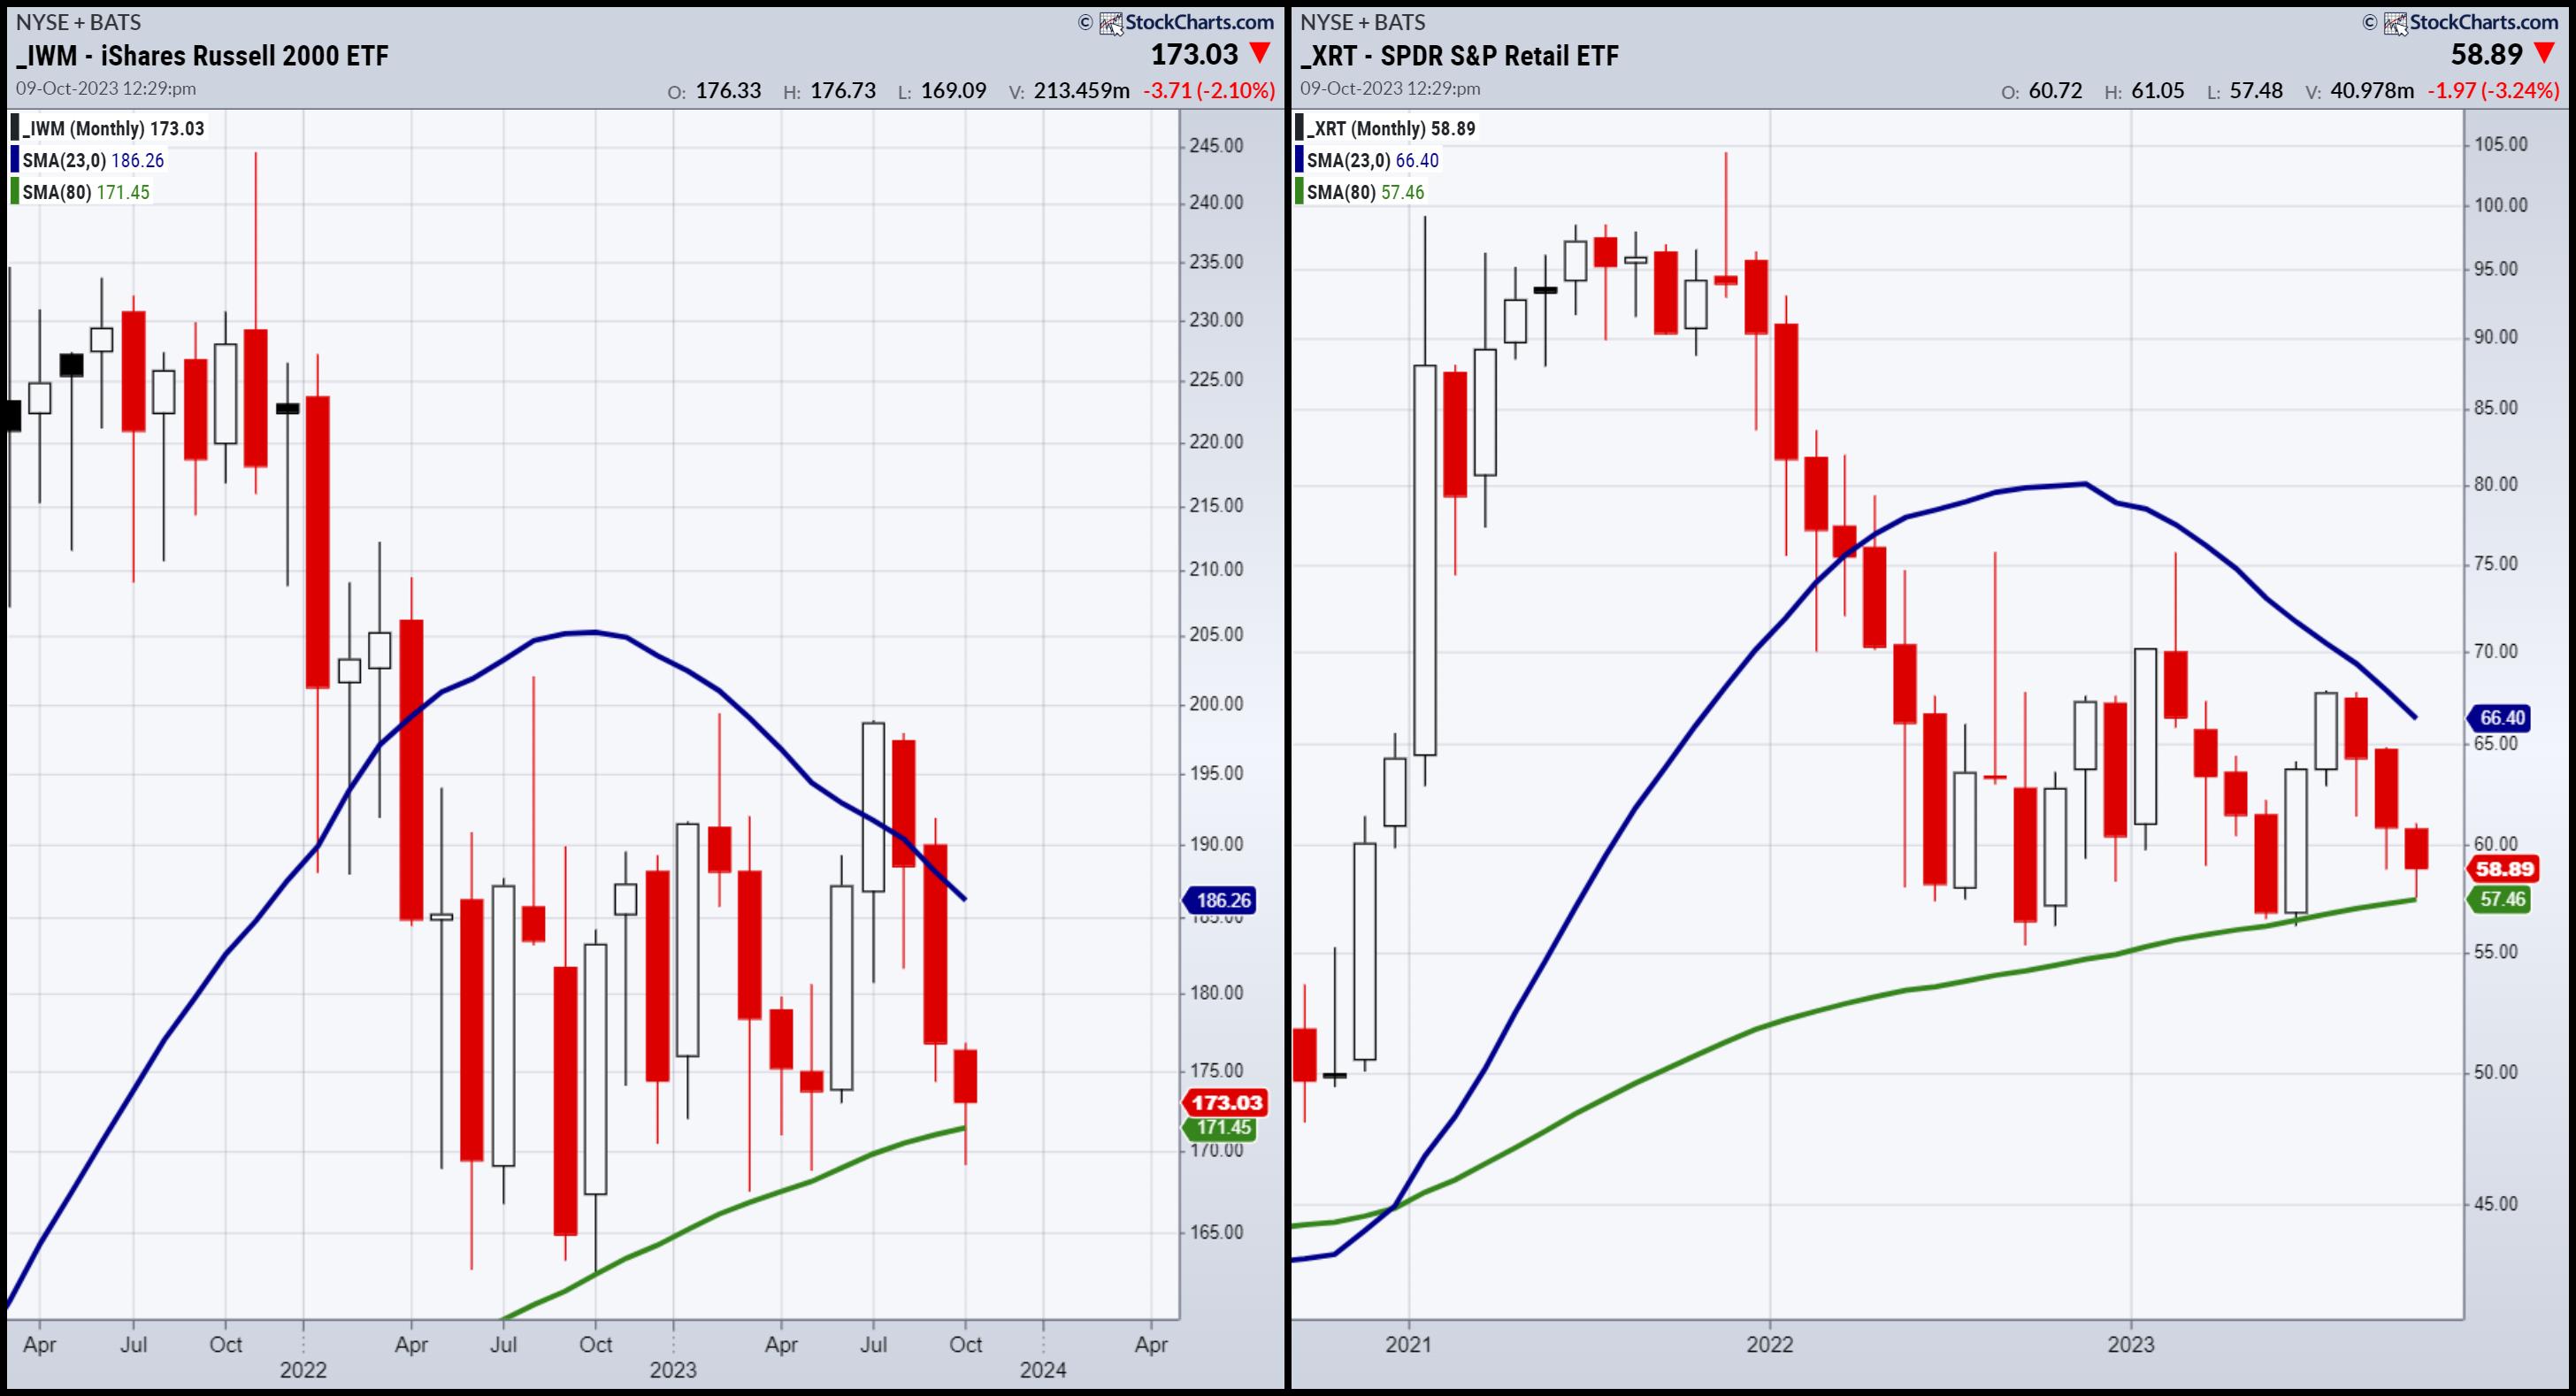
For consistency, here are the key go-tos during an uncertain time in the market:
1. The next direction of long bonds (TLT).
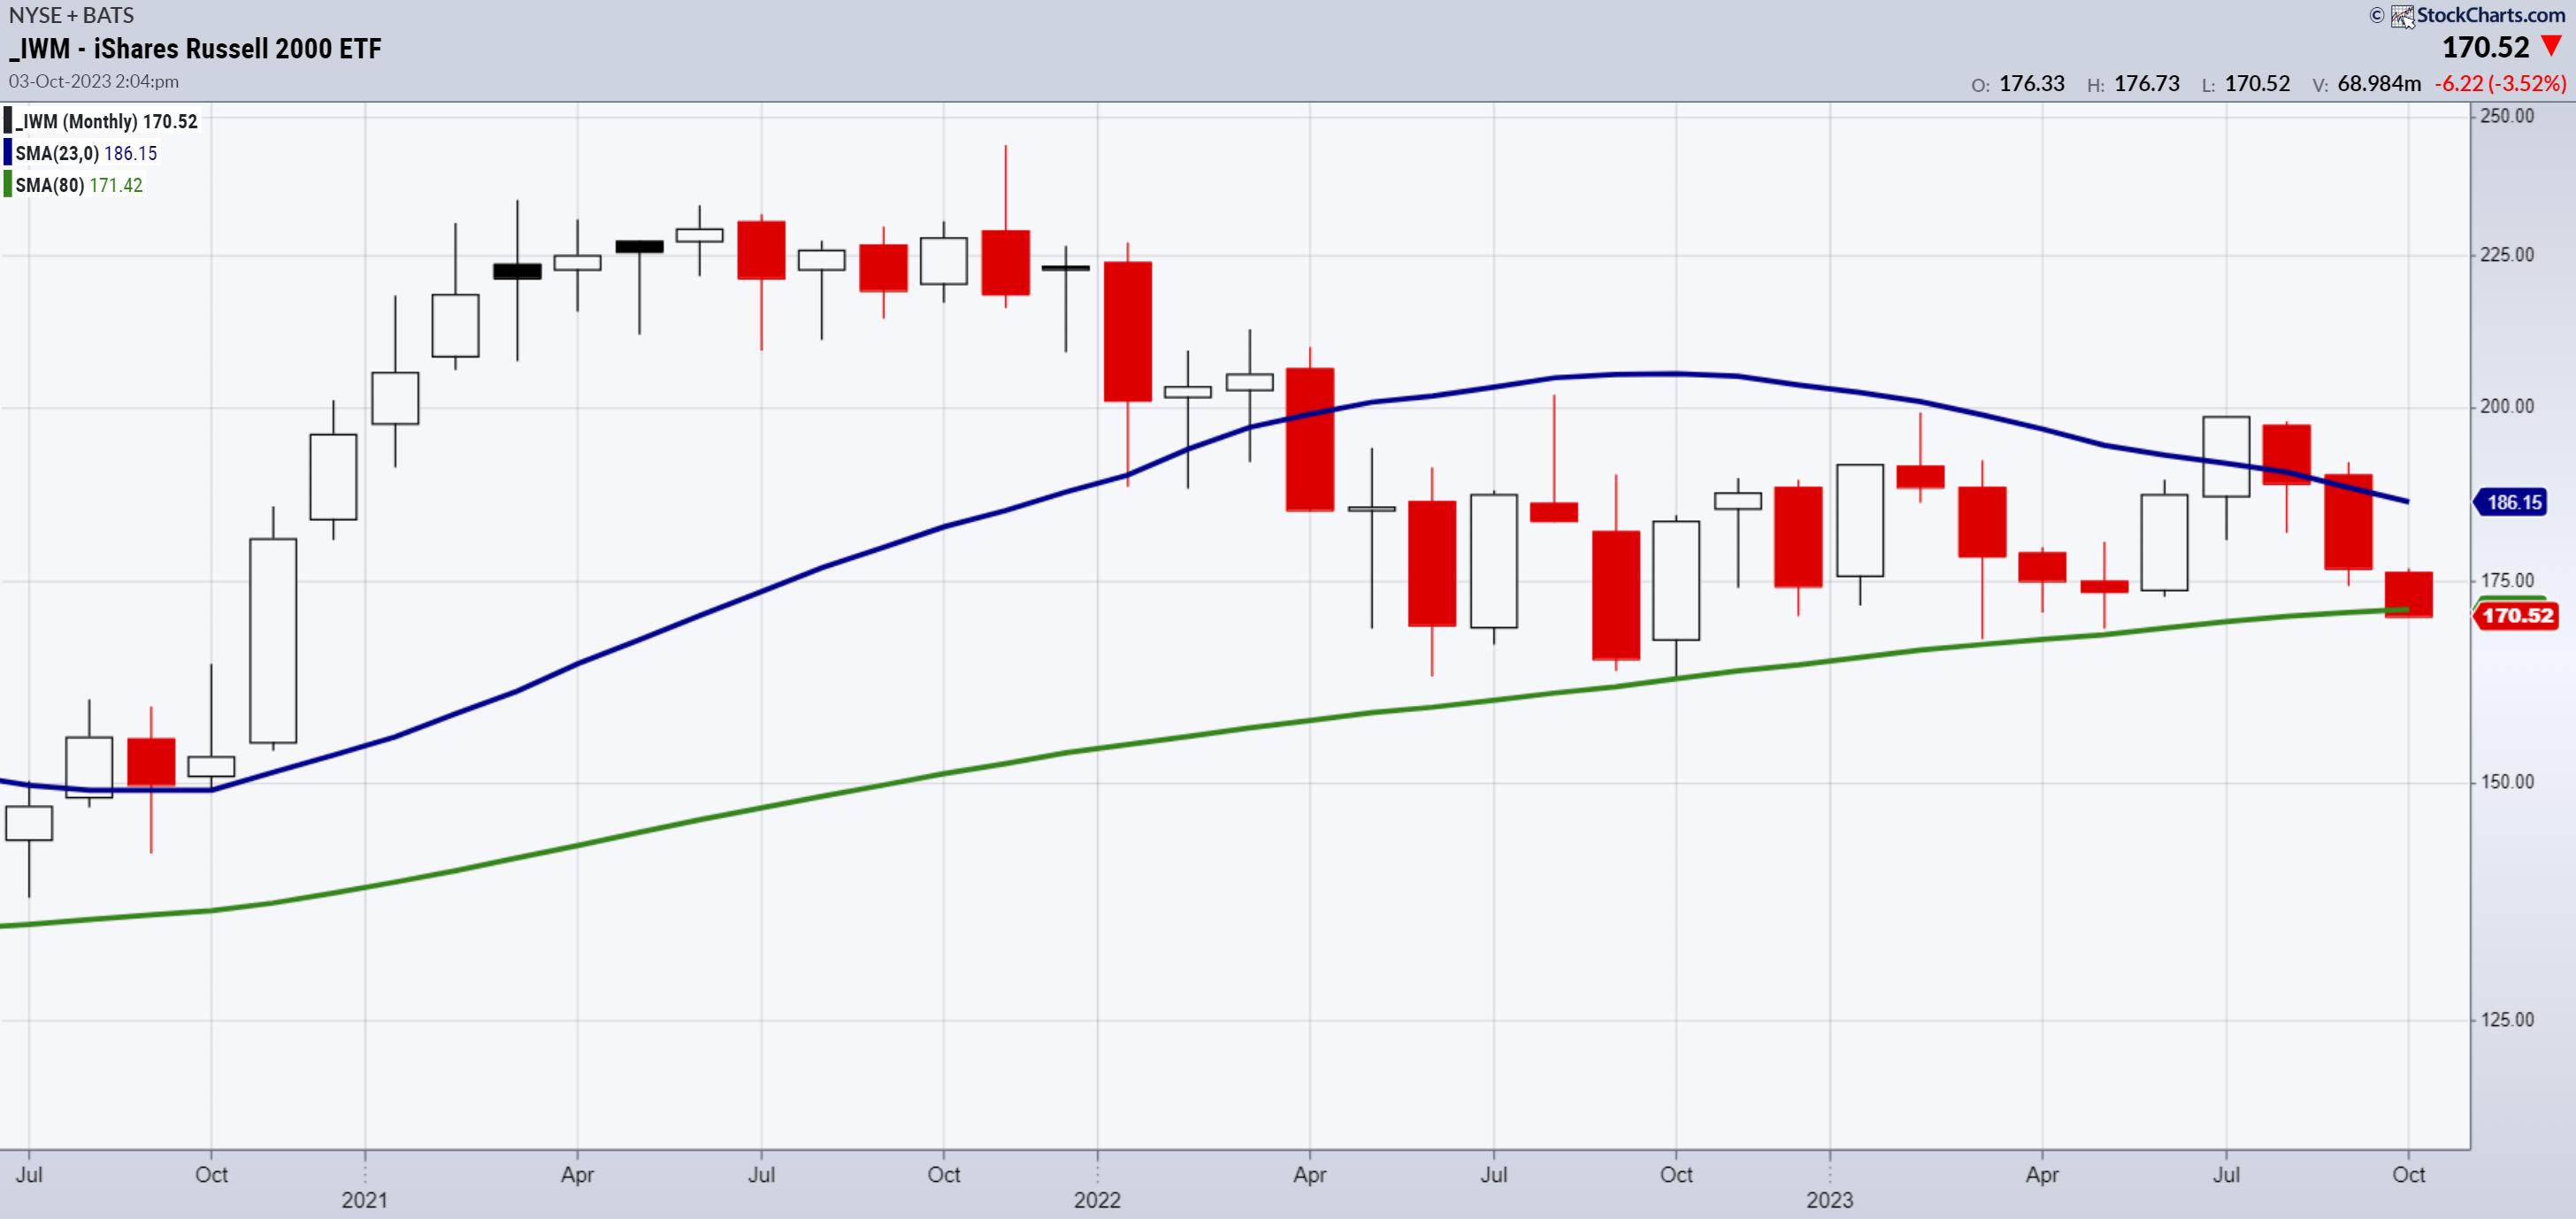
2. The next direction of the small caps and retail sectors (IWM, XRT).
3. The next direction of commodities, all of them, but particularly the agricultural ones, oil...
READ MORE
MEMBERS ONLY

DP Trading Room: Exponential vs. Simple -- This is the Moving Average We Use

by Erin Swenlin,
Vice President, DecisionPoint.com

by Carl Swenlin,
President and Founder, DecisionPoint.com
In this week's edition of The DecisionPoint Trading Room, Carl opens the show with a discussion of the yield curve, followed by his coverage of the Magnificent 7+ and the market in general. Erin looks at the effect of war on the Energy sector, as well as a...
READ MORE
MEMBERS ONLY

Maximizing Profits: Three Stocks in Three Phases

by David Keller,
President and Chief Strategist, Sierra Alpha Research
KEY TAKEAWAYS
* The accumulation phase is marked by higher highs and higher lows, as investors push the price onward and ever upward.
* Stocks in the distribution phase are trending lower, with the price usually below two downward-sloping moving averages.
* A symmetrical triangle or "coil" pattern is a telltale...
READ MORE
MEMBERS ONLY

MEM TV: Here's What To Do With Base Breakouts and Other Bullish Signals

by Mary Ellen McGonagle,
President, MEM Investment Research
In this episode of StockCharts TV'sThe MEM Edge, Mary Ellen reviews the bullish bias that's shaping up in the markets as high-growth areas begin to turn positive. She also provides insights into what's driving this price action, as well as what to be on...
READ MORE
MEMBERS ONLY

How Market Breadth Indicators Can Lead You Out of Market Bottoms
by David Keller,
President and Chief Strategist, Sierra Alpha Research
In this edition of StockCharts TV'sThe Final Bar, Dave digs out his market correction playbook and shares what market breadth indicators tend to do leading into and out of market bottoms. He also reveals the charts that can serve investors well in corrective phases, using relative strength as...
READ MORE
MEMBERS ONLY
Time to Talk 6-7 Year Market Business Cycles
We began the year examining the 23-month moving averages in all the indices and major market sectors. It was pretty simple, really: buy anything that cleared the blue line (2-year business cycle), which we explained was a good reflection of a cycle within a cycle (6-7 year cycles are typical)...
READ MORE
MEMBERS ONLY
Two Holding Up and Two Breaking Down

by Arthur Hill,
Chief Technical Strategist, TrendInvestorPro.com
The pockets of strength are shrinking as more stocks succumb to selling pressure. The Nasdaq 100 is the strongest of the major indexes, while the Finance sector is one of the weakest sectors. Today's report will highlight two leaders within the Nasdaq 100 and two laggards within the...
READ MORE
MEMBERS ONLY
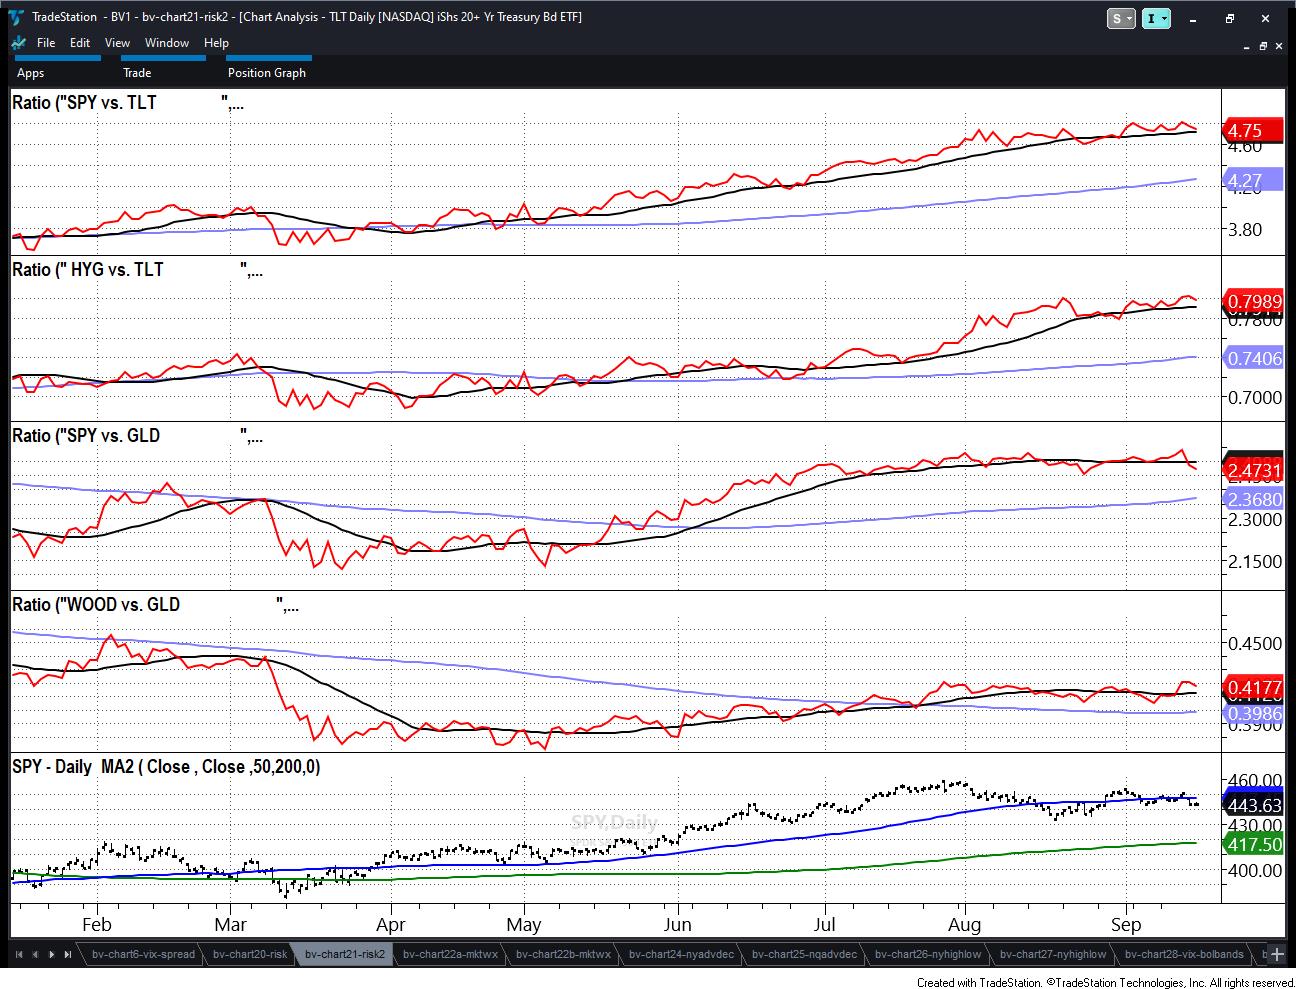
3 Key Relationships to Help Assess Market Direction
If you are finding yourself fluctuating between bullishness and bearishness, then congratulations! Hopefully, that also means you are waiting for certain signals to help you commit to one way or another.
Here are the signals we are waiting for before overly committing to a bias:
1. As we wrote over...
READ MORE
MEMBERS ONLY
DP Trading Room: This is the ONLY Sector Showing STRENGTH Right Now
by Erin Swenlin,
Vice President, DecisionPoint.com
by Carl Swenlin,
President and Founder, DecisionPoint.com
In this week's edition of The DecisionPoint Trading Room, Carl, after a walkthrough of the Magnificent 7+ stocks, examines how, while it was clear that there's some strength to be had in the Nasdaq, one look at the Ultrashort for Dow 30 (SDOW) and an internal...
READ MORE
MEMBERS ONLY
MEM TV: Here's Why the Nasdaq OUTPERFORMED Last Week
by Mary Ellen McGonagle,
President, MEM Investment Research
In this episode of StockCharts TV'sThe MEM Edge, Mary Ellen reviews areas of the market that are bucking the downtrend pressure elsewhere, as those often go on to provide leadership once the markets turn. She also shares how to use ETFs to uncover rotation taking place beneath the...
READ MORE
MEMBERS ONLY

Risk-Neutral Market Gauges Ahead of Sunday Deadline
We do not want to walk down the political aisle. Nonetheless, what person can turn their heads away from the Sunday deadline on funding the government?
The aftermath of a shutdown will most likely include a credit downgrade for the US. Do Americans need another reason to distrust the politicos?...
READ MORE
MEMBERS ONLY

Boyz to Men -- Step Back to Small Caps & Growth Stocks
We started this year looking at the monthly charts and the 2 moving averages that depict business cycles.
Back in February, we wrote:
All in all, the key sectors (retail, transportation) have more to prove, especially by clearing the 23-month moving average or 2-year business cycle. This is a significant...
READ MORE
MEMBERS ONLY

Sector Spotlight: Sector Rotation Sends Mixed Signals

by Julius de Kempenaer,
Senior Technical Analyst, StockCharts.com
On this episode of StockCharts TV's Sector Spotlight, after two weeks of non-regular market updates, I'm back with a regular episode. Here, I dive deep into the current state of rotation in asset classes, highlighting the strength of commodities and the opposing rotations for stocks and...
READ MORE
MEMBERS ONLY
DP Trading Room: Don't Forget The MONTHLY CHARTS! Earnings Spotlight
by Erin Swenlin,
Vice President, DecisionPoint.com
by Carl Swenlin,
President and Founder, DecisionPoint.com
In this week's edition of The DecisionPoint Trading Room, Carl opens with a discussion on why you should use monthly charts even if you are investing in the shorter term. He gives us insight into the market as a whole and reviews the Magnificent 7 stocks and Tesla...
READ MORE
MEMBERS ONLY
The Halftime Show: Fixed Income Continues To Fall, Can't Say I Didn't WARN You!

by Pete Carmasino,
Chief Market Strategist, Chaikin Analytics
Pete has been monitoring and calling out the downfall of TLT for nearly 20 months. In this week's edition of StockCharts TV'sHalftime, Pete explains why the ETF broke below $90 and how the US 10-year is over 4.5% on the same day. He dives into...
READ MORE
MEMBERS ONLY
MEM TV: How to Tell When It's Safe to Get Back Into the Markets
by Mary Ellen McGonagle,
President, MEM Investment Research
In this episode of StockCharts TV'sThe MEM Edge, Mary Ellen reviews what drove the previous week's sharp pullback and what we'll need to see before the markets can turn positive again. She also highlights recession-proof stocks that are currently attractive as well as high...
READ MORE
MEMBERS ONLY

Nvidia Stock: Why It's Screaming a Spectacular Buy Signal

by Jayanthi Gopalakrishnan,
Director of Site Content, StockCharts.com
KEY TAKEAWAYS
* NVDA stock is holding on to the support of its 100-day moving average
* NVDA has maintained a high StockCharts Technical Rank (SCTR) since early 2023
* NVDA's relative strength with respect to the S&P 500 is approaching 200%
Nvidia's stock has maintained a...
READ MORE
MEMBERS ONLY
Market Begs: Tell Us Something Good!
We compiled a list of the 10 biggest uncertainties in the stock market right now.
In no particular order:
1. China-trade wars and chip wars
2. Oil and food inflation
3. Strikes
4. Government shutdown
5. Corporate and individual bankruptcies on the rise
6. Commercial real estate and banking
7....
READ MORE
MEMBERS ONLY

Energy Sector Roulette: Bullish Signals, Sluggish Projections

by Karl Montevirgen,
The StockCharts Insider
KEY TAKEAWAYS
* Energy Select Sector SPDR Fund (XLE) shows some promising technicals, signaling room for a potential climb and a strong chance for a breakout to the upside
* Technical indicators suggest that the Energy sector has a high probability of breaking out to the upside
* A breakout above its all-time...
READ MORE
MEMBERS ONLY

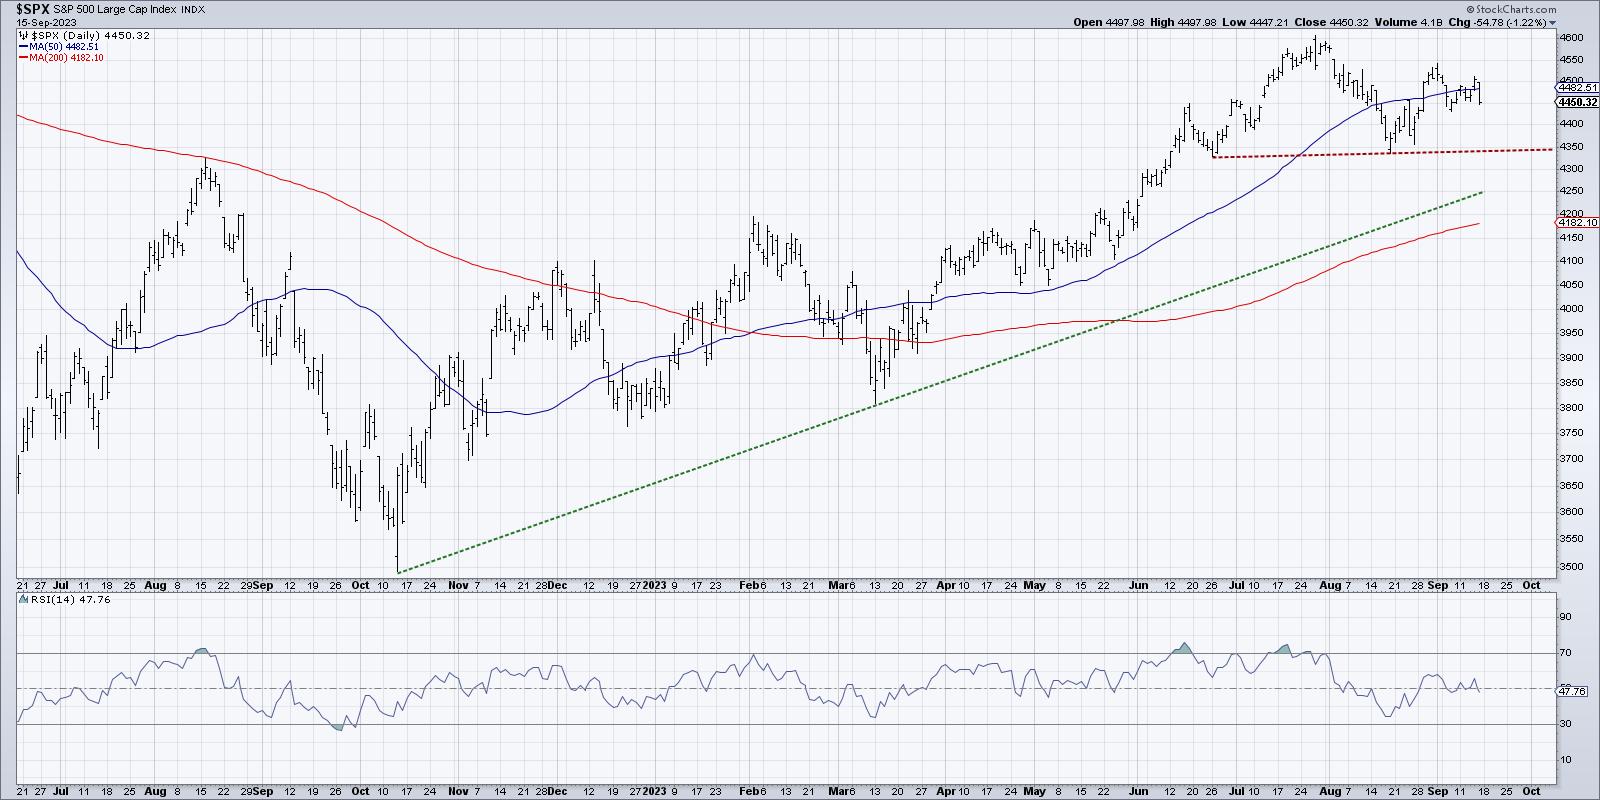
S&P 500 Turnaround: 3 Charts You Need To Watch
by Jayanthi Gopalakrishnan,
Director of Site Content, StockCharts.com
KEY TAKEAWAYS
* Rising Treasury yields have hurt growth stocks but buying opportunities could lie ahead
* The stock market could bottom at the end of September and present buying opportunities
* Watch Fibonacci levels, Equal Weighted S&P 500 Index, and market breadth for a reversal
Last week wasn't...
READ MORE
MEMBERS ONLY

Volatility Taunting Fresh Equity Buyers
This week I appeared with David Keller on Stockcharts Final Bar. We discussed how the market is at a precipice. And no doubt, the words I wrote on April 20th Daily "Now That "Stagflation" Has Gone Mainstream"some five months later are buzzing in my head:...
READ MORE
MEMBERS ONLY

Sector Rotation Signals an Important Week Ahead for Stocks
by Julius de Kempenaer,
Senior Technical Analyst, StockCharts.com
KEY TAKEAWAYS
* Short Term, Risk-Off Sector Rotation While Heading into new week
* Did The Market Complete a H&S Top, or Is SPY Looking For Support?
* 430 Is The Crucial Level To Watch in SPY
First of all, my apologies for everybody who has been waiting for a Sector...
READ MORE
MEMBERS ONLY
Confirmed! Head-and-Shoulders Top Pattern for the S&P 500!
by David Keller,
President and Chief Strategist, Sierra Alpha Research
In this edition of StockCharts TV'sThe Final Bar, Mish Schneider of MarketGauge shares why the most important ETFs to watch are Retailers (XRT) and Small Caps (IWM) and also shares their latest plugin on the StockCharts ACP platform. Host David Keller, CMT tracks today's risk-off move...
READ MORE
MEMBERS ONLY

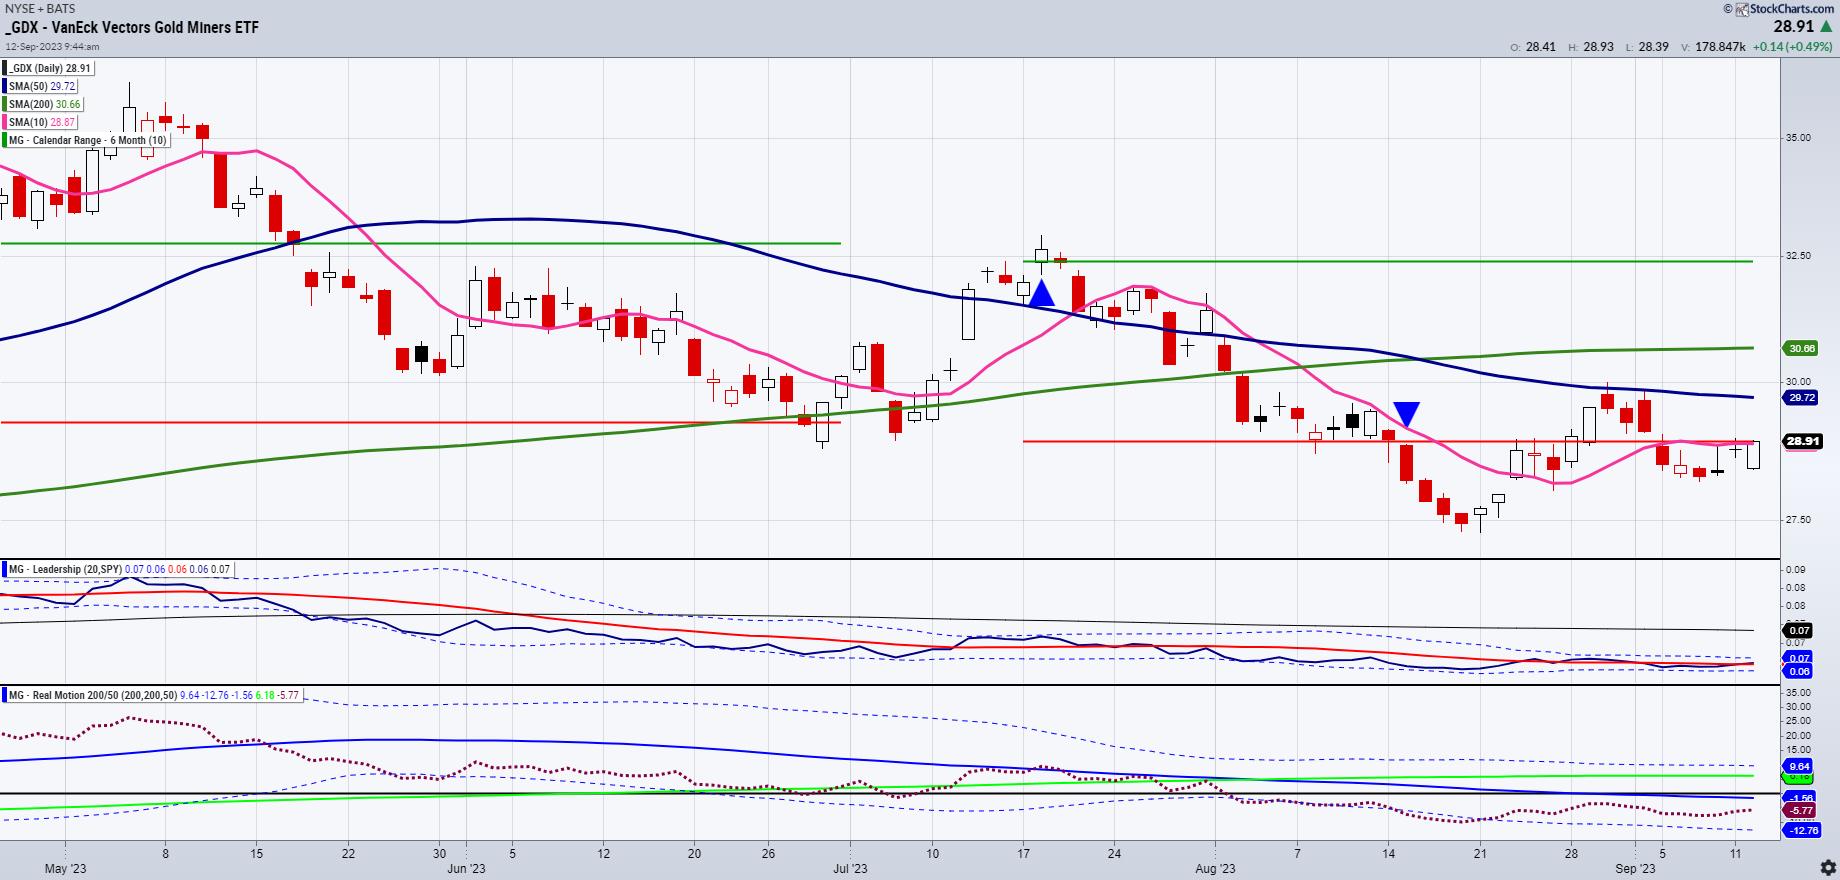
Seasonality and Fundamentals Converging on GLD
by Karl Montevirgen,
The StockCharts Insider
KEY TAKEAWAYS
* A convergence of fundamental and seasonality data predicts a potential decline in gold prices by the end of the year
* Demand for gold has decreased by about 5% year-over-year in the first half of 2023, with central banks being the primary buyers
* The Williams True Seasonal indicator aligns...
READ MORE
MEMBERS ONLY

1-2-3 Change in Trend Setup

by Joe Rabil,
President, Rabil Stock Research
On this week's edition of Stock Talk with Joe Rabil, Joe explains the 1-2-3 change in trend sequence in multiple timeframes. First, he discusses focuses on the higher timeframe and how to identify a zone or a pool of support. Then, he shows how to take advantage of...
READ MORE
MEMBERS ONLY
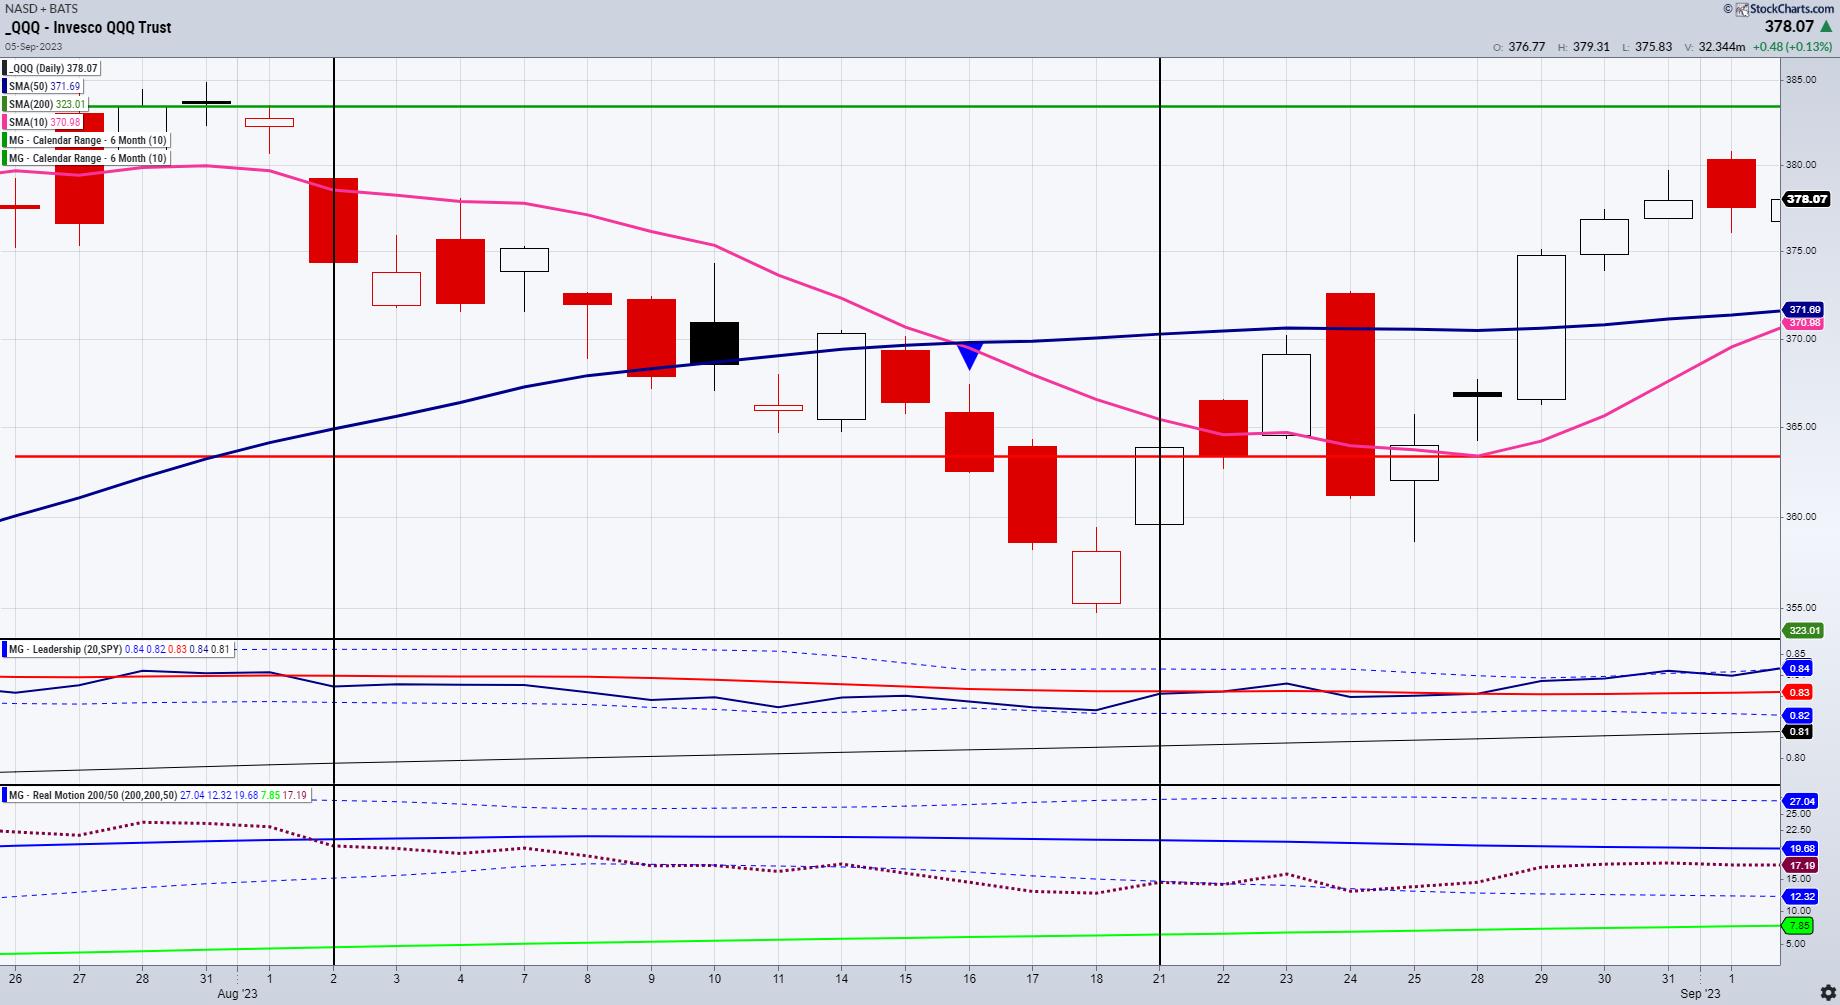
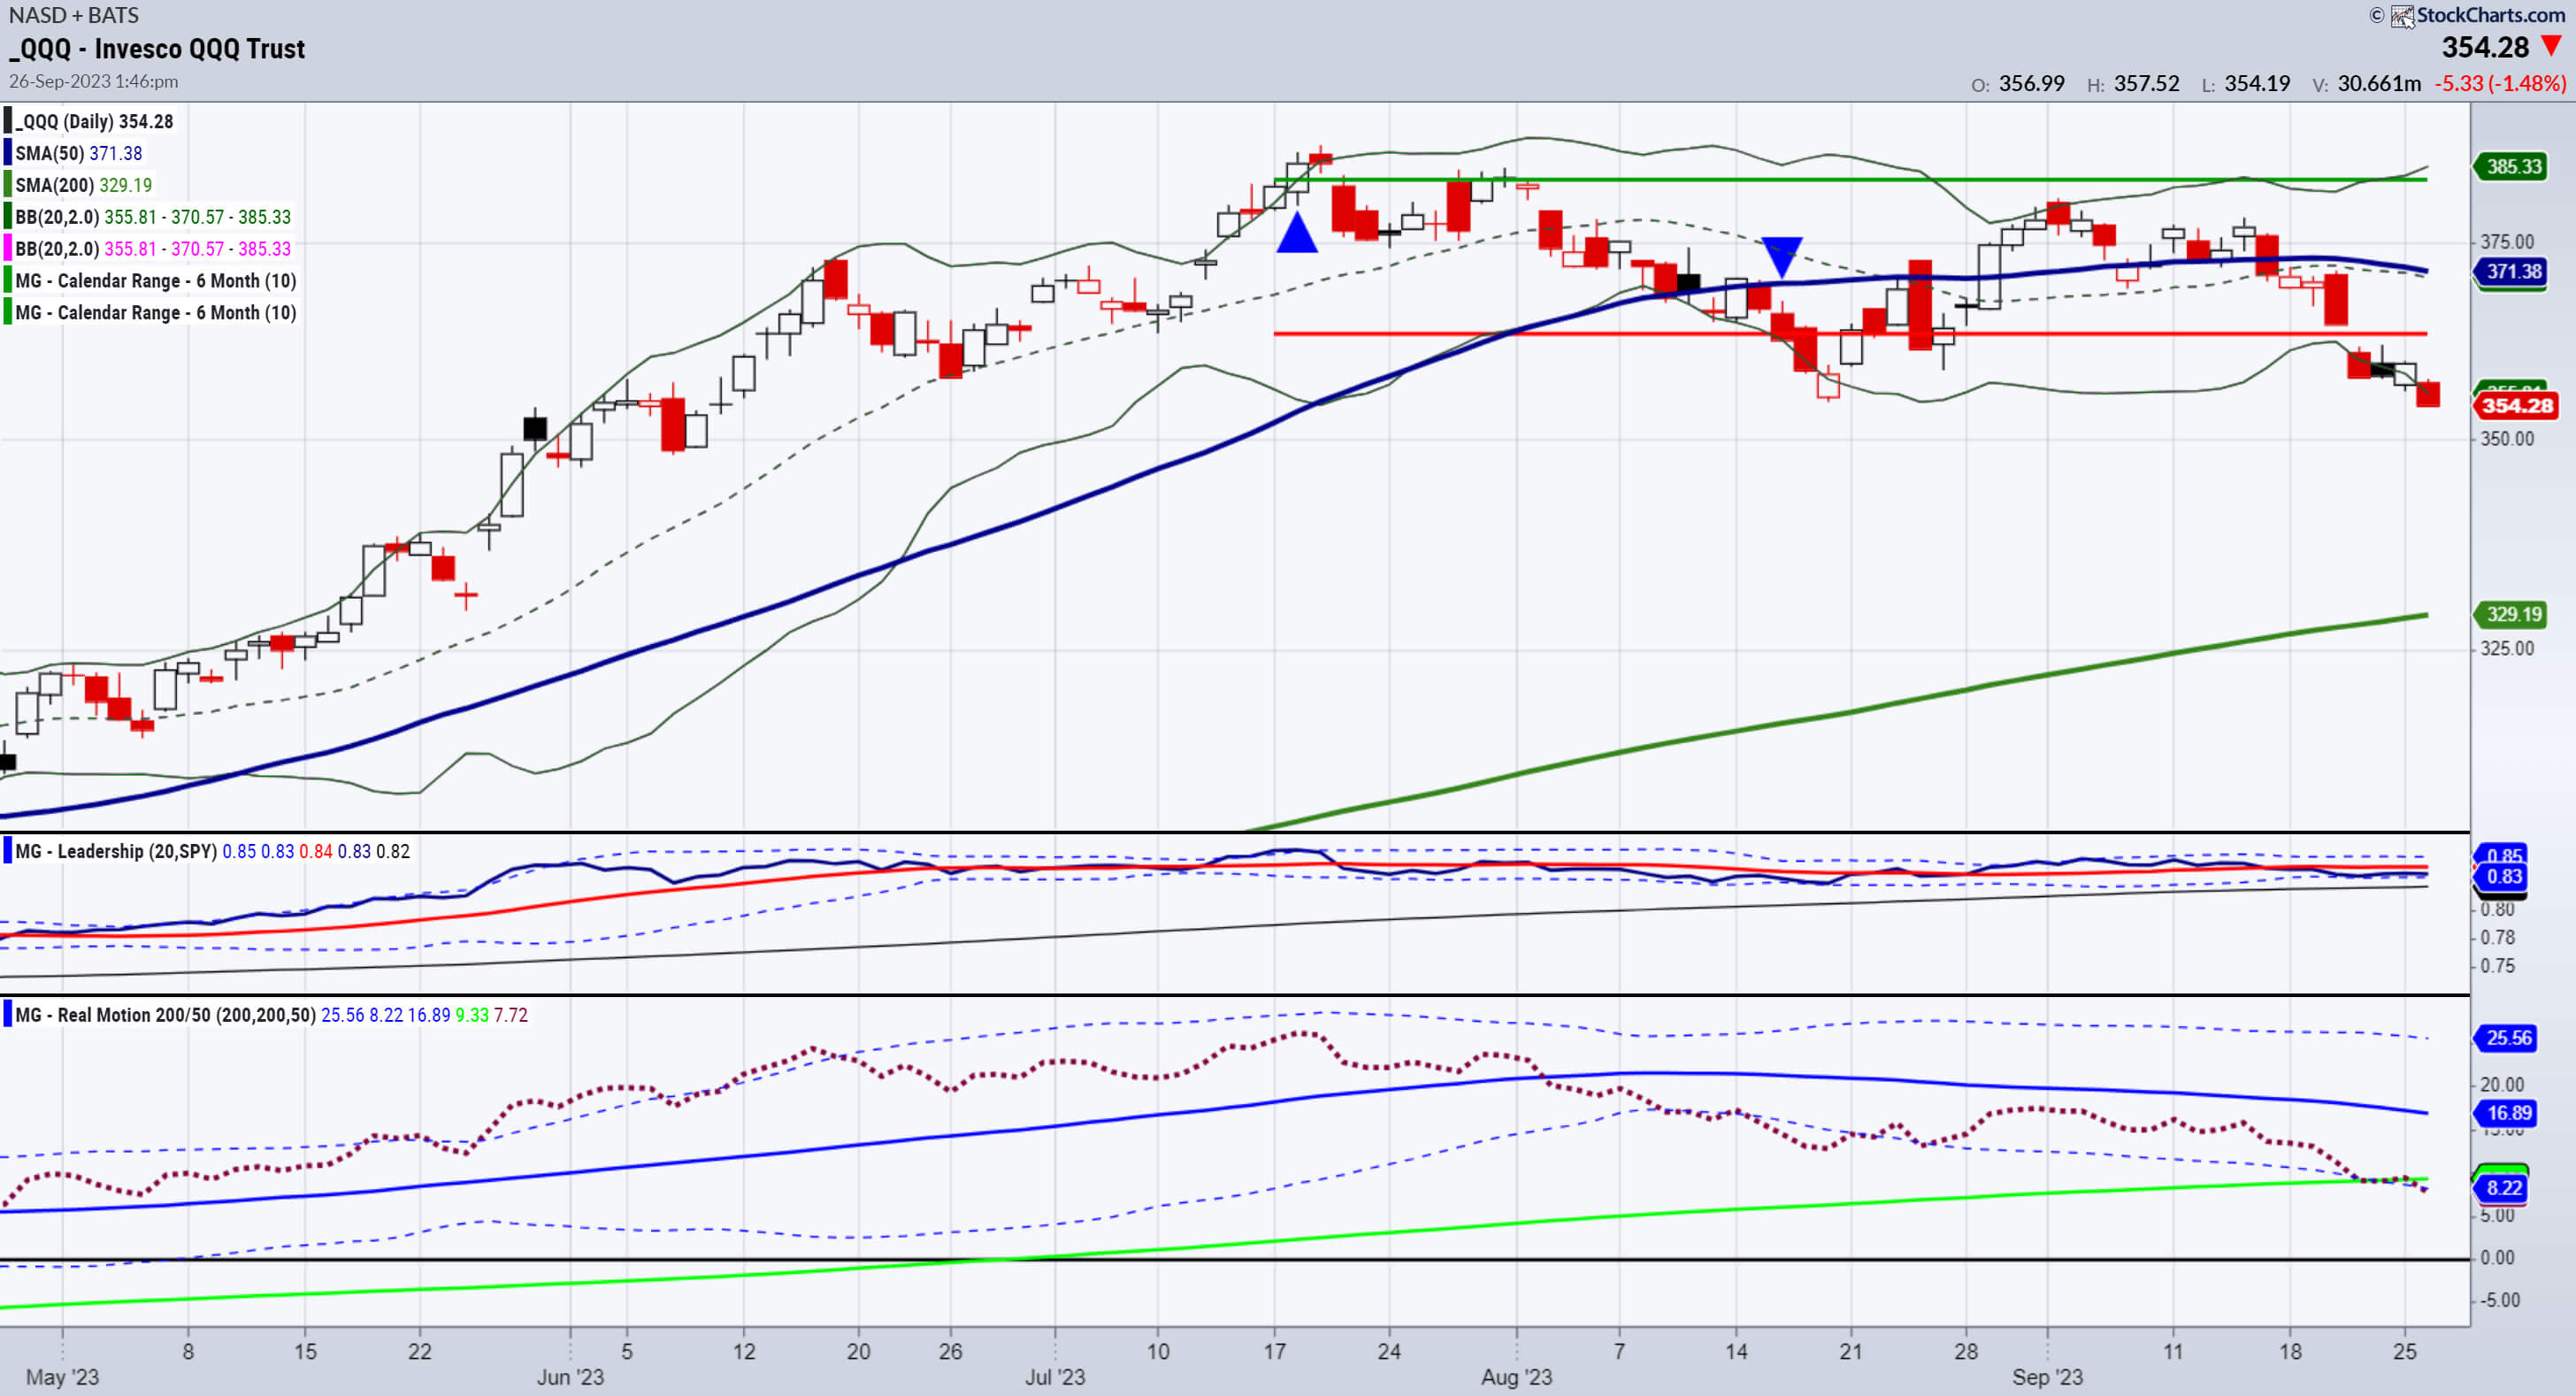
When Calendar Ranges, Leadership, Momentum and Price Align
We are so excited that StockCharts.com is now offering you our ACP plugins, we had to write about it for today's Daily, especially since you can read anywhere the thousands of differing opinions on what Powell said today and the implications for the market. Simply put, these...
READ MORE
MEMBERS ONLY
Timing the Market With the WillTrend Indicator
by Karl Montevirgen,
The StockCharts Insider
KEY TAKEAWAYS
* The WillTrend indicator helps identify stock trends and optimal entry and exit points
* The WillTrend indicator provides clear signals in weekly and daily charts that help determine actionable trading scenarios
* It's important to take each signal within the context of the stock's current technical...
READ MORE
MEMBERS ONLY
Two Key Groups Take a Turn for the Worse
by Arthur Hill,
Chief Technical Strategist, TrendInvestorPro.com
A few large-caps and large-cap techs are holding up, but other areas of the market are showing weakness. Namely, the Retail SPDR (XRT) and Regional Bank ETF (KRE) are two of the weakest groups right now. These two groups are under selling pressure and this could bode ill for the...
READ MORE
MEMBERS ONLY
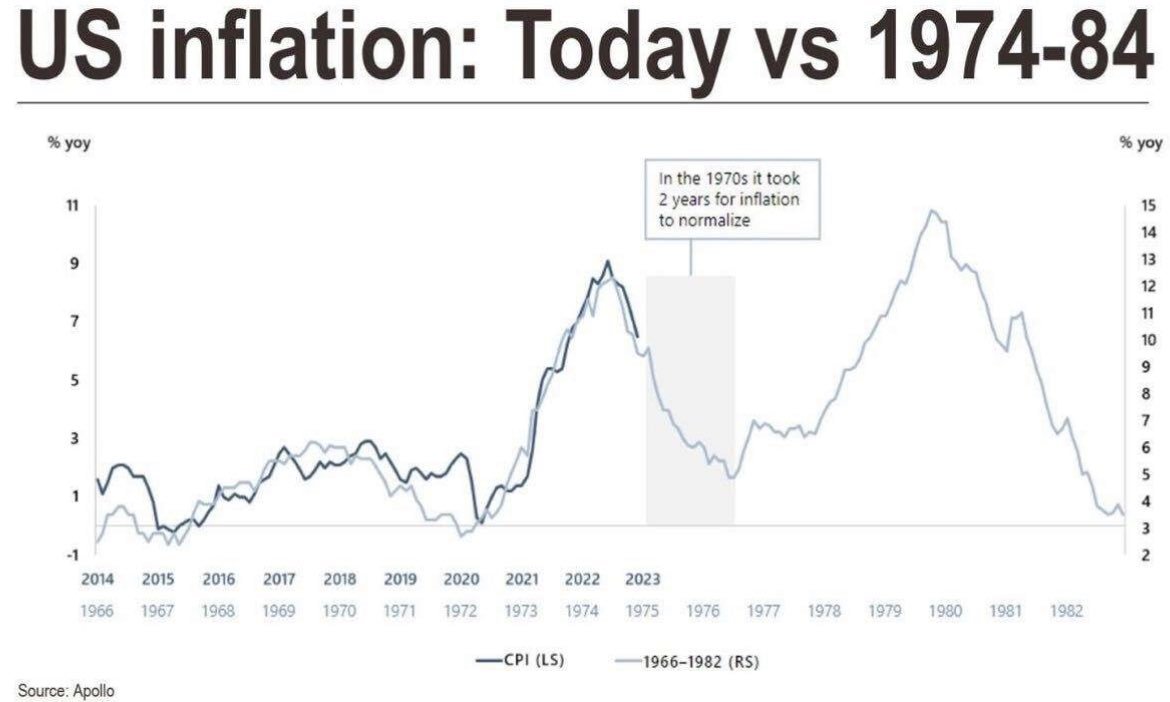
History Rhymes: 1974-1976 vs. 2022-2024?
How many of you have heard me say that commodities are inherently volatile?
Clearly, from this chart, you can see that after the oil rally in the mid 1970s, the CPI went from nearly 9% in 1974 down to 2% in 1976. Sugar, my favorite barometer of inflation, ran to...
READ MORE
MEMBERS ONLY

Q4 Stock Market Outlook: 3 Analysts, 3 Insights
by Jayanthi Gopalakrishnan,
Director of Site Content, StockCharts.com
KEY TAKEAWAYS
* Although September is considered a seasonally weak period for the stock market the fourth quarter is typically a strong period
* There's a high probability of the S&P 500 Index reaching a new high in Q4
* Growth stocks, Industrials, Financials, and Commodities could all see...
READ MORE
MEMBERS ONLY

Market Up & Down -- Don't Try to Push Your Trades

by TG Watkins,
Director of Stocks, Simpler Trading
The market continues to be weak and thin, as TG explains in this week's edition of Moxie Indicator Minutes. There are a few stocks moving up, but the majority are going sideways or down. This is not a great environment for going long, so don't try...
READ MORE
MEMBERS ONLY
Three ETFs Suggest Further Downside
by David Keller,
President and Chief Strategist, Sierra Alpha Research
This past week had all the potential to see a revival of the great bull market of 2023. The September inflation data, Apple's latest product announcements, and Arm's IPO all seemed had the possibility to reignite the fire of bullishness for investors.
By Friday's...
READ MORE
MEMBERS ONLY

Larry's "Family Gathering" Full September Webinar -- AVAILABLE NOW!

by Larry Williams,
Veteran Investor and Author
Larry's "Family Gathering" webinar is now available! Whether you missed it and need to catch up, or just want to review the information Larry presented, you can now see the full recording below.
In this special presentation, Larry coaches viewers for success and explains his strategies...
READ MORE
MEMBERS ONLY

GNG TV: Growth & Energy LEAD as S&P Chops Around

by Alex Cole,
Co-founder, GoNoGo Charts®

by Tyler Wood,
Co-founder, GoNoGo Charts®
In this edition of the GoNoGo Charts show, Alex and Tyler present trend analysis across the asset classes, sectors, and individual securities. The continued strong "Go" conditions in the US Dollar index (UUP) and US Treasury rates ($TNX) on both the daily and weekly timeframes highlights some headwinds...
READ MORE
MEMBERS ONLY
The Halftime Show: 6 ETFs That Are on My Radar
by Pete Carmasino,
Chief Market Strategist, Chaikin Analytics
In this week's edition of StockCharts TV'sHalftime, Pete reviews 6 ETFs that are in different stages of trends. Two in the banking sector are in downtrends that are undeniable: KRE and KBE. This review ties in the recent commentary from Jamie Dimon, the CEO of JP...
READ MORE
MEMBERS ONLY
Finding and Trading Instrument Bottoms
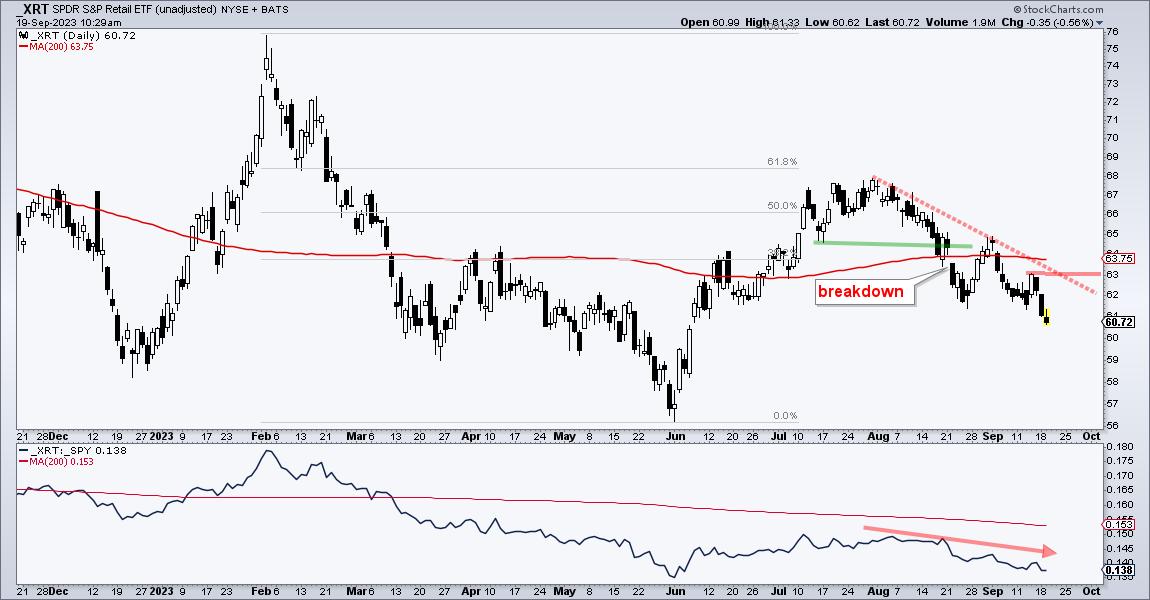
In June, we wrote about the bottom in oil and cannabis through USO and MSOS (ETFs) respectively. In July, we wrote about the potential top in NASDAQ and SPY. In August, we wrote about the importance of the retail sector; XRT is below the July calendar range and a major...
READ MORE
MEMBERS ONLY

Chesapeake Energy: A Stock That Could Pump Much More
by Jayanthi Gopalakrishnan,
Director of Site Content, StockCharts.com
KEY TAKEAWAYS
* Chesapeake Energy stock has been trending higher since June 2023
* Chesapeake Energy stock has room for upside growth
* CHK could benefit from the rise in crude oil prices
In addition to analyzing the stock market's overall performance, running scans when the market opens and after it...
READ MORE
MEMBERS ONLY
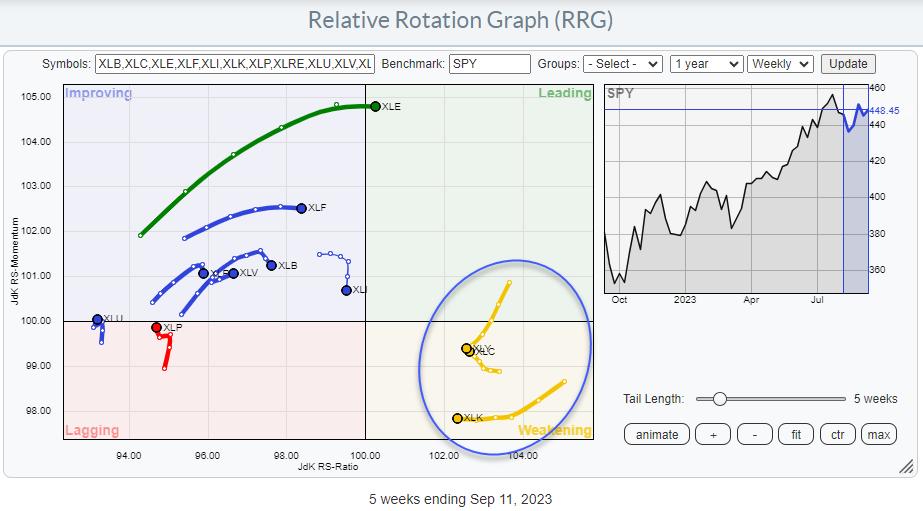
Looks Like a Strong Rotation to The Leading RRG Quadrant is Around the Corner for Three Sectors
by Julius de Kempenaer,
Senior Technical Analyst, StockCharts.com
KEY TAKEAWAYS
* Three Sectors Are Ready to Rotate Back Towards the Leading Quadrant
* Technology, Discretionary, and Communication Services Together Are Almost Half Of Total Market Cap
* Daily Tails for these sectors are supporting the looming positive rotation for their weekly counterparts
First of all, for those who are awaiting a...
READ MORE
MEMBERS ONLY
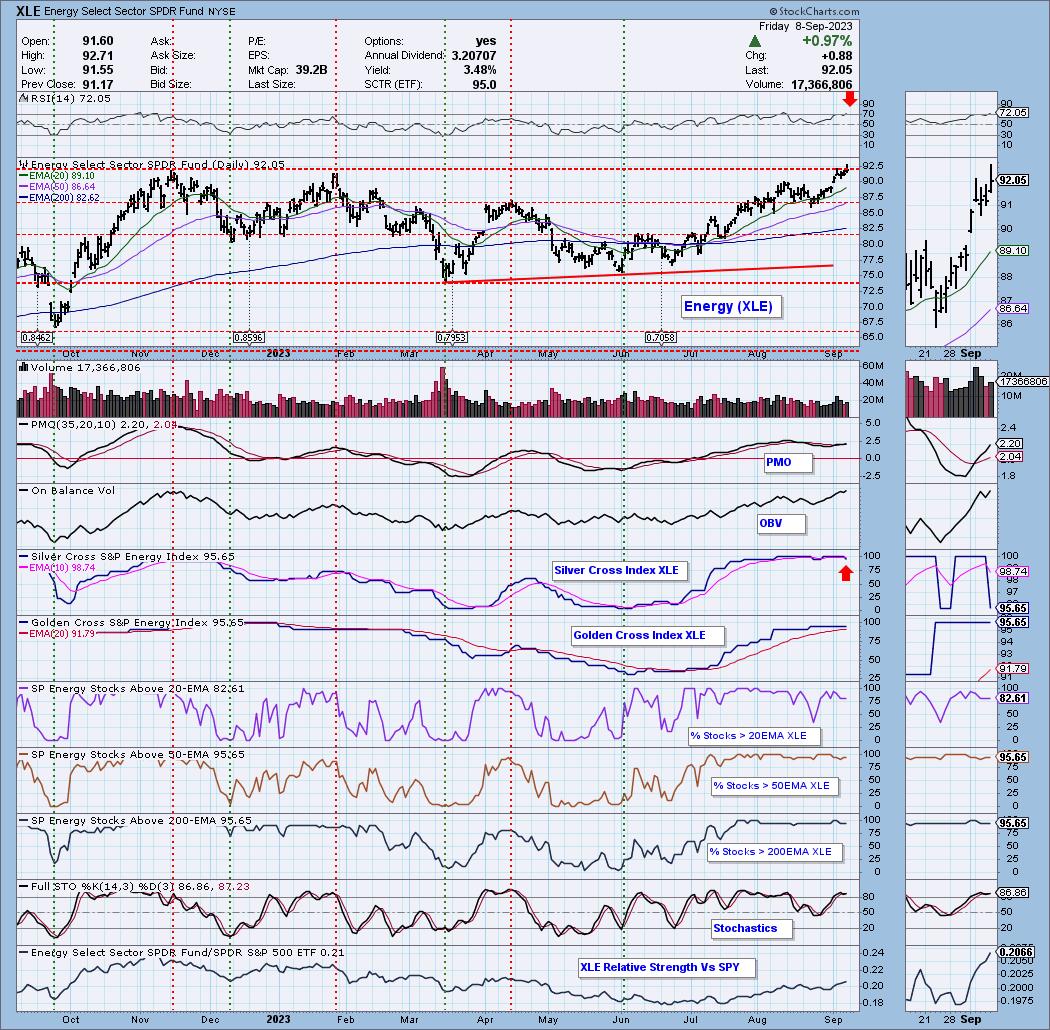
Energy Sector (XLE) Hits All-Time High, Should We Worry?
by Erin Swenlin,
Vice President, DecisionPoint.com
KEY TAKEAWAYS
* Energy (XLE) Logs New All-Time High
* XLE "Bearish Shift" on Silver Cross Index
The Energy sector (XLE) has been enjoying a rally throughout the summer. Today. it logged a new all-time high on a small breakout. While the sector looks impervious, there are a few concerns...
READ MORE
