MEMBERS ONLY

Emerging Stocks to Watch – Breakouts, Momentum & Upgrades!

by Mary Ellen McGonagle,
President, MEM Investment Research
Looking for breakout stocks and top market leaders? Follow along as Mary Ellen shares stock breakouts, analyst upgrades, and sector leadership trends to help you trade strong stocks in today's market.
In this week's episode, Mary Ellen reveals the stocks leading the market higher and explains...
READ MORE
MEMBERS ONLY

S&P 500 Now in Weakest Seasonal Period... Or Is It?

by David Keller,
President and Chief Strategist, Sierra Alpha Research
KEY TAKEAWAYS
* "Sell in May" is less about weakness in the spring and more about weakness in the autumn months.
* Since the COVID low, the S&P 500 has usually been quite strong in May-June-July.
* We're watching the SPX 5750 level along with other indicators...
READ MORE
MEMBERS ONLY

The Stock Market's Comeback: Key Takeaways for Investors

by Jayanthi Gopalakrishnan,
Director of Site Content, StockCharts.com
KEY TAKEAWAYS
* The S&P 500, Nasdaq, and Dow Jones all broke above their 200-day moving averages and signaled renewed strength.
* AI stocks like NVDA and PLTR posted double-digit gains, highlighting continued momentum in AI-driven investing opportunities.
* Investors are rotating into offensive sectors like Technology and Consumer Discretionary.
If...
READ MORE
MEMBERS ONLY

The S&P 500 Snapped Back Hard: Now What?

by Frank Cappelleri,
Founder & President, CappThesis, LLC
KEY TAKEAWAYS
* The S&P 500's 14-week RSI hit its lowest point since the 2008 financial crisis.
* Sector ETFs like XLK (Technology) and XLI (Industrials) are showing bullish patterns.
* While the stock market's rapid reversal is encouraging, historical trends show that pullbacks often follow oversold...
READ MORE
MEMBERS ONLY

How to Use Relative Strength in a Volatile Market

by Joe Rabil,
President, Rabil Stock Research
Want to know how to find strong stocks in a volatile market? In this video, Joe uses Relative Strength (RS), Fibonacci retracements, and technical analysis to spot top sectors and manage downside risk.
Follow along as Joe breaks down how to use the Relative Strength indicator to separate outperforming stocks...
READ MORE
MEMBERS ONLY

Tariff Tensions Ease, Nasdaq Soars — But is SMH the Emerging Leader?

by Karl Montevirgen,
The StockCharts Insider
KEY TAKEAWAYS
* The Nasdaq 100 leads with a strong show of breadth.
* Semiconductors are showing signs of recovery, despite lagging major indices.
* SMH's price action may be reaching a turning point.
For months, investors have been on edge over U.S.-China tariff tensions, bracing for everything from...
READ MORE
MEMBERS ONLY

Is It Time for Emerging Markets to Emerge?

by Martin Pring,
President, Pring Research
The US market has been recovering nicely since the April low, but it has actually been outperformed by the rest of the world this year so far. In that respect, Chart 1 shows that a major shift away from the US could well be in the cards.
It is evident...
READ MORE
MEMBERS ONLY

The Best Five Sectors, #18

by Julius de Kempenaer,
Senior Technical Analyst, StockCharts.com
KEY TAKEAWAYS
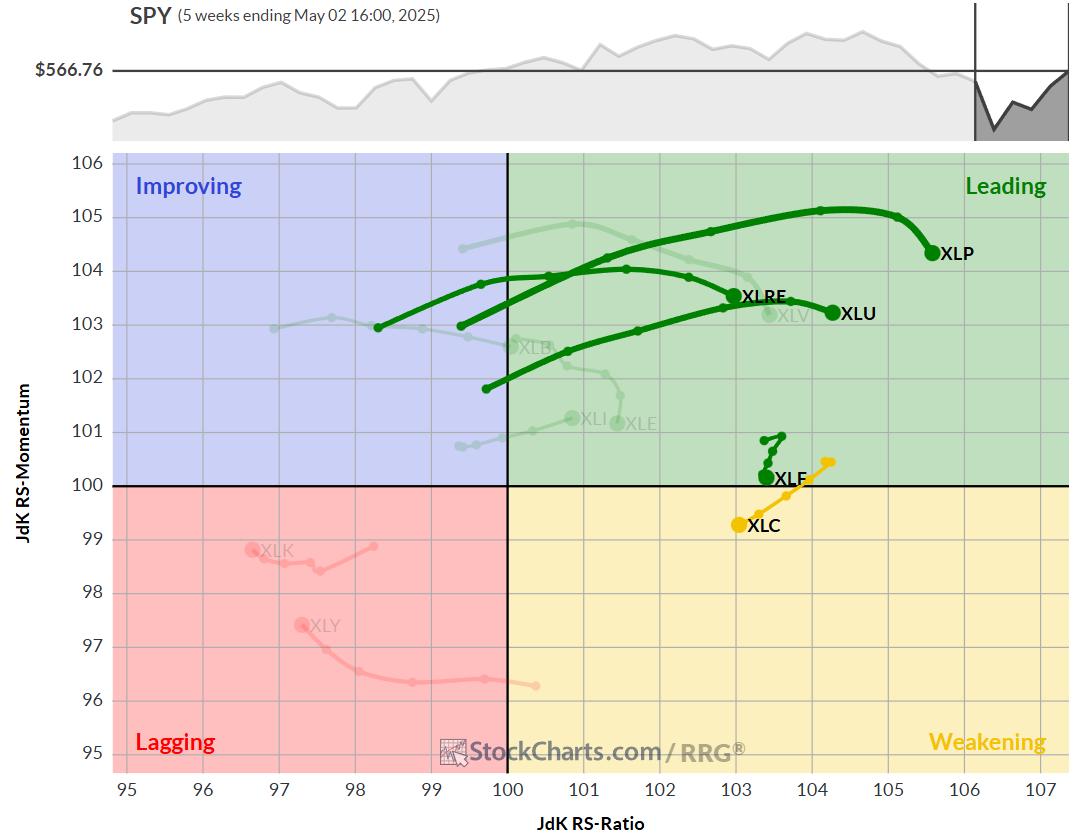
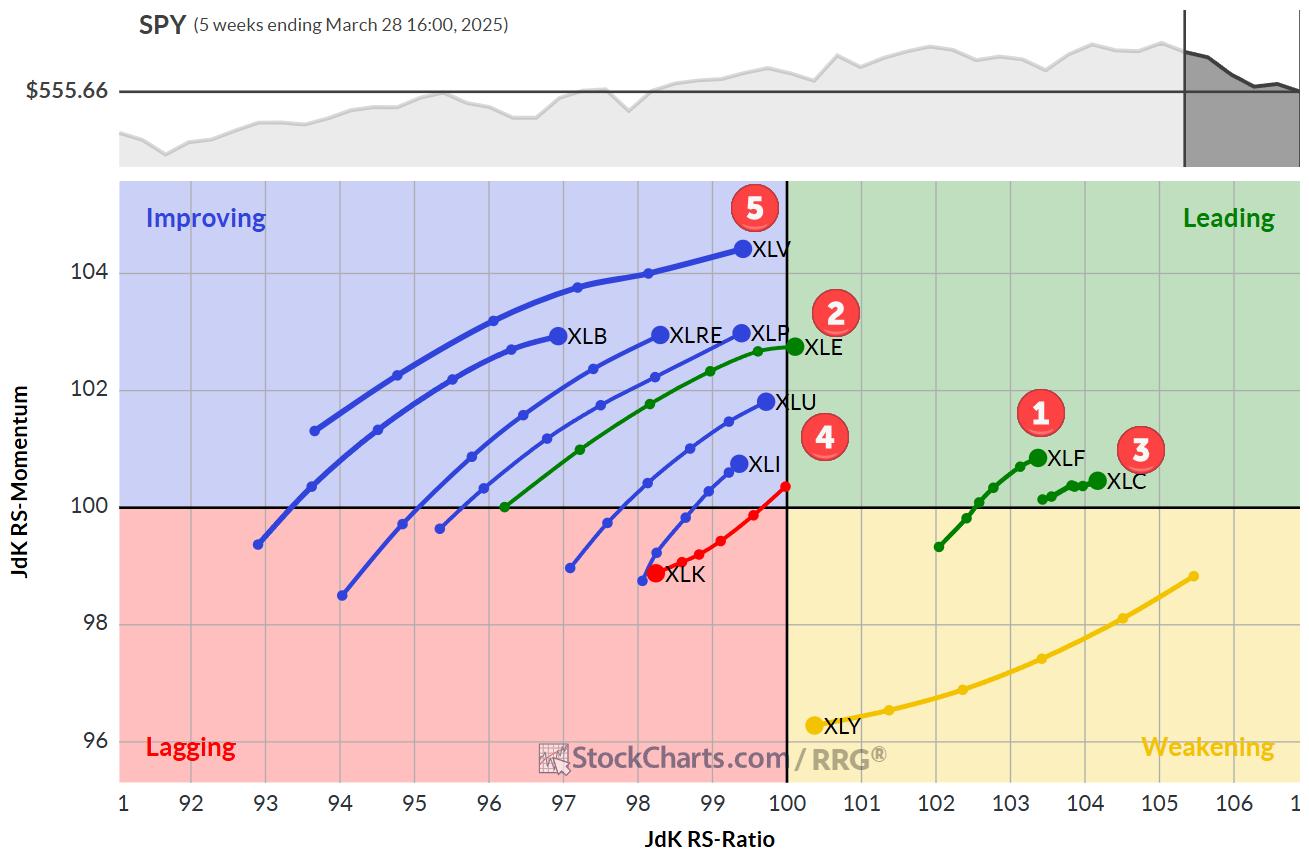
* All 11 sectors changed positions, but the top-5 / bottom-6 composition remained the same.
* Utilities now strongest sector, despite overall market strength.
* Communication Services jumped from 5th to 2nd place.
* Portfolio still 3% behind the S&P 500 YTD, unchanged from last week.
Sector Shuffle: Same Players, New...
READ MORE
MEMBERS ONLY
Where the Market Goes Next: Key Resistance Levels + Top Bullish Stocks to Watch Now
by Mary Ellen McGonagle,
President, MEM Investment Research
Want to know where the stock market is headed next? In this week's market update, Mary Ellen McGonagle analyzes key resistance levels and reveals what's fueling the current uptrend. She highlights top bullish setups among U.S. leadership stocks, plus global names showing strength.
This video...
READ MORE
MEMBERS ONLY

The V Reversal is Impressive, but is it Enough?

by Arthur Hill,
Chief Technical Strategist, TrendInvestorPro.com
KEY TAKEAWAYS
* SPY broke down in March, plunged into early April and surged into early May.
* This V bounce is impressive, but it is not enough to reverse the March breakdown.
* A significant increase in upside participation is needed to move from bear market to bull market.
Stocks plunged into...
READ MORE
MEMBERS ONLY

Fed Watch: Key Bullish Patterns in the S&P 500, Utilities, and Crypto
by Frank Cappelleri,
Founder & President, CappThesis, LLC
KEY TAKEAWAYS
* Bullish chart patterns, such as the inverse head-and-shoulders and cup with handle, are in play in the S&P 500.
* Utilities are breaking to new 50-day highs.
* Bitcoin and Ethereum continue to signal rising risk appetite.
The S&P 500 ($SPX) wrapped up Tuesday just below...
READ MORE
MEMBERS ONLY
The Best Five Sectors, #18
by Julius de Kempenaer,
Senior Technical Analyst, StockCharts.com
KEY TAKEAWAYS
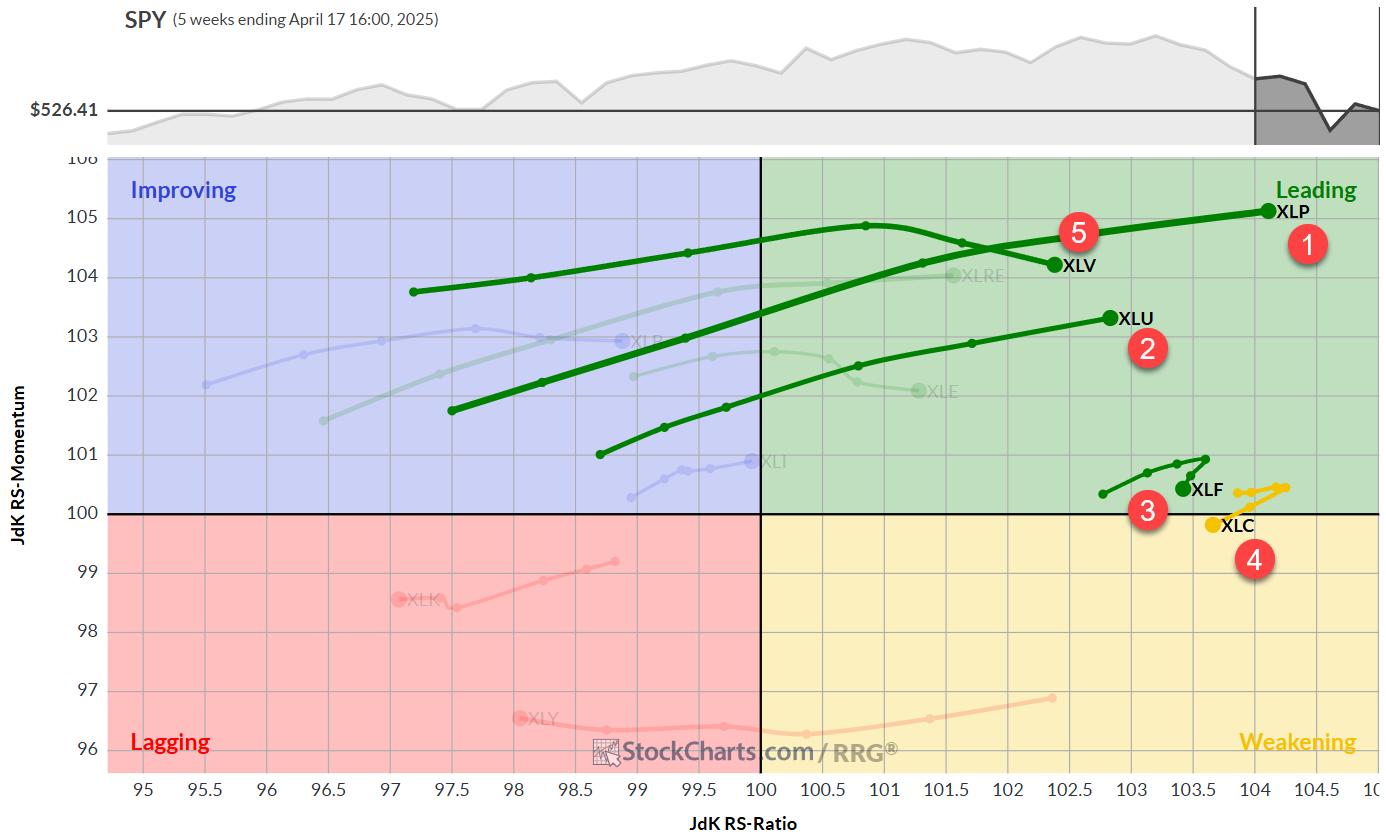
* Top 5 sectors remain unchanged, with minor position shifts
* Leading sectors showing signs of losing momentum
* Daily RRG reveals top sectors in weakening quadrant
* Communication services at risk of dropping out of top 5
Communication Services Drops to #5
The composition of the top five sectors remains largely...
READ MORE
MEMBERS ONLY

Stock Market Wrap: Stocks Rebound as May Kicks Off with a Bang—What Investors Should Know
by Jayanthi Gopalakrishnan,
Director of Site Content, StockCharts.com
KEY TAKEAWAYS
* A strong jobs report sparked a stock market rally, with major indexes closing the week higher.
* Positive earnings from Microsoft and Meta Platforms took the Nasdaq Composite above its 50-day moving average.
* Financials, Industrials, and Technology were the leading sectors this week, with Financials showing technical strength.
We...
READ MORE
MEMBERS ONLY

If Non-US Equities Continue to Outperform the S&P, Will Europe or Asia Benefit Most?
by Martin Pring,
President, Pring Research
Since the tariff war first broke out, there have been widespread reports in the financial press telling us that investors have decided to cash in on their U.S. profits and move their capital abroad. The U.S., they tell us, is no longer regarded as a safe haven. Indeed,...
READ MORE
MEMBERS ONLY

Our Very Last Trading Room

by Erin Swenlin,
Vice President, DecisionPoint.com
Today, Carl and Erin made a big announcement! They are retiring at the end of June so today was the last free DecisionPoint Trading Room. It has been our pleasure educating you over the years and your participation in the trading room has been fantastic! Be sure and sign up...
READ MORE
MEMBERS ONLY

The Best Five Sectors, #17
by Julius de Kempenaer,
Senior Technical Analyst, StockCharts.com
KEY TAKEAWAYS
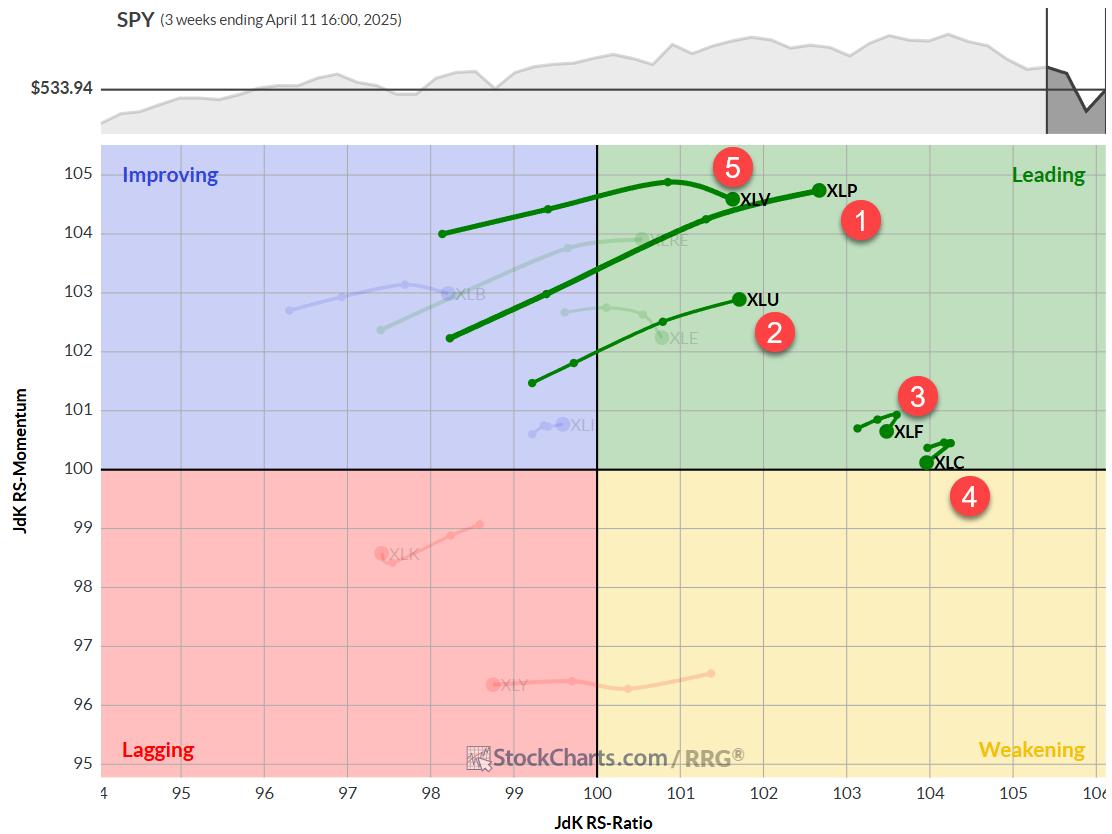
* Defensive sectors maintain dominance in top 5, despite strong market performance.
* Real Estate enters top 5, replacing Health Care; Consumer Staples, Utilities, and Financials remain stable in top 3 positions.
* Defensive positioning has put a dent in portfolio performance after strong week.
Real Estate and Healthcare Swapping Positions...
READ MORE
MEMBERS ONLY

Top Stock Areas After the Rally: What Smart Money Is Buying
by Mary Ellen McGonagle,
President, MEM Investment Research
In this video, after last week's sharp market rally, Mary Ellen breaks down where the markets stand now, which leading sectors are showing the most strength, and how to recognize if your stocks are entering a new uptrend. Get expert insights on market leadership, sector rotation, and key...
READ MORE
MEMBERS ONLY

Hidden Gems: Bullish Patterns Emerging in These Country ETFs
by Joe Rabil,
President, Rabil Stock Research
In this video, Joe highlights key technical setups in select country ETFs that are showing strength right now. He analyzes monthly and weekly MACD, ADX, and RSI trends that are signaling momentum shifts. Joe also reviews the critical level to watch on the S&P 500 (SPX), while breaking...
READ MORE
MEMBERS ONLY

$4,000 Gold? Analysts Eye New Highs on Inflation and Geopolitical Risk
by Karl Montevirgen,
The StockCharts Insider
KEY TAKEAWAYS
* The price of gold is climbing on safe-haven demand, with key support levels mapped for potential entry.
* The U.S. dollar is sliding as speculation grows over whether its weakness is part of a larger strategy.
* Bitcoin is testing resistance and could rally further if safe-haven flows accelerate....
READ MORE
MEMBERS ONLY

DP Trading Room: Long-Term Outlook for Bonds
by Erin Swenlin,
Vice President, DecisionPoint.com
The market continued to slide lower today as the bear market continues to put downside pressure on stocks in general. Bonds and Yields are at an inflection point as more buyers enter the Bond market which is driving treasury yields higher. What is the long-term outlook for Bonds? Carl gives...
READ MORE
MEMBERS ONLY
The Best Five Sectors, #16
by Julius de Kempenaer,
Senior Technical Analyst, StockCharts.com
KEY TAKEAWAYS
* Consumer staples and utilities continue to lead sector rankings.
* Defensive sectors are showing strength in both weekly and daily RRGs.
* Health care struggling, but maintains position in top 5
* RRG portfolio slightly underperforming S&P 500 YTD, but gap narrowing.
Top 5 Remains Unchanged
The latest sector...
READ MORE
MEMBERS ONLY

Equities? Fuhgeddaboudit! Alternative Assets are Leading
by Arthur Hill,
Chief Technical Strategist, TrendInvestorPro.com
KEY TAKEAWAYS
* A simple ranking shows leadership in alterative assets and commodities.
* Stocks are not the place to be because the vast majority are below their 200-day SMAs.
* Bitcoin is holding up relatively well as it sets up with a classic corrective pattern.
Trading is all about the odds. Trade...
READ MORE
MEMBERS ONLY

When in Doubt, Follow the Leadership
by David Keller,
President and Chief Strategist, Sierra Alpha Research
KEY TAKEAWAYS
* The Consumer Discretionary sector has underperformed the Consumer Staples sector since February, indicating defensive positioning for investors.
* The Relative Rotation Graphs (RRG) show a clear rotation from "things you want" to "things you need" as investors fear weakening economic conditions.
* We remain focused on...
READ MORE
MEMBERS ONLY
The Best Five Sectors, #15
by Julius de Kempenaer,
Senior Technical Analyst, StockCharts.com
KEY TAKEAWAYS
* The entire top 5 has now changed positions.
* All defensive sectors are now in the top 5, while Healthcare has reentered.
* Portfolio is now lagging S&P 500.
Healthcare Re-Enters the Top 5
After a wild week in the markets, the sector ranking got quite a shake-up....
READ MORE
MEMBERS ONLY

Market Rally or Fakeout? How Politics and Earnings Are Driving Stocks
by Mary Ellen McGonagle,
President, MEM Investment Research
Stock market rally, sector rotation, and earnings movers dominate this week's analysis with Mary Ellen McGonagle. In this video, Mary Ellen reviews where the market stands after last week's bounce and explains how White House activity drove major price action.
Mary Ellen also highlights two top-performing...
READ MORE
MEMBERS ONLY

This Report Might Self Destruct in 5 Days
by Arthur Hill,
Chief Technical Strategist, TrendInvestorPro.com
KEY TAKEAWAYS
* With fast-moving markets, this report is vulnerable to self-destruction within 5 days.
* The bond vigilantes sent a message as long-term yields surged and bonds plunged.
* Unless reversed, these developments are negative for stocks, especially rate sensitive stocks.
In the opening scene of Mission Impossible 2, Ethan Hunt receives...
READ MORE
MEMBERS ONLY
Key Levels for the S&P 500: Has It Bottomed?
by Joe Rabil,
President, Rabil Stock Research
Is the stock market on the verge of crashing or has it bottomed?
In this video, Joe Rabil uses moving averages and Fibonacci retracement levels on a longer-term chart of the S&P 500 to identify support levels that could serve as potential bottoms for the current market correction....
READ MORE
MEMBERS ONLY

The Best Five Sectors, #14
by Julius de Kempenaer,
Senior Technical Analyst, StockCharts.com
KEY TAKEAWAYS
* Consumer Staples replaces Healthcare in top 5
* More defensive rotation underway
* RRG portfolio remains in line with market performance
This article was first posted on 4/4/2025 and contained only rankings and charts. Then updated with comments 4/7/2025
I am attending and speaking at the...
READ MORE
MEMBERS ONLY

Market Drop Compared to 2020: What You Need to Know Now
by Mary Ellen McGonagle,
President, MEM Investment Research
How low can the S&P and the Nasdaq fall? More importantly, how can an investor navigate this volatile environment?
In this eye-opening video, Mary Ellen McGonagle delves into the stock market's fall, identifies key support levels, and compares them to past bear markets. She also discusses...
READ MORE
MEMBERS ONLY

Three Defensive Plays for Post-Tariff Survival
by David Keller,
President and Chief Strategist, Sierra Alpha Research
KEY TAKEAWAYS
* Kroger remains in a primary uptrend of higher highs and higher lows, a rare feature for S&P 500 members in April 2025.
* Keurig Dr Pepper has overcome gap resistance and now demonstrates strong technical characteristics.
* The Utilities sector has show improving relative strength in 2025, outperforming...
READ MORE
MEMBERS ONLY

Top 10 Stock Charts for April 2025: Big Breakouts Ahead?
by David Keller,
President and Chief Strategist, Sierra Alpha Research

by Grayson Roze,
Chief Strategist, StockCharts.com
Finding stocks that show promising opportunities can be challenging in a market that goes up and down based on news headlines. But, it's possible.
In this video, watch how Grayson Roze and David Keller, CMT use the tools available in StockCharts to find stocks that are breaking out,...
READ MORE
MEMBERS ONLY
The Best Five Sectors, #13
by Julius de Kempenaer,
Senior Technical Analyst, StockCharts.com
KEY TAKEAWAYS
* Financials jump to #1 spot in S&P 500 sector rankings.
* Three sectors now in leading quadrant on weekly RRG
* Only Tech and Consumer Discretionary showing negative RRG headings
* RRG portfolio outperforming S&P 500 YTD by 10 basis points
Financials take the lead.
No changes...
READ MORE
MEMBERS ONLY

Performance Profile Paints Different Pictures for Commodity and Equity ETFs
by Arthur Hill,
Chief Technical Strategist, TrendInvestorPro.com
KEY TAKEAWAYS
* Among equity ETFs, non-cyclical groups are holding up the best.
* Cyclical names have the most pronounced downtrends.
The performance profile for 2025 says a lot about the state of the market. Commodity-related ETFs are leading, non-cyclical equity ETFs are holding up the best and cyclical names are performing...
READ MORE
MEMBERS ONLY
The Best Five Sectors, #12
by Julius de Kempenaer,
Senior Technical Analyst, StockCharts.com
KEY TAKEAWAYS
* Energy sector jumps to position #2 in top 5
* Consumer Staples drops out of portfolio
* Communication Services remains at #1 spot
* Modest pick up of relative momentum for XLK and XLY not enough yet
Energy Jumps to #2
A big move for the energy sector last week as...
READ MORE
MEMBERS ONLY

Will QQQ Retest All-Time Highs By End of April?
by David Keller,
President and Chief Strategist, Sierra Alpha Research
After reaching an all-time around $540 in mid-February, the Nasdaq 100 ETF (QQQ) dropped almost 14% to make a new swing low around $467. With the S&P 500 and Nasdaq bouncing nicely this week, investors are struggling to differentiate between a bearish dead-cat bounce and a bullish full...
READ MORE
MEMBERS ONLY

The Ultimate Guide to Building a Sector-Diversified Stock Portfolio
by Karl Montevirgen,
The StockCharts Insider
KEY TAKEAWAYS
* Building a diversified portfolio takes a lot of planning, but it doesn't have to be complicated.
* Diversification helps you manage risk, though it can't eliminate it entirely.
* StockCharts has all the tools you need to construct a sector-diversified portfolio.
You already know about diversification....
READ MORE
MEMBERS ONLY

Stock Market Shifts Gears: Indexes Plunge After Climb
by Jayanthi Gopalakrishnan,
Director of Site Content, StockCharts.com
KEY TAKEAWAYS
* The broader stock market indexes break their two day winning streak.
* Gold prices hit a new all-time high.
* European stocks are in a solid uptrend.
Tuesday's stock market action marked a reversal in investor sentiment, with the broader indexes closing lower. The S&P 500...
READ MORE
MEMBERS ONLY

Riding the Wave: What the Stock Market Rebound Means for Your Investments
by Jayanthi Gopalakrishnan,
Director of Site Content, StockCharts.com
KEY TAKEAWAYS
* The stock market indexes rebounded with Real Estate, Energy, and Consumer Staples leading.
* Retail sales data for February were slightly below expectations but better than January's data.
* Investors are looking forward to Wednesday's FOMC meeting to hear what the committees thoughts are on economic...
READ MORE
MEMBERS ONLY
The Best Five Sectors, #11
by Julius de Kempenaer,
Senior Technical Analyst, StockCharts.com
KEY TAKEAWAYS
* At the moment, we're seeing a big shakeup in sector rankings.
* Healthcare has entered the top five.
* Technology is dropping to last position.
* All defensive sectors are now in the top five.
Big Moves in Sector Ranking
The ranking of US sectors continues to shift. At...
READ MORE
MEMBERS ONLY

Three Reasons to Consider Gold
by David Keller,
President and Chief Strategist, Sierra Alpha Research
KEY TAKEAWAYS
* Gold has dramatically outperformed the S&P 500 and Nasdaq in 2025.
* Gold prices remain in a primary uptrend, with our Market Trend Model reading bullish on all time frames.
* Gold stocks are outperforming physical gold, and could represent a "catch up" trade going into...
READ MORE