MEMBERS ONLY
Is a New Market Uptrend Starting? Key Signals & Trading Strategies

by Mary Ellen McGonagle,
President, MEM Investment Research
Is a new market uptrend on the horizon? In this video, Mary Ellen breaks down the latest stock market outlook, revealing key signals that could confirm a trend reversal. She dives into sector rotation, explains why defensive stocks are losing ground, and shares actionable short-term trading strategies for oversold stocks....
READ MORE
MEMBERS ONLY
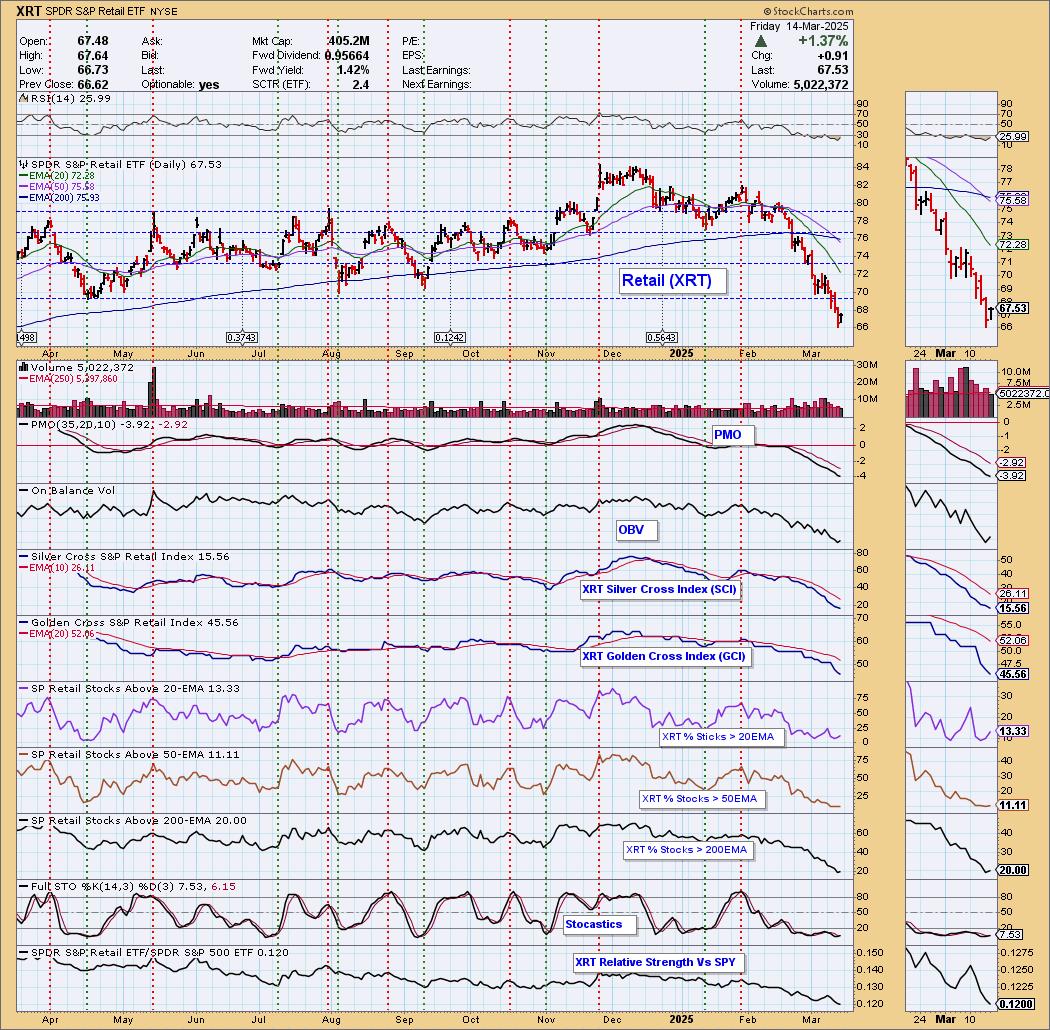
Retail (XRT) Dropping Quickly

by Erin Swenlin,
Vice President, DecisionPoint.com
It's been rocky for the S&P 500 and particularly rocky for some industry groups and sectors. The market does appear ready to give us a good bounce, but past that we aren't overly bullish.
Tariff talk has really pummeled the Retail (XRT) industry group...
READ MORE
MEMBERS ONLY
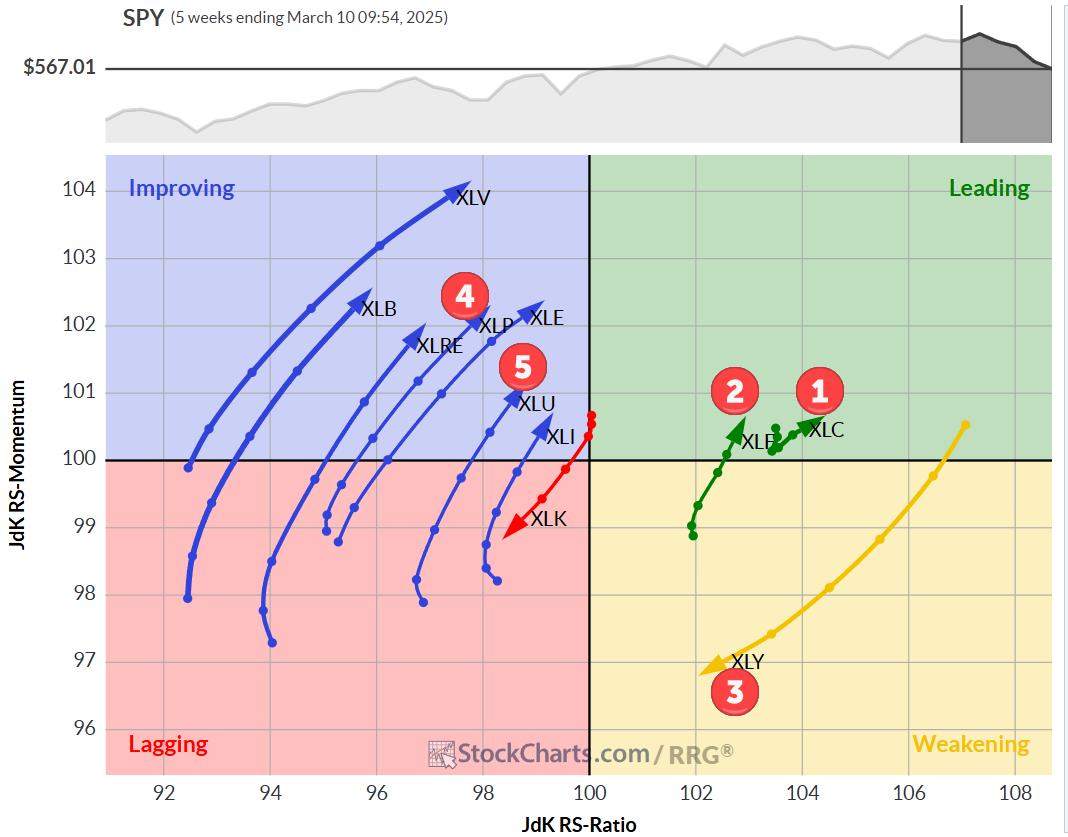
The Best Five Sectors, #10

by Julius de Kempenaer,
Senior Technical Analyst, StockCharts.com
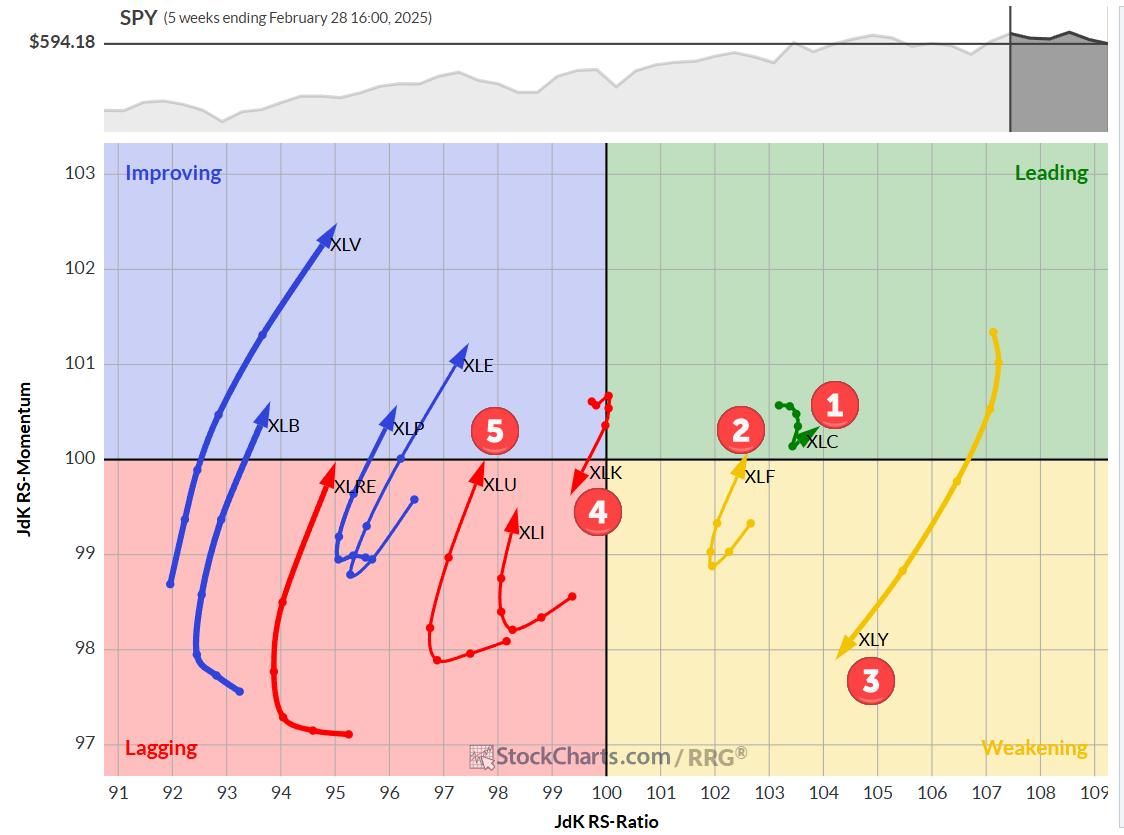
KEY TAKEAWAYS
* Communication Services (XLC) maintains top spot, Tech (XLK) plummets
* Shift towards defensive sectors evident in rankings
* Consumer Discretionary (XLY) showing signs of weakness
* Portfolio slightly outperforming SPY benchmark
Sector Shake-Up: Defensive Moves and Tech's Tumble
Last week's market volatility stirred up the sector rankings,...
READ MORE
MEMBERS ONLY

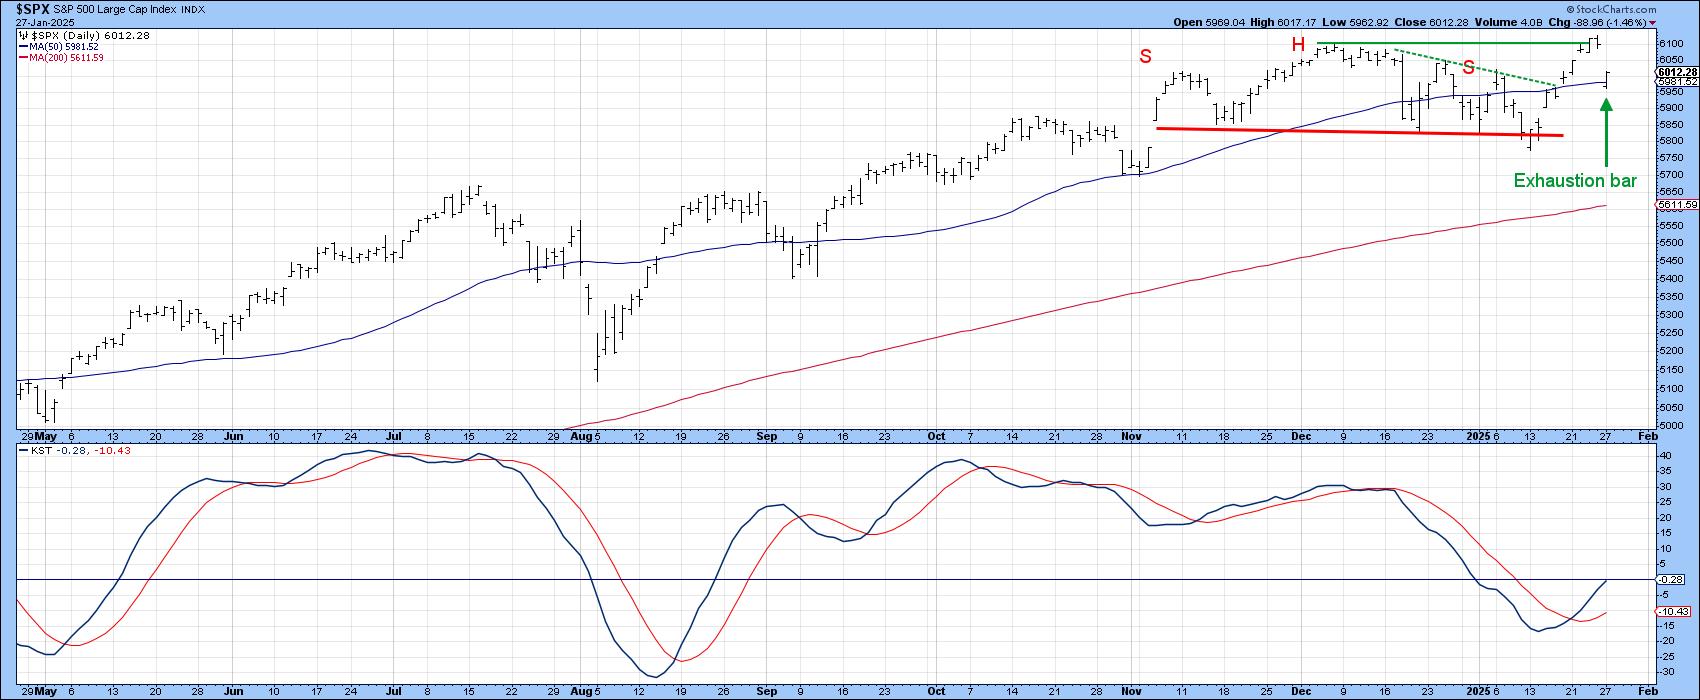
My Downside Target for the S&P 500

by David Keller,
President and Chief Strategist, Sierra Alpha Research
KEY TAKEAWAYS
* Once our "line in the sand" of SPX 5850 was broken, that confirmed a likely bear phase for stocks.
* We can use Fibonacci Retracements to identify a potential downside objective based on the strength of the previous bull trend.
* A confirmed sell signal from the Newer...
READ MORE
MEMBERS ONLY
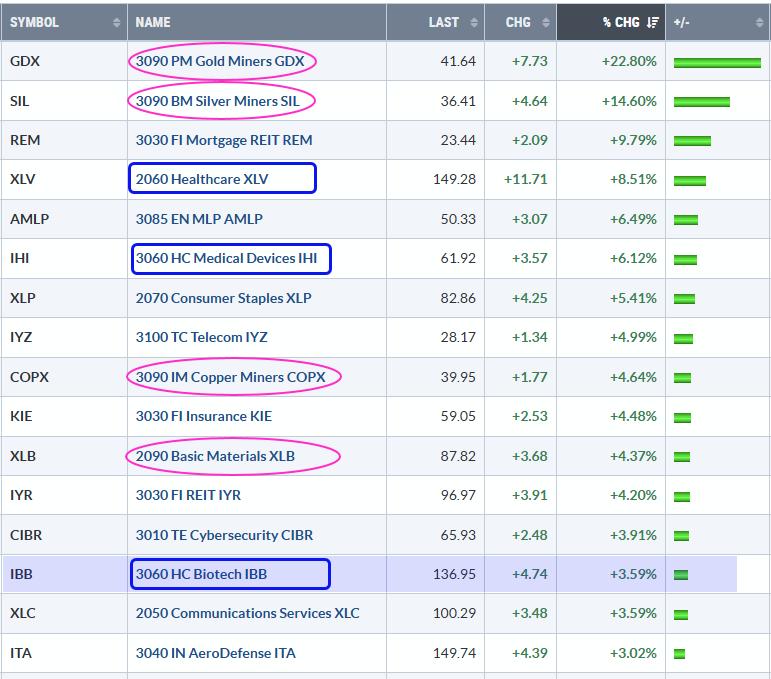
Commodity and Healthcare Related ETFs Lead in 2025 - Bullish Breakout in Biotechs

by Arthur Hill,
Chief Technical Strategist, TrendInvestorPro.com
KEY TAKEAWAYS
* 2025 is off to a rough start with SPY, QQQ and IWM sporting losses.
* ETFs with gains are bucking the market by showing relative and absolute strength.
* The Biotech ETF broke out in January and is battling its breakout zone.
2025 is off to a rough start for...
READ MORE
MEMBERS ONLY
The Best Five Sectors, #9
by Julius de Kempenaer,
Senior Technical Analyst, StockCharts.com
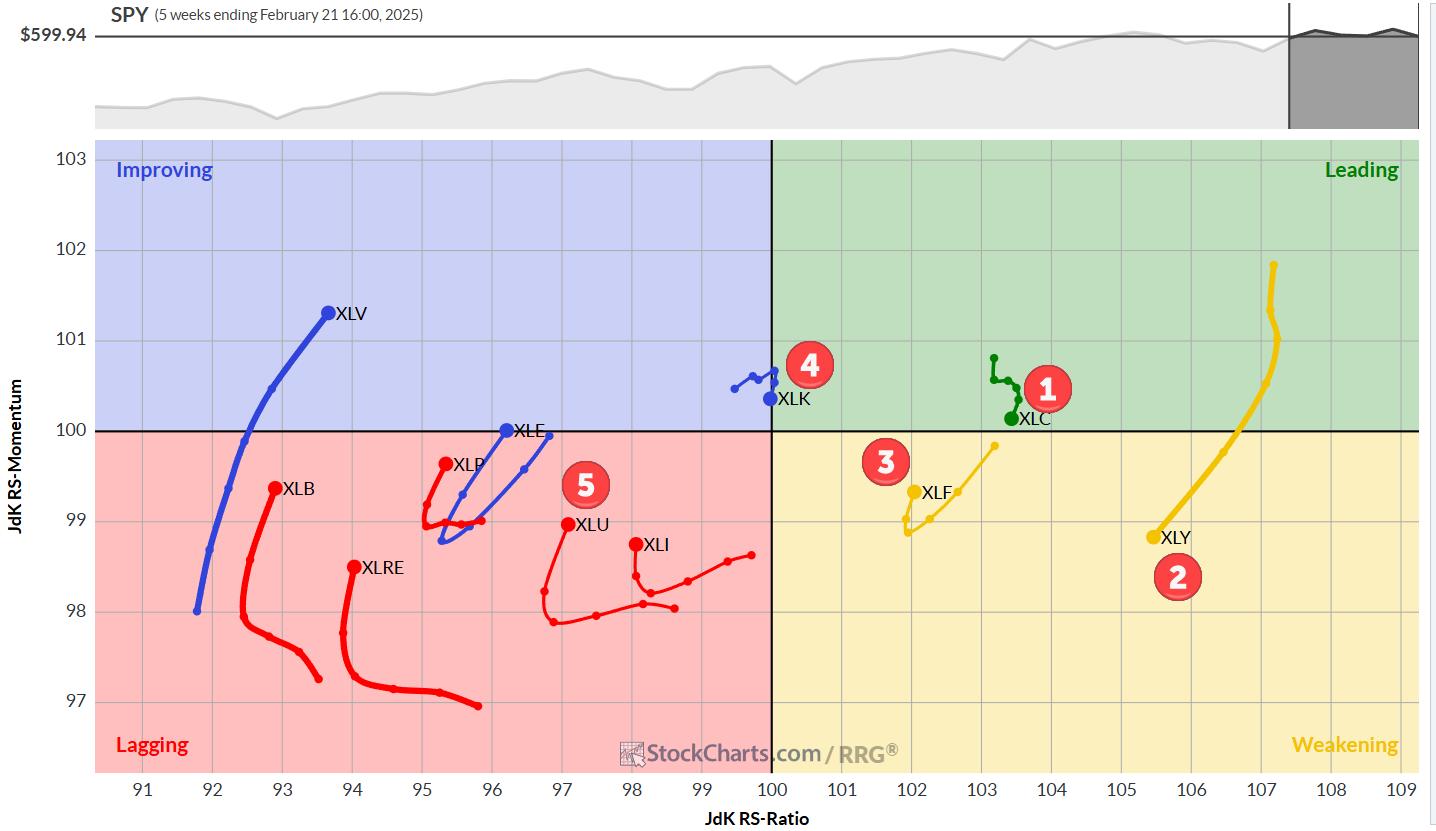
KEY TAKEAWAYS
* Communication services maintains top spot in sector ranking.
* Financials moves up to #2, pushing consumer discretionary down to #3.
* Technology and utilities hold steady at #4 and #5 respectively.
* Portfolio performance now on par with benchmark after recent outperformance.
Sector Rotation: Financials Climb as Consumer Discretionary Slips
While...
READ MORE
MEMBERS ONLY

Growth Stocks Tumbling; Where to Find Safe Havens Now!
by Mary Ellen McGonagle,
President, MEM Investment Research
Growth stocks just took a sharp hit—what does it mean for the market? In this video, Mary Ellen breaks down the impact, reveals why NVDA could soar higher, and highlights safer stocks with strong upside potential!
This video originally premiered February 28, 2025. You can watch it on our...
READ MORE
MEMBERS ONLY

Small-caps Trigger Bearish, but Large-caps Hold Uptrend and Present an Opportunity
by Arthur Hill,
Chief Technical Strategist, TrendInvestorPro.com
KEY TAKEAWAYS
* Long-term Keltner Channels are trend-following indicators that identify volatility breakouts.
* The Russell 2000 ETF triggered bearish this week and reversed a 14 month uptrend.
* The S&P 500 SPDR remains within an uptrend and the current pullback is an opportunity.
The Russell 2000 ETF triggered a bearish...
READ MORE
MEMBERS ONLY

Retail is at a Crossroads—Buy Now or Stay Away?

by Karl Montevirgen,
The StockCharts Insider
KEY TAKEAWAYS
* The retail sector has been trading sideways for almost three years.
* Wall Street sees moderate growth for retail in 2025.
* Retail may be presenting both swing trading and position trading opportunities right now.
As "economic softening" increasingly emerges as the prevailing narrative driving the markets, the...
READ MORE
MEMBERS ONLY
The Best Five Sectors, #8
by Julius de Kempenaer,
Senior Technical Analyst, StockCharts.com
KEY TAKEAWAYS
* Utilities entering the top-5
* Industrials dropping out of top-5 portfolio
* Real-Estate and Energy swapping positions in bottom half of the ranking
* Perfomance now 0.3% below SPY since inception.
Utilities enter top 5
Last week's trading, especially the sell-off on Friday, has caused the Utilities sector...
READ MORE
MEMBERS ONLY

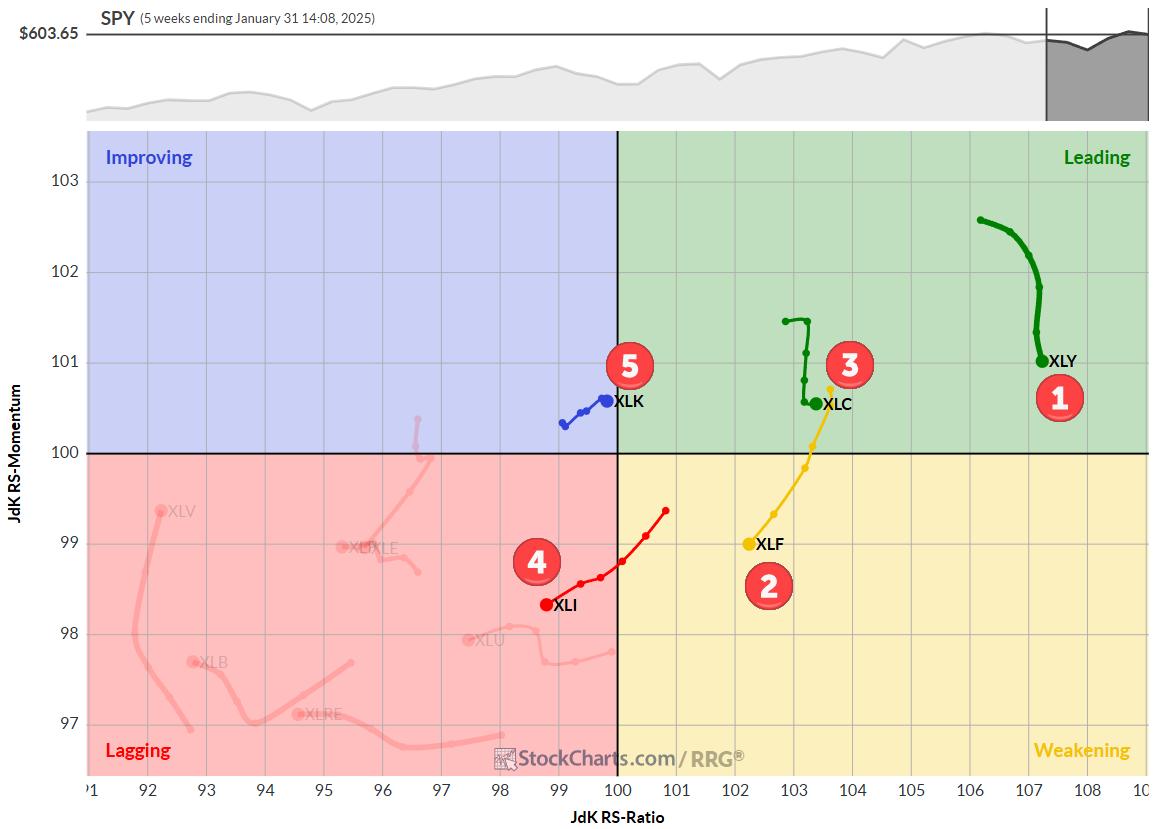
Market Rotation and Cap-Weight Dynamics: A Closer Look
by Julius de Kempenaer,
Senior Technical Analyst, StockCharts.com
KEY TAKEAWAYS
* Large cap growth stocks regaining favor as market faces pressure
* Cap-weighted sectors outperforming equal-weighted counterparts
* S&P 500 struggling to break above 610, suggesting potential trading range
* Exceptions in mega-cap dominated sectors (Communication Services, Technology, Consumer Discretionary)
With the market selling off into the close today, it&...
READ MORE
MEMBERS ONLY

Gold and Silver Are Crushing the S&P 500! Here's What You Need To Know Now!
by Karl Montevirgen,
The StockCharts Insider
KEY TAKEAWAYS
* Gold and silver are crushing the commodities markets and the S&P 500.
* Gold is hitting record highs, fueled by sentiment and speculation.
* Consider the key levels to watch for investment opportunities in gold and silver.
There's been a lot of wild speculation surrounding gold&...
READ MORE
MEMBERS ONLY

Unleash the Power of BPI: The Key to Boosting Your Investment Returns

by Jayanthi Gopalakrishnan,
Director of Site Content, StockCharts.com
KEY TAKEAWAYS
* Market breadth is improving in some stock market sectors.
* Monitoring the Bullish Percent Index (BPI) can help you strategize your investments.
* The broader stock market indexes are still bullish.
On Wednesday, the Federal Reserve released minutes from its January 28–29 meeting. There weren't any surprises...
READ MORE
MEMBERS ONLY
The Best Five Sectors, #7
by Julius de Kempenaer,
Senior Technical Analyst, StockCharts.com
KEY TAKEAWAYS
* Communication services (XLC) claims the top spot, pushing consumer discretionary (XLY) to second place
* Technology (XLK) shows strength, moving up to fourth and displacing industrials (XLI)
* Industrials displaying weakness, at risk of dropping out of the top five
* RRG portfolio outperforming SPY benchmark by 69 basis points
Shifting...
READ MORE
MEMBERS ONLY

Stay Ahead of Tariffs: Essential Chart Analysis for Investment Security
by Jayanthi Gopalakrishnan,
Director of Site Content, StockCharts.com
KEY TAKEAWAYS
* The stock market has been trading sideways for an extended period.
* Tariffs, deregulation, inflation, and tax cuts are likely to occupy investors' minds for the next few years.
* Monitor the charts of the broader stock market, inflation expectations, and industries that are likely to benefit from the...
READ MORE
MEMBERS ONLY

Stash that Flash Right in the Trash
by Arthur Hill,
Chief Technical Strategist, TrendInvestorPro.com
KEY TAKEAWAYS
* Price represents a distillation of all news, events and rumors.
* Our job is to set biases aside and focus on price action.
* Chartists should focus on uptrends, relative strength and bullish setups.
The news cycle is in high gear lately, leading to some extra volatility. Traders reacting to...
READ MORE
MEMBERS ONLY
The Best Five Sectors, #6
by Julius de Kempenaer,
Senior Technical Analyst, StockCharts.com
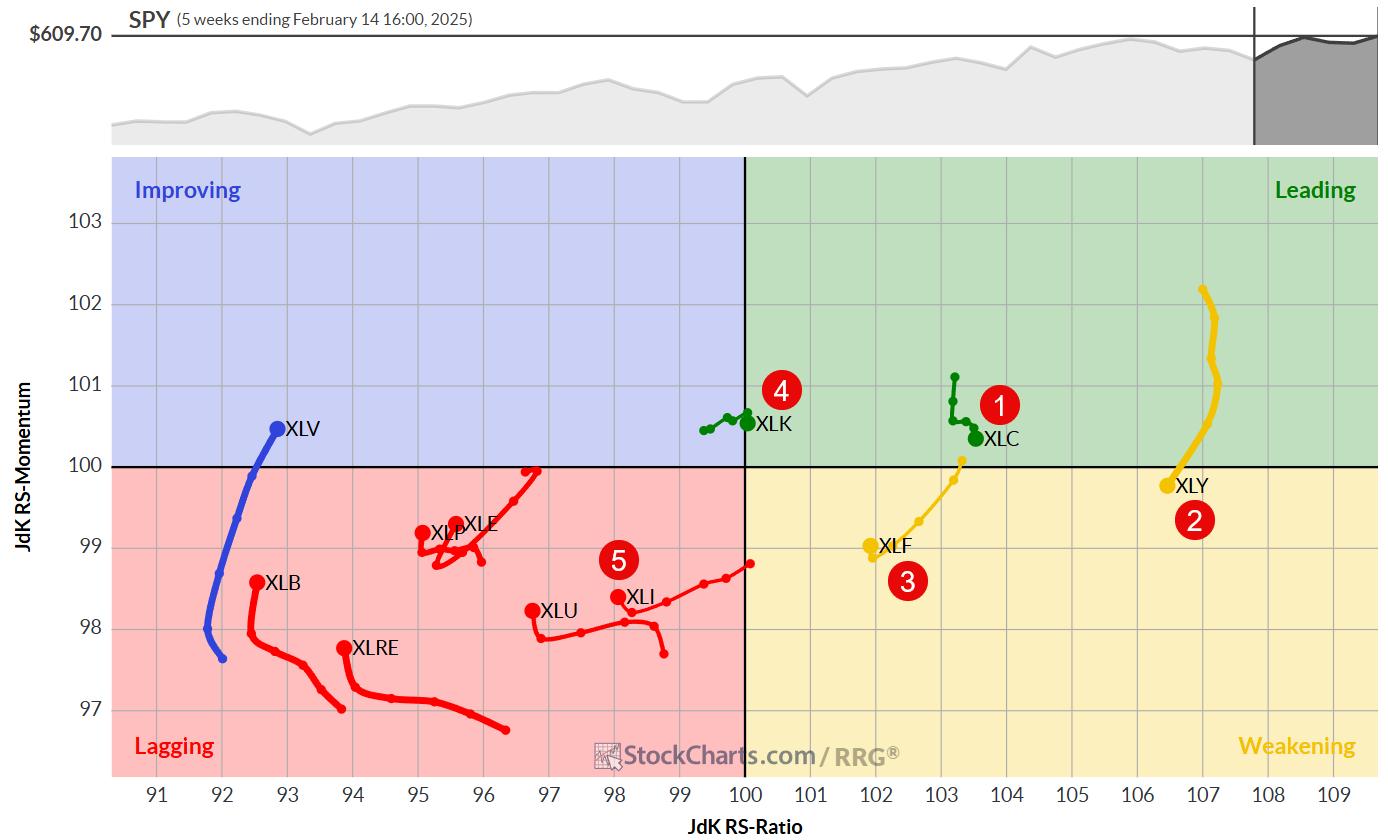
KEY TAKEAWAYS
* Top-5 remains unchanged
* Healthcare and Staples jump to higher positions
* Price and Relative trends remain strong for XLC and XLF
No Changes In Top-5
At the end of the week ending 2/7, there were no changes in the top-5, but there have been some significant shifts in...
READ MORE
MEMBERS ONLY
Nasdaq DROPS on Weak AMZN, TSLA & GOOGL Earnings!
by Mary Ellen McGonagle,
President, MEM Investment Research
In this video, Mary Ellen reviews the market's flat momentum as uncertainty reemerges after weak AMZN, TSLA and GOOGL reports - PLUS more tariff talk from Trump. She also highlights the move into defensive sectors as growth stocks continue to struggle. Lastly, she shares the top stocks that...
READ MORE
MEMBERS ONLY
Top 10 Charts to Watch for in February 2025
by David Keller,
President and Chief Strategist, Sierra Alpha Research
While the major equity averages are certainly up year-to-date, we're detecting a growing number of signs of leadership rotation. As the Magnificent 7 stocks have begun to falter, with charts like Apple Inc. (AAPL) taking on a less-than-magnificent luster in February, we've identified ten key stocks...
READ MORE
MEMBERS ONLY
DeepSeek Rattles AI Stocks - Should You Buy The Dip?
by Mary Ellen McGonagle,
President, MEM Investment Research
In this video, Mary Ellen unpacks the week after the news drop roiled markets; coupled with major earnings reports, it's been a rough week. She highlights what drove the biggest winners last week as we head into one of the busiest time for earnings!
This video originally premiered...
READ MORE
MEMBERS ONLY
The Best Five Sectors, #5
by Julius de Kempenaer,
Senior Technical Analyst, StockCharts.com
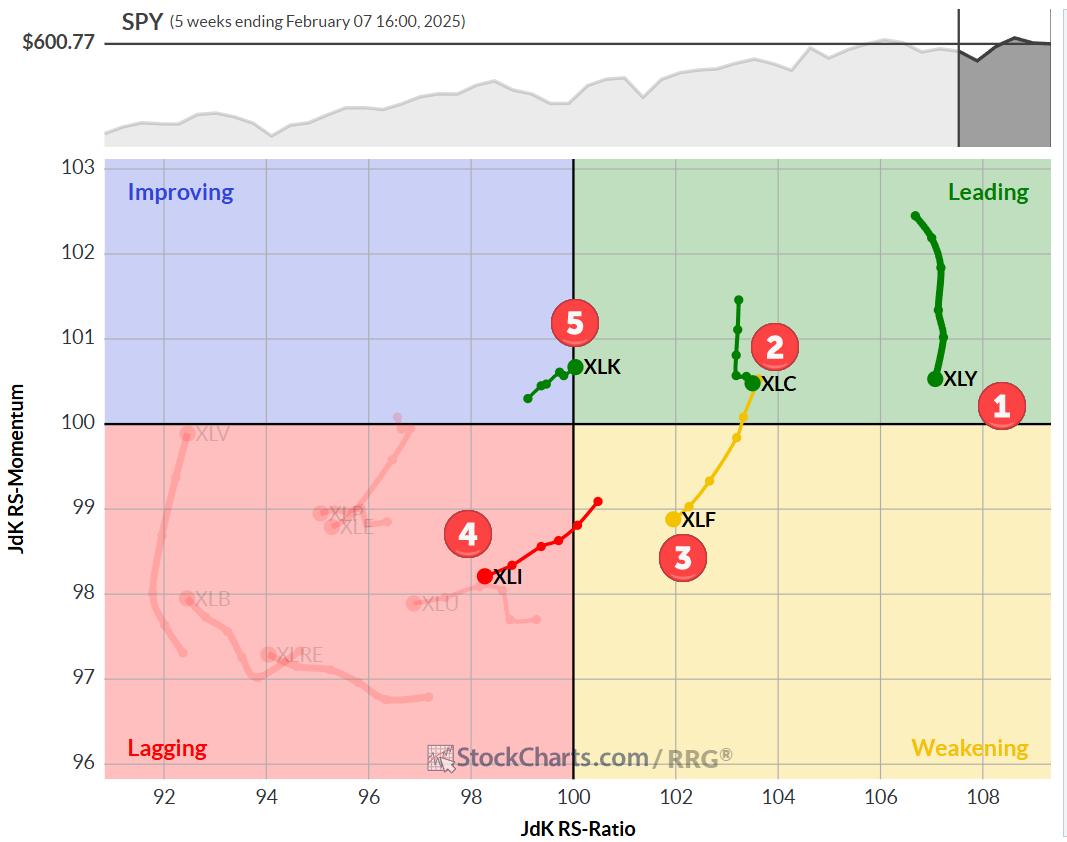
KEY TAKEAWAYS
* Technology (XLK) re-enters top 5 sectors, displacing Energy (XLE)
* Consumer Discretionary (XLY) maintains #1 position
* Weekly and daily RRGs show supportive trends for leading sectors XLY and XLC
* Top-5 portfolio outperforms S&P 500 by nearly 50 basis points
Technology Moves Back into Top-5
As we wrap...
READ MORE
MEMBERS ONLY

XLF's Record Highs: Buy the Dip or Bail Out Now?
by Karl Montevirgen,
The StockCharts Insider
KEY TAKEAWAYS
* XLF, heavily weighted in bank stocks, broke into all-time high territory, though conviction appears low.
* Breadth, momentum, and technical strength are leaning bullish.
* A likely pullback signals an opportunity for entry.
As the FOMC prepared to announce its rate decision on Wednesday, the Financial Select Sector SPDR Fund...
READ MORE
MEMBERS ONLY
Some Silver Linings Following a Day of AI Panic

by Martin Pring,
President, Pring Research
I woke up this morning noting that NASDAQ futures had been down nearly 1,000 points at their overnight intraday low. Later, I tuned into a couple of general purpose, as opposed to financial, cable news channels. They, too, were talking about the sell-off and its rationale. I began to...
READ MORE
MEMBERS ONLY

What's NEXT for Semiconductors After Monday's SHOCKING Drop?
by David Keller,
President and Chief Strategist, Sierra Alpha Research
In this video, Dave reviews the VanEck Semiconductor ETF (SMH) from a technical analysis perspective. He focuses on the recent failure at price gap resistance, the breakdown below price and moving average support, and the frequent appearance of bearish engulfing patterns which have often indicated major highs over the last...
READ MORE
MEMBERS ONLY
BEWARE! META, TSLA, AMZN, MSFT & AAPL Report Earnings Next Week!
by Mary Ellen McGonagle,
President, MEM Investment Research
In this video, Mary Ellen reviews the new uptrend in the S&P 500, and highlights what's driving it higher. She then shares new pockets of strength that are poised to take off, and what to be on the lookout for ahead of next week's...
READ MORE
MEMBERS ONLY
The Best Five Sectors, #4
by Julius de Kempenaer,
Senior Technical Analyst, StockCharts.com
KEY TAKEAWAYS
* No changes in top-5 sectors
* XLC showing strong break from consolidation flag
* XLE remains just barely above XLK as a result of strong daily RRG
No changes in the top-5
At the end of this week, there were no changes in the ranking of the top-5 sectors.
1....
READ MORE
MEMBERS ONLY
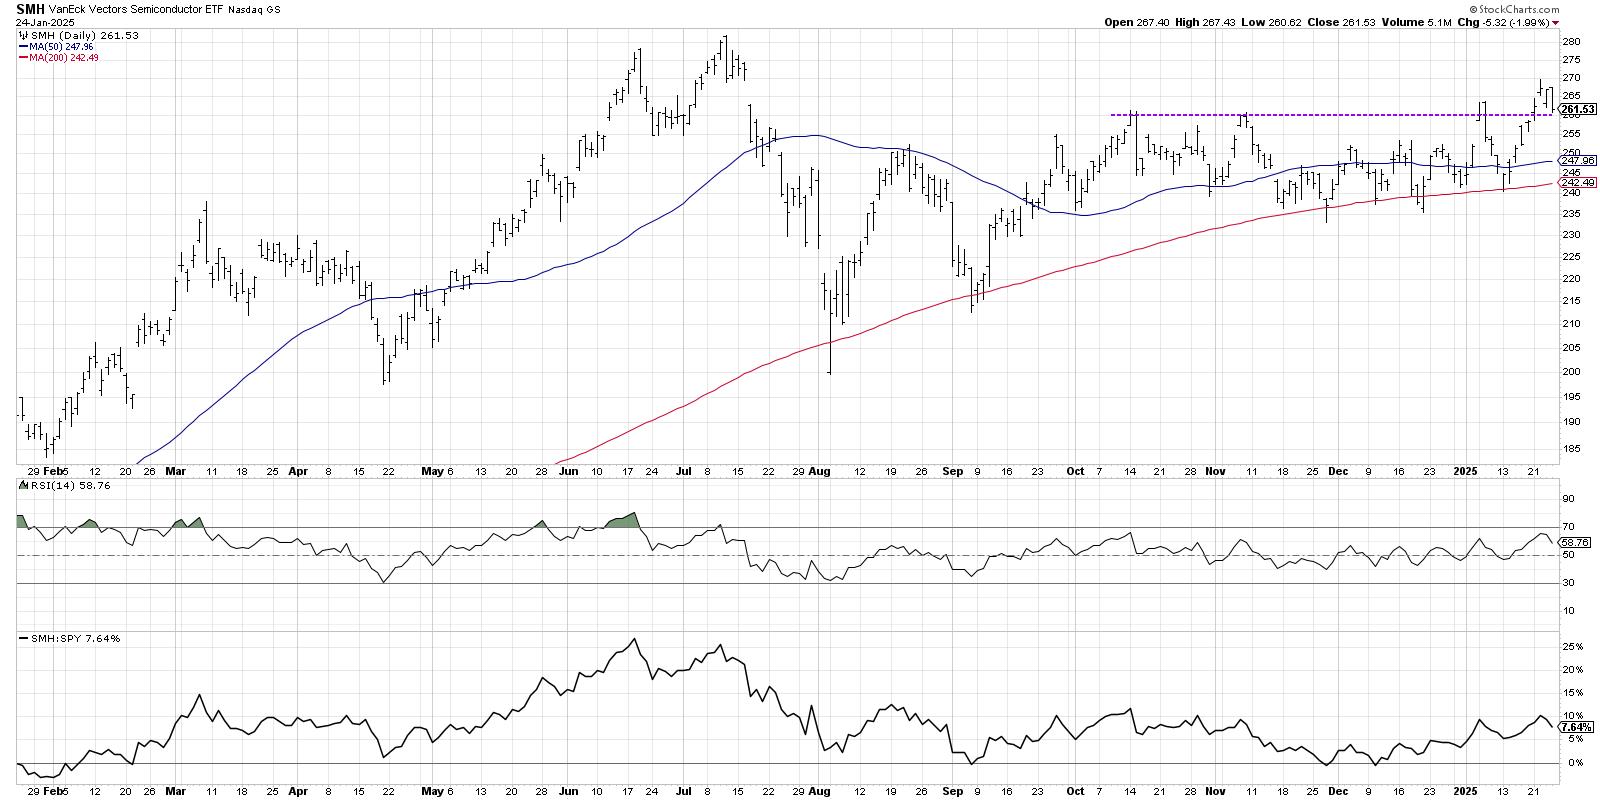
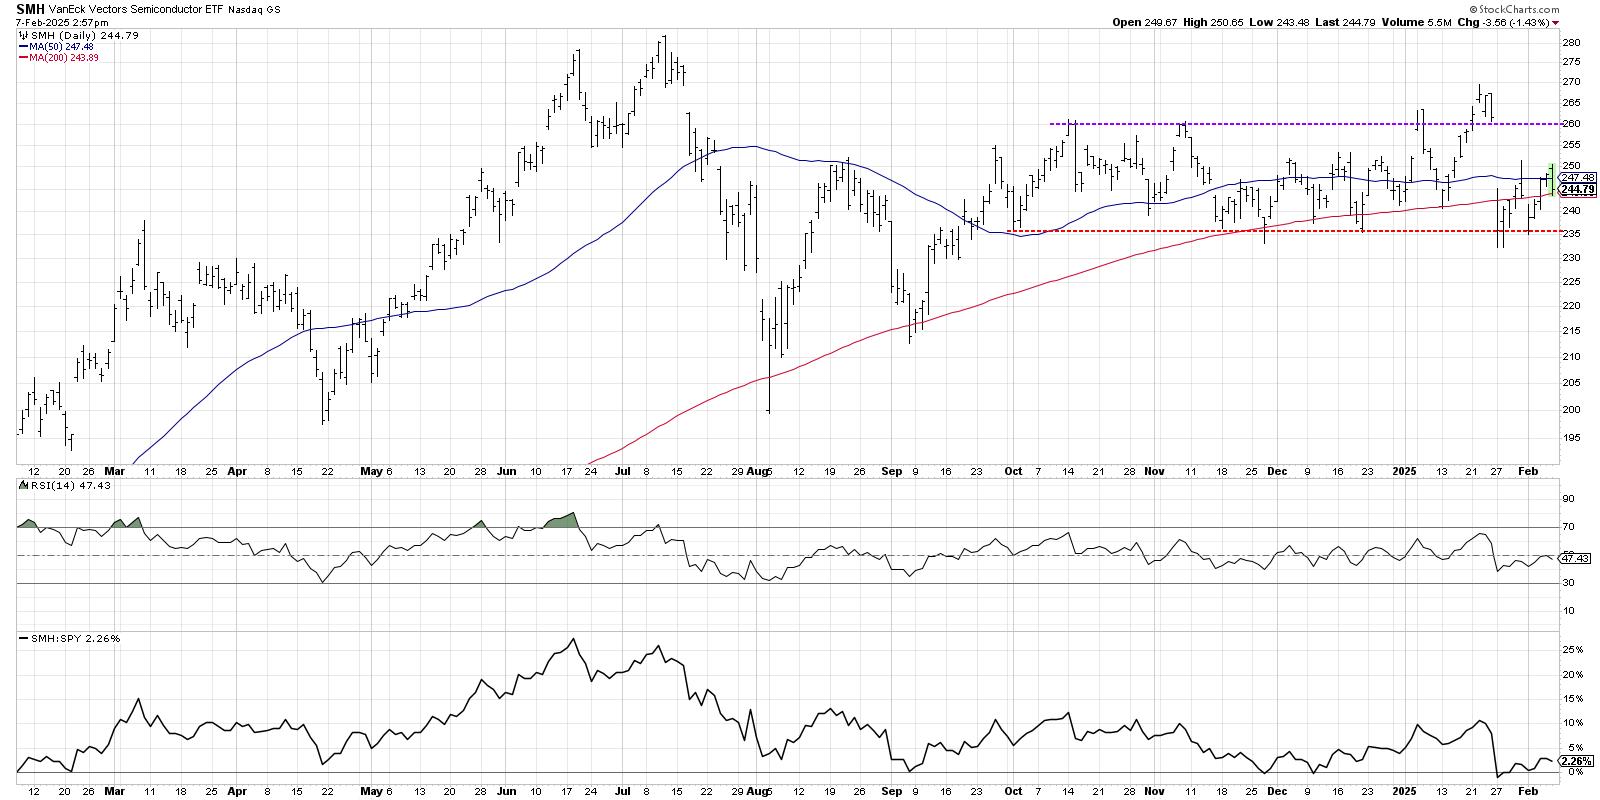
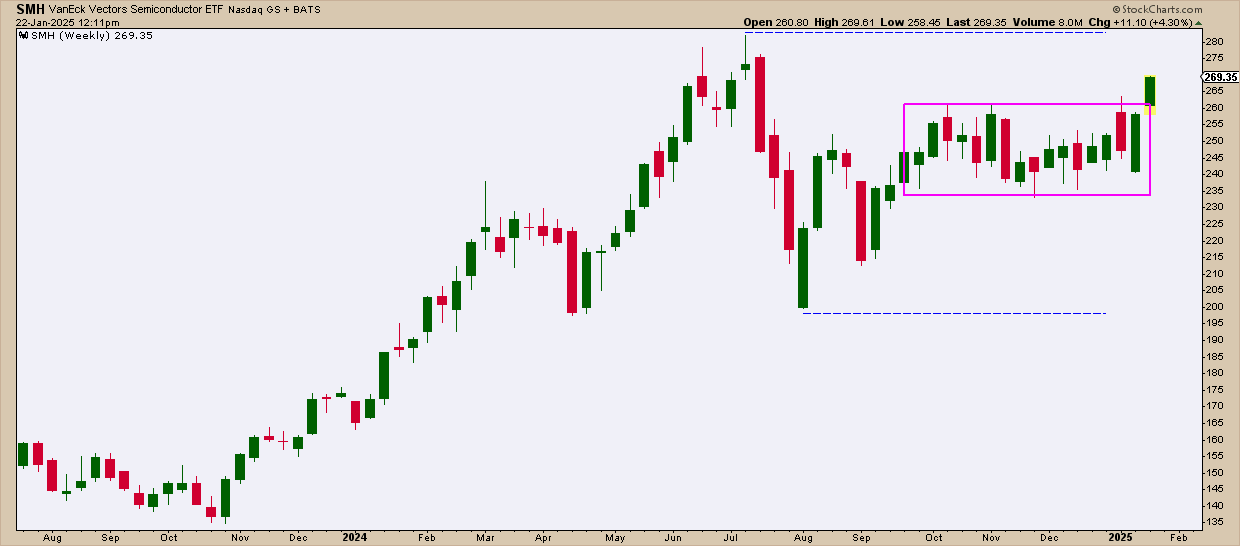
Semiconductors Have More to Prove Before Breakout is Believed
by David Keller,
President and Chief Strategist, Sierra Alpha Research
KEY TAKEAWAYS
* The VanEck Vectors Semiconductor ETF (SMH) broke out of a six-month base this week, suggesting further upside potential.
* While the breakout in SMH appears bullish, the ETF still has yet to eclipse a key price gap from July 2025.
* A bearish engulfing pattern to end the week indicates...
READ MORE
MEMBERS ONLY
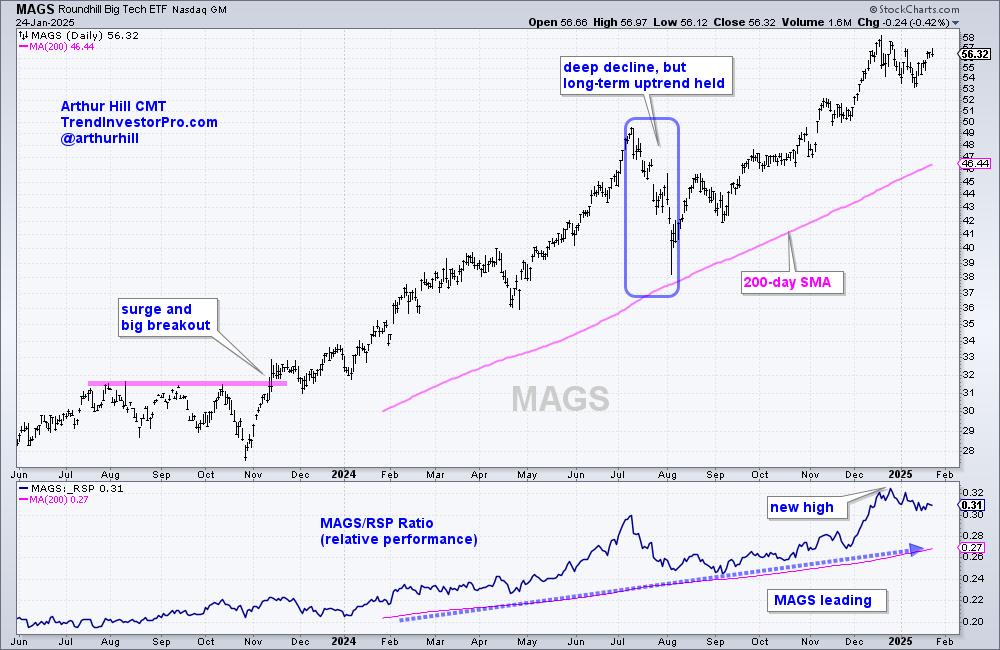
Mag7 ETF Leads as Bullish Pattern Forms - Charting the Trends and Trading Setups for the Mag7 Stocks
by Arthur Hill,
Chief Technical Strategist, TrendInvestorPro.com
KEY TAKEAWAYS
* The Mag7 ETF (MAGS) is outperforming the market and in a strong uptrend.
* MAGS broke out of a short-term bullish continuation pattern this week.
* Nvidia, Tesla, Amazon and Meta are powering MAGS higher.
The Mag7 ETF (MAGS) formed another short-term bullish continuation pattern as it worked its way...
READ MORE
MEMBERS ONLY

Biotechs Looking Up - Two Stocks To Take Advantage
by Erin Swenlin,
Vice President, DecisionPoint.com
The Biotech industry group is making a comeback, with the 'under the hood' chart displaying new strength coming into the group. We have a constructive bottom that price is breaking from and, while it does need to overcome resistance at the 200-day EMA, it looks encouraging. What was...
READ MORE
MEMBERS ONLY
NVDA, TSMC, and Broadcom: Top Semiconductor Plays as SMH Hits New Highs
by Karl Montevirgen,
The StockCharts Insider
KEY TAKEAWAYS
* SMH has broken out of its three-month trading range.
* Trump's $500 billion Stargate AI initiative has injected optimism into the sector, accelerating gains in AI-related semiconductor stocks.
* Monitor the key levels for Nvidia, Broadcom, and TSMC for buying opportunities.
In the last quarter of 2024, semiconductors...
READ MORE
MEMBERS ONLY
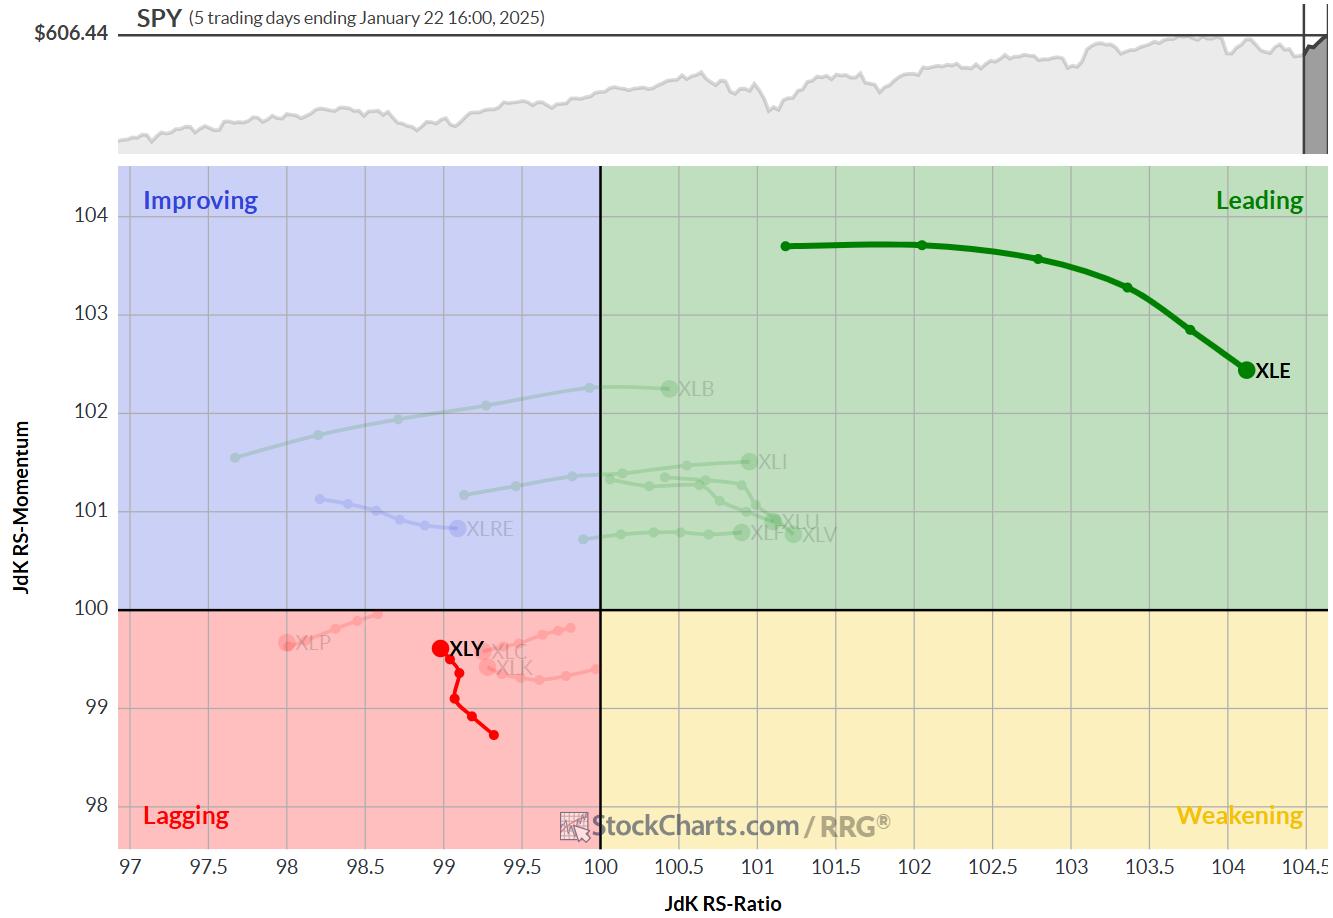
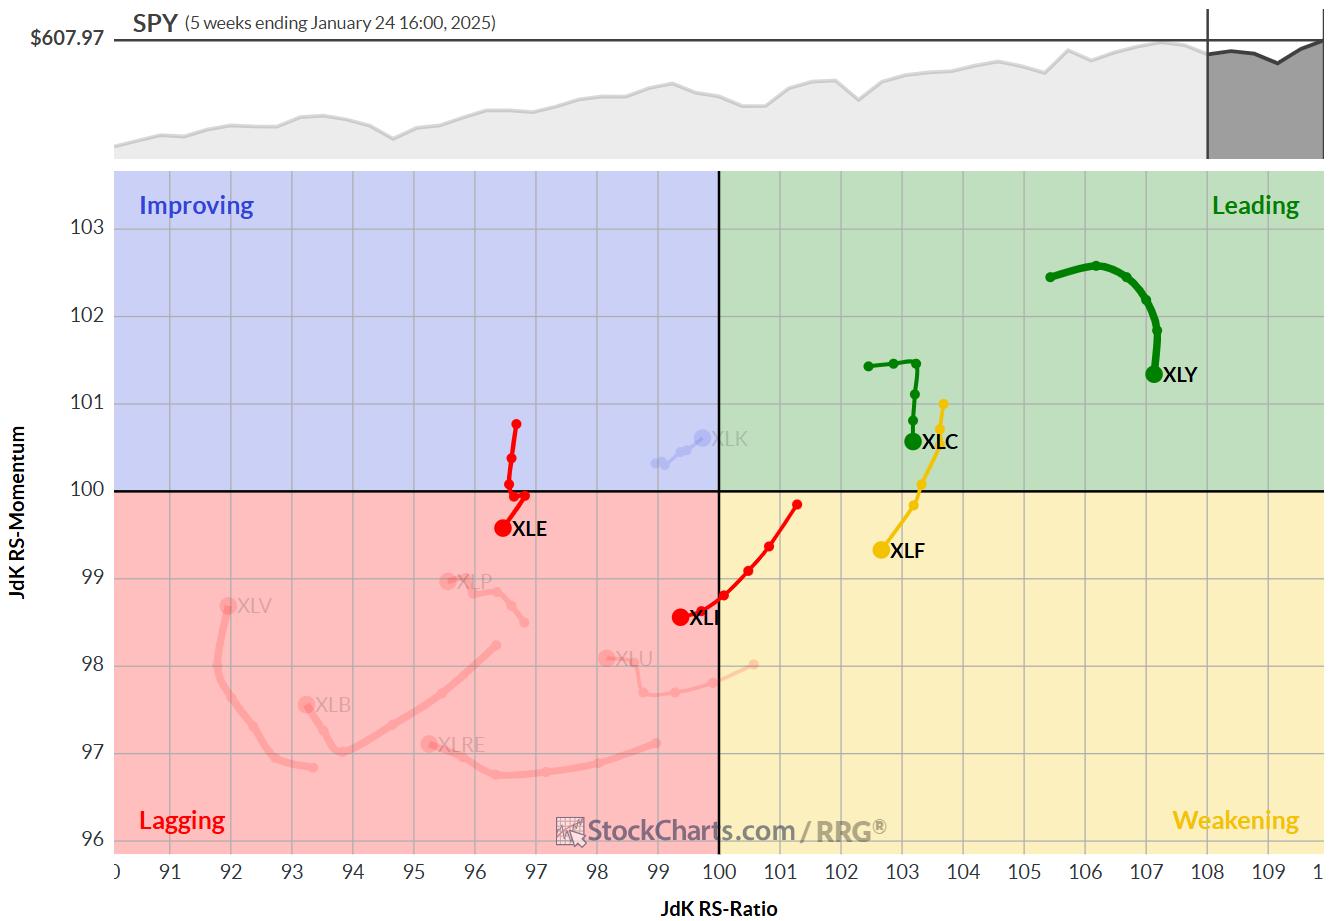
Energy Picks Up and Consumer Discretionary Continues to Lead
by Julius de Kempenaer,
Senior Technical Analyst, StockCharts.com
KEY TAKEAWAYS
* Short term strength drags enery sector up
* Long term strength keeps consumer discretionary on top
* Massive upside potential ready to get unlocked in EOG
I have been traveling in the US since 1/15 and attended the CMTA Mid-Winter retreat in Tampa, FL 1/16-1/17 and then...
READ MORE
MEMBERS ONLY

Market Internals Point to Large Growth Leadership
by David Keller,
President and Chief Strategist, Sierra Alpha Research
KEY TAKEAWAYS
* While the stronger US Dollar suggests caution for growth stocks, the ratios shows that growth continues to dominate value.
* While macro conditions appear beneficial for small cap stocks, large caps are back to a confirmed leadership role.
* Measures of offense vs. defensive suggest that investors are favoring offense...
READ MORE
MEMBERS ONLY

Stocks are Facing an Important Test
by Martin Pring,
President, Pring Research
I have been expecting a bull market correction for about a month, but it's not been as deep as I expected. Now, however, several indexes have completed small bullish two-bar reversal patterns on the weekly charts. If they work, that would be a characteristic of a bull market,...
READ MORE
MEMBERS ONLY

The Best Five Sectors, #3
by Julius de Kempenaer,
Senior Technical Analyst, StockCharts.com
KEY TAKEAWAYS
* Energy replaces Technology in top-5
* Financials rise to #2 position pushing XLC down to #3
* Top-5 portfolio out-performs SPY 0.52%
* A closer look at the (equal) weighting scheme
Energy Replaces Technology
At the end of this week, 1/17/2024, the Technology sector dropped out of the...
READ MORE
MEMBERS ONLY

What Would It Take For Small Caps to Lead?
by David Keller,
President and Chief Strategist, Sierra Alpha Research
KEY TAKEAWAYS
* Financials represent one of the top sector weights in the IWM, and banks have kicked off earnings season with renewed strength.
* A resurgence in biotech stocks, one of the largest industries represented in the IWM, could provide an upside catalyst.
* US Dollar strength could adversely impact mega cap...
READ MORE
MEMBERS ONLY

The Financial Sector's Bullish Comeback: Is It Time to Start Looking at Bank Stocks?
by Karl Montevirgen,
The StockCharts Insider
KEY TAKEAWAYS
* The Bullish Percentage Index for Financials made a dramatic jump on Wednesday.
* Positive bank earnings plus encouraging CPI and PPI data are driving market optimism.
* Citigroup stock notched a 52-week high, making the stock worth analyzing.
One effective way to spot potential market opportunities on a sector level...
READ MORE
MEMBERS ONLY

How to Find a BUY Signal Using The 1-2-3 Reversal Pattern

by Joe Rabil,
President, Rabil Stock Research
In this exclusive StockCharts video, Joe demonstrates how to use the 1-2-3 reversal pattern as a buy signal on the weekly chart. This approach can be used when the monthly chart is in a strong position. Joe shares how to use MACD and ADX to help when the trendline pattern...
READ MORE
MEMBERS ONLY

Investors Await CPI and Bank Earnings: Will They Spark Investor Optimism?
by Jayanthi Gopalakrishnan,
Director of Site Content, StockCharts.com
KEY TAKEAWAYS
* Broader stock market indexes are seeing a lot of choppy activity.
* December CPI and bank earnings are on deck and could move the markets.
* The interest rate-sensitive banking sector will be impacted by CPI and bank earnings.
The December Producer Price Index (PPI) came in cooler than expected,...
READ MORE
MEMBERS ONLY
The Bullish Case for Small Caps vs. Large Caps
by David Keller,
President and Chief Strategist, Sierra Alpha Research
Will small cap stocks finally take on a leadership role in 2025? In this video, Dave provides a thorough technical analysis discussion of the Russell 2000 ETF (IWM) and how that compares to the current technical configuration of the S&P 500 index. He also shares three charts he&...
READ MORE
MEMBERS ONLY

Gold Prices: De-Dollarization, Inflation, and $3,000 Gold—What You Need to Know Now
by Karl Montevirgen,
The StockCharts Insider
KEY TAKEAWAYS
* Central banks are accumulating gold at an increased pace which could increase the price of gold.
* While retail sentiment for gold may decline slightly, institutional accumulation remains steady.
* Compare gold futures with the ETF and look at the key levels, as a buying opportunity may be near.
Gold...
READ MORE