MEMBERS ONLY

Navigating Earnings: Three Stocks, Three Different Stories

by Jay Woods,
Chief Global Strategist, Freedom Capital Markets
KEY TAKEAWAYS
* Short-term traders may find an opportunity in Under Armour stock if the price breaks above key resistance.
* Walmart earnings could reveal how retail spending is trending.
* Alibaba's stock price sits in a volatile range with trade tensions and AI investments playing a critial role in its...
READ MORE
MEMBERS ONLY

The Best Five Sectors, #18

by Julius de Kempenaer,
Senior Technical Analyst, StockCharts.com
KEY TAKEAWAYS
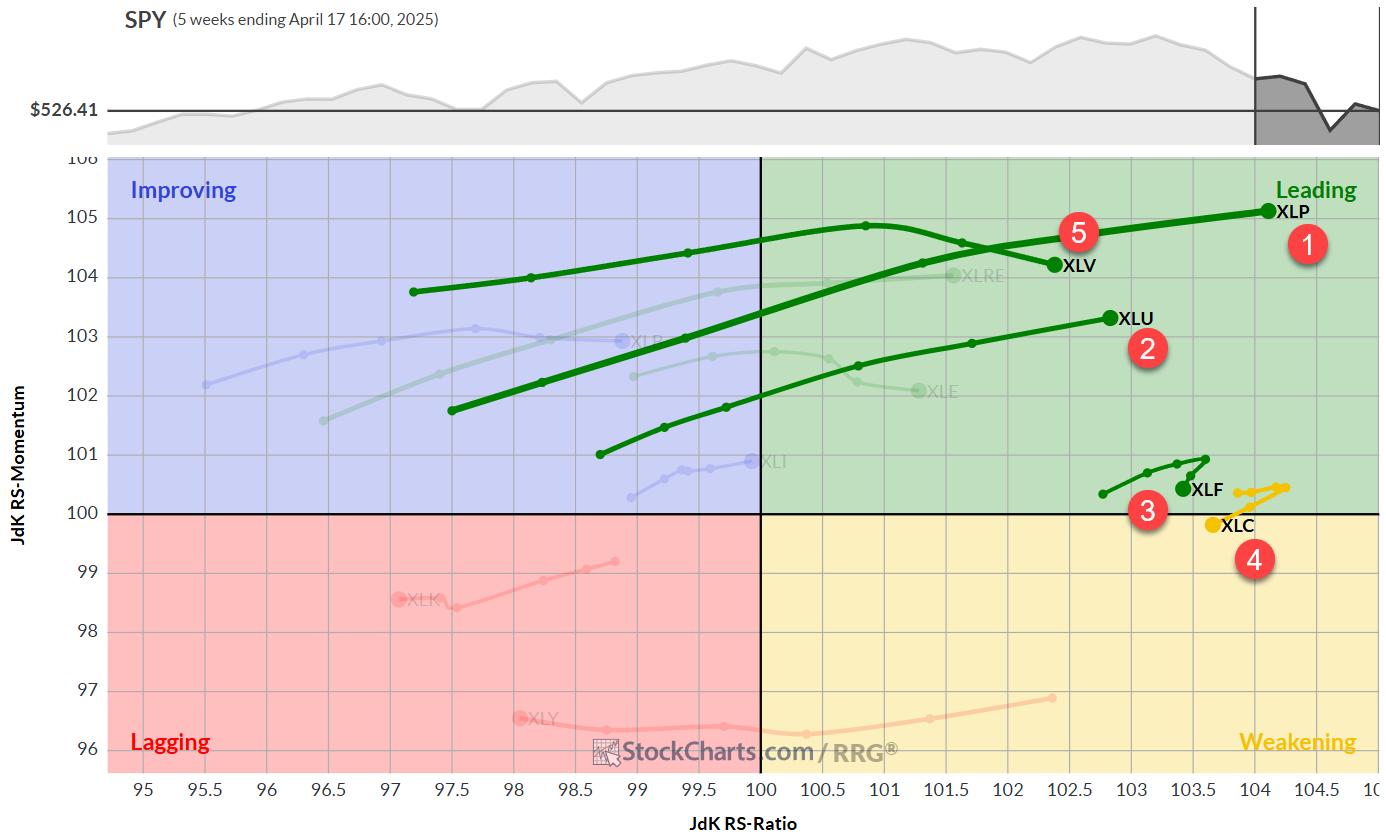
* All 11 sectors changed positions, but the top-5 / bottom-6 composition remained the same.
* Utilities now strongest sector, despite overall market strength.
* Communication Services jumped from 5th to 2nd place.
* Portfolio still 3% behind the S&P 500 YTD, unchanged from last week.
Sector Shuffle: Same Players, New...
READ MORE
MEMBERS ONLY

Recession Ahead? Sector Rotation Model Warns of Rising Risk
by Julius de Kempenaer,
Senior Technical Analyst, StockCharts.com
Is a recession coming? In this video, Julius breaks down the latest updates to his powerful Sector Rotation Model, analyzing four key macroeconomic indicators and their impact on sector performance.
This video was originally published on May 9, 2025. Click on the icon above to view on our dedicated page...
READ MORE
MEMBERS ONLY

Investment Portfolio Feeling Stagnant? Transform Your Path Today

by Jayanthi Gopalakrishnan,
Director of Site Content, StockCharts.com
KEY TAKEAWAYS
* Tariffs and trade talks add to investor uncertainty with short-lived rallies.
* Frequent shifts between offensive and defensive sectors indicate ongoing stock market volatility.
* Mid-cap and small-cap stocks are gaining momentum and worth monitoring.
When your investment portfolio isn't gaining ground, it's natural to feel...
READ MORE
MEMBERS ONLY
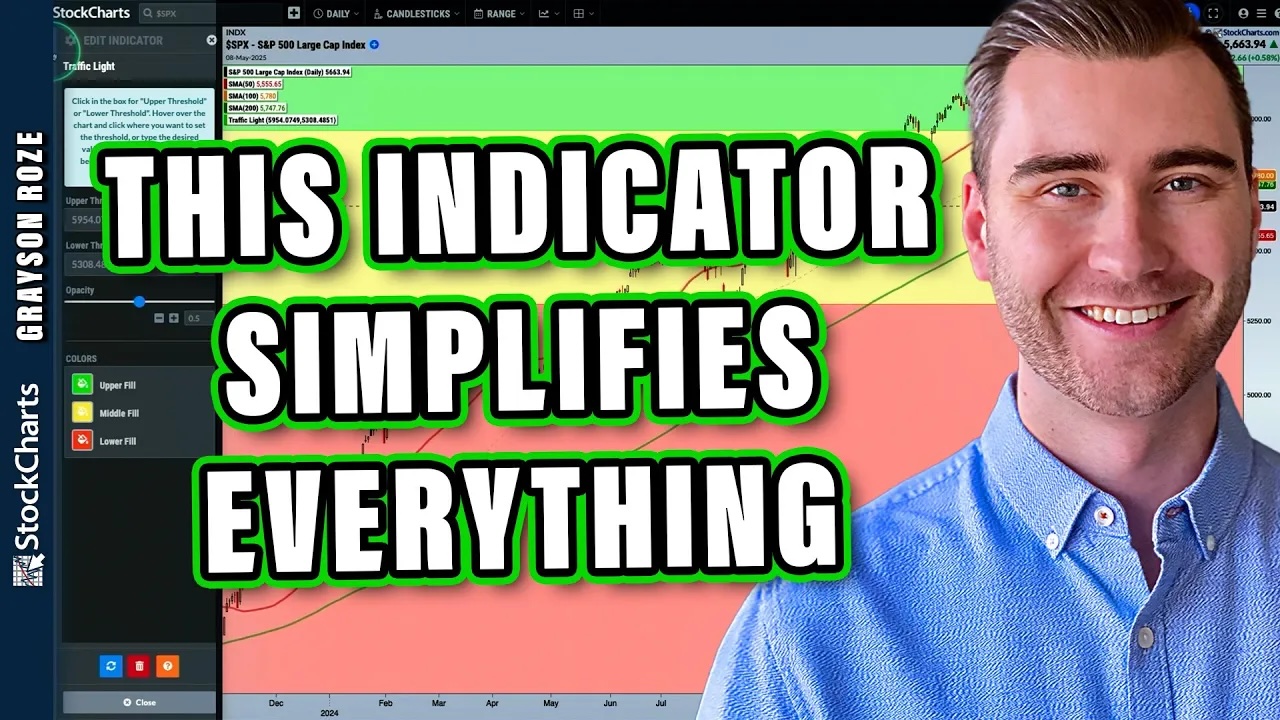
Confused by the Market? Let the Traffic Light Indicator Guide You

by Grayson Roze,
Chief Strategist, StockCharts.com
In this insightful session, Grayson introduces the Traffic Light indicator, a unique tool available exclusively on the Advanced Charting Platform (ACP). Amidst the current volatility of the S&P 500, Grayson demonstrates how this indicator can help investors clarify trend directions and make more confident decisions.
This video originally...
READ MORE
MEMBERS ONLY

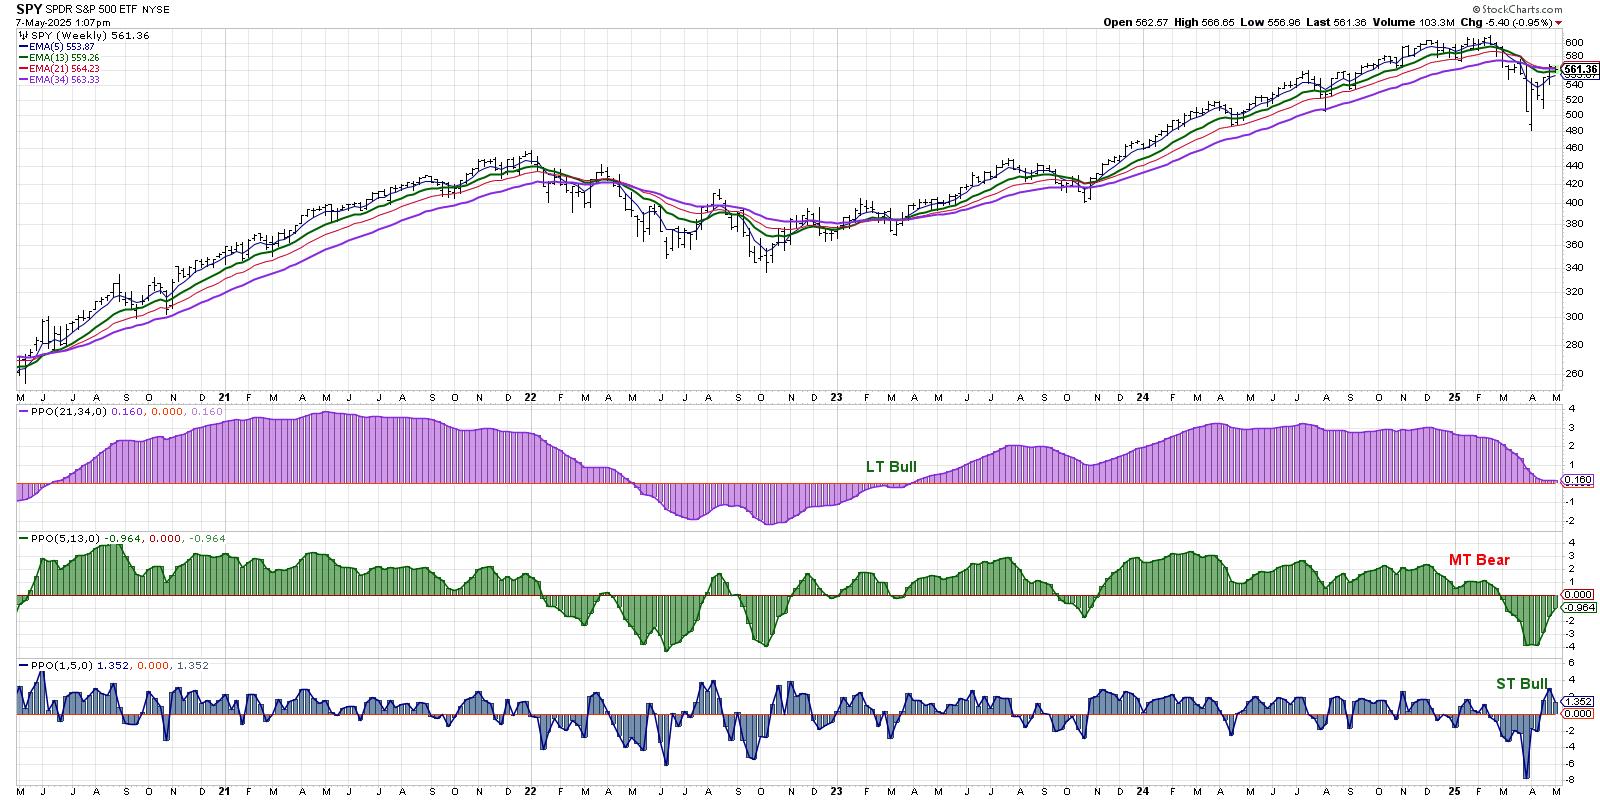
The V Reversal is Impressive, but is it Enough?

by Arthur Hill,
Chief Technical Strategist, TrendInvestorPro.com
KEY TAKEAWAYS
* SPY broke down in March, plunged into early April and surged into early May.
* This V bounce is impressive, but it is not enough to reverse the March breakdown.
* A significant increase in upside participation is needed to move from bear market to bull market.
Stocks plunged into...
READ MORE
MEMBERS ONLY

Don't Buy Robinhood Stock... Until You See This Chart Setup

by Karl Montevirgen,
The StockCharts Insider
KEY TAKEAWAYS
* Robinhood's stock price is outpacing its sector and the broader market.
* The Financials sector looks bullish, and HOOD has outperformed it by 250% over 3 years.
* Does HOOD have room to run, or is it running on fumes and FOMO?
Robinhood Markets, Inc. (HOOD) is back...
READ MORE
MEMBERS ONLY

The Unpredictable Stock Market: How to Make Sense of It
by Jayanthi Gopalakrishnan,
Director of Site Content, StockCharts.com
KEY TAKEAWAYS
* The S&P 500 is struggling to break above key resistance levels.
* It's a headline-driven market out there, with stocks reacting quickly to geopolitical and policy changes.
* The Cboe Volatility Index (VIX) indicates investors are still uncertain.
The stock market's action on Wednesday...
READ MORE
MEMBERS ONLY
Use This Multi-Timeframe MACD Signal for Precision Trades

by Joe Rabil,
President, Rabil Stock Research
In this video, Joe shares how to trade MACD signals using multiple timeframes, and how to spot stock market pullback setups that can help to pinpoint a great entry off a low. He then reviews sector performance to identify market leadership, covers key chart patterns, and discusses a looming bearish...
READ MORE
MEMBERS ONLY
Three Charts to Watch for an "All Clear" Signal

by David Keller,
President and Chief Strategist, Sierra Alpha Research
KEY TAKEAWAYS
* If our medium-term Market Trend Model turns bullish this Friday, that would mean the first bullish reversal since October 2023.
* Less than 50% of S&P 500 members are above their 200-day moving average, and any reading above 50% could confirm bullish conditions.
* Offensive sectors like Consumer...
READ MORE
MEMBERS ONLY

Will Trump's Foreign Film Tariffs Crush Streaming Stocks? What You Need To Know Now
by Karl Montevirgen,
The StockCharts Insider
KEY TAKEAWAYS
* Trump's proposed 100% tariffs on foreign films are now disrupting streaming media stocks.
* Pure-play stocks are responding differently, with Netflix, the most exposed to tariff risk, outperforming all others.
* Any technical or fundamental trade setup is subject to geopolitical dynamics; so be cautious!
Trump's...
READ MORE
MEMBERS ONLY

Four Charts to Track a Potential Market Top
by David Keller,
President and Chief Strategist, Sierra Alpha Research
In this video, Dave reveals four key charts he's watching to determine whether the S&P 500 and Nasdaq 100 will be able to power through their 200-day moving averages en route to higher highs. Using the recently updated StockCharts Market Summary page, he covers moving average...
READ MORE
MEMBERS ONLY
The Best Five Sectors, #18
by Julius de Kempenaer,
Senior Technical Analyst, StockCharts.com
KEY TAKEAWAYS
* Top 5 sectors remain unchanged, with minor position shifts
* Leading sectors showing signs of losing momentum
* Daily RRG reveals top sectors in weakening quadrant
* Communication services at risk of dropping out of top 5
Communication Services Drops to #5
The composition of the top five sectors remains largely...
READ MORE
MEMBERS ONLY

Two Down and Two to Go - Capitulation and Thrust are just a Start
by Arthur Hill,
Chief Technical Strategist, TrendInvestorPro.com
KEY TAKEAWAYS
* Stocks are halfway after capitulation in early April and a Zweig Breadth Thrust.
* SPY is still below its 200-day SMA and late March high.
* Follow through is needed to trigger the medium and long term signals.
The market does not always follow the same script or sequence, but...
READ MORE
MEMBERS ONLY

Three Stocks With Post-Earnings Upside Potential
by David Keller,
President and Chief Strategist, Sierra Alpha Research
With the major averages logging a strong up week across the board, and with the Nasdaq 100 finallyretesting its 200-day moving averagefrom below, it can feel like a challenging time to take a shot at winning charts. You may ask yourself, "Do I really want to be betting on...
READ MORE
MEMBERS ONLY

Stocks In Focus This Week: Palantir, Uber, and Coinbase
by Jay Woods,
Chief Global Strategist, Freedom Capital Markets
KEY TAKEAWAYS
* Palantir stock nears breakout as AI revenue and government contracts drive growth.
* Uber stock signals strength ahead of earnings report.
* Coinbase eyes reversal as crypto trading volume increases.
This week, we're watching three high-profile names--Palantir (PLTR), Uber (UBER), and Coinbase (COIN)--as they gear up for...
READ MORE
MEMBERS ONLY
Top 10 Stock Charts For May 2025: Breakouts, Trends & Big Moves!
by David Keller,
President and Chief Strategist, Sierra Alpha Research
by Grayson Roze,
Chief Strategist, StockCharts.com
Discover the top 10 stock charts to watch this month with Grayson Roze and David Keller, CMT. They break down breakout strategies, moving average setups, and technical analysis strategies using relative strength, momentum, and trend-following indicators. This analysis covers key market trends that could impact your trading decisions. You don&...
READ MORE
MEMBERS ONLY

The Hidden Meaning Behind the Tech Sector's Rally (And How to Spot It)
by Karl Montevirgen,
The StockCharts Insider
KEY TAKEAWAYS
* Technology stocks are back in the lead, with ETFs like XLK showing notable performance.
* MarketCarpets gives you a quick snapshot of sector trends and market breadth.
* Indicators like the Bullish Percent Index and CMF suggest XLK may be approaching overbought territory, highlighting the need to be cautious.
When...
READ MORE
MEMBERS ONLY

Master the 18/40 MA Strategy: Spot Trend, Momentum & Entry
by Joe Rabil,
President, Rabil Stock Research
In this video, Joe demonstrates how to use the 18-day and 40-day moving averages to identify trade entry points, assess trend direction, and measure momentum. He breaks down four key ways these MAs can guide your trading decisions—especially knowing when to be a buyer. Joe also analyzes commodities, noting...
READ MORE
MEMBERS ONLY

If Non-US Equities Continue to Outperform the S&P, Will Europe or Asia Benefit Most?

by Martin Pring,
President, Pring Research
Since the tariff war first broke out, there have been widespread reports in the financial press telling us that investors have decided to cash in on their U.S. profits and move their capital abroad. The U.S., they tell us, is no longer regarded as a safe haven. Indeed,...
READ MORE
MEMBERS ONLY
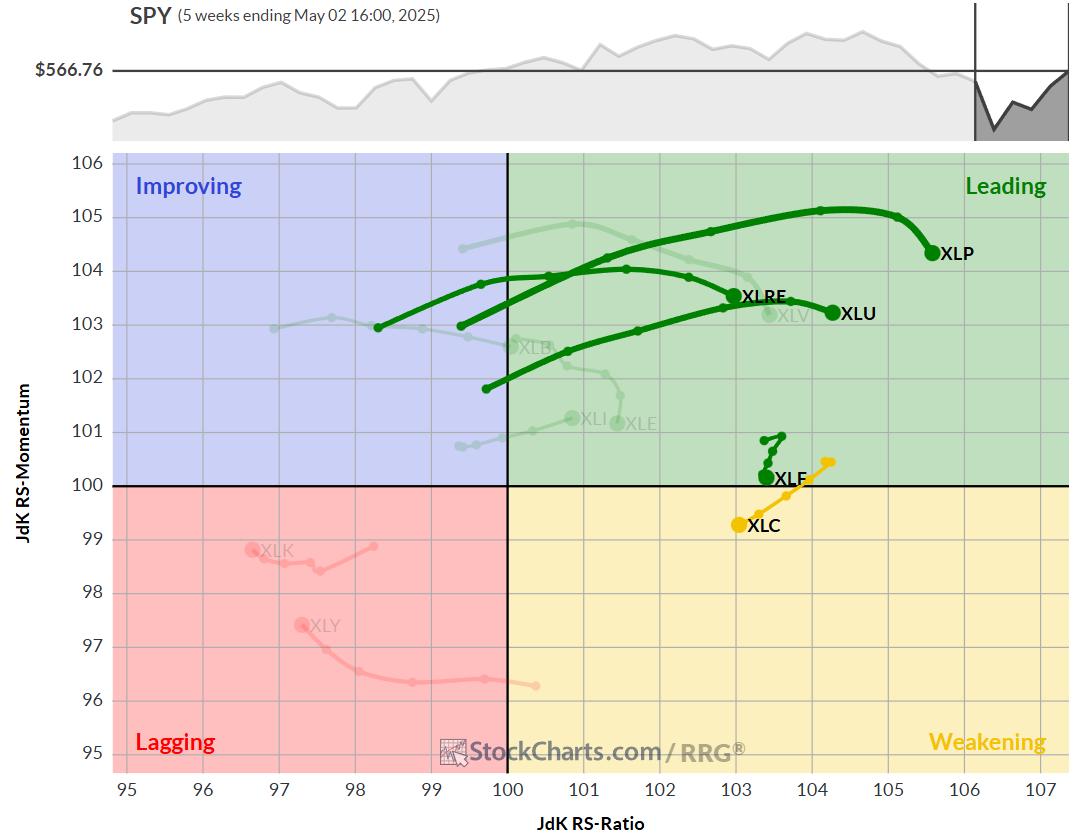
Sector Rotation + SPY Seasonality = Trouble for Bulls?
by Julius de Kempenaer,
Senior Technical Analyst, StockCharts.com
In this video, Julius analyzes current asset class rotation, revealing why stocks in the lagging quadrant may signal continued market weakness. By combining sector rotation trends—particularly strength in defensive sectors—with SPY seasonality, Julius builds a compelling case that downside risk in the S&P 500 may outweigh...
READ MORE
MEMBERS ONLY

The SCTR Report: Why PLTR Stock Remains a Top Contender in a Volatile Market
by Karl Montevirgen,
The StockCharts Insider
KEY TAKEAWAYS
* PLTR stock dropped sharply in February 2025 but rebounded in April, thanks to easing trade tensions and new government contracts.
* RSI and Accumulation/Distribution Line (ADL) suggest bullish momentum, but valuations remain stretched.
* Watch the May 5 earnings report and geopolitical developments for PLTR stock's next...
READ MORE
MEMBERS ONLY

Big Tech, Big Data, Big Moves: Why This Week Could Be a Market Game-Changer
by Jayanthi Gopalakrishnan,
Director of Site Content, StockCharts.com
KEY TAKEAWAYS
* The stock market is holding steady after last week's bounce, but remains hesitant.
* Big tech earnings and economic data are the focus this week.
* Sector rotation indicates that investors are shifting to defensive mode.
Speaking overall, the stock market hasn't changed course after last...
READ MORE
MEMBERS ONLY
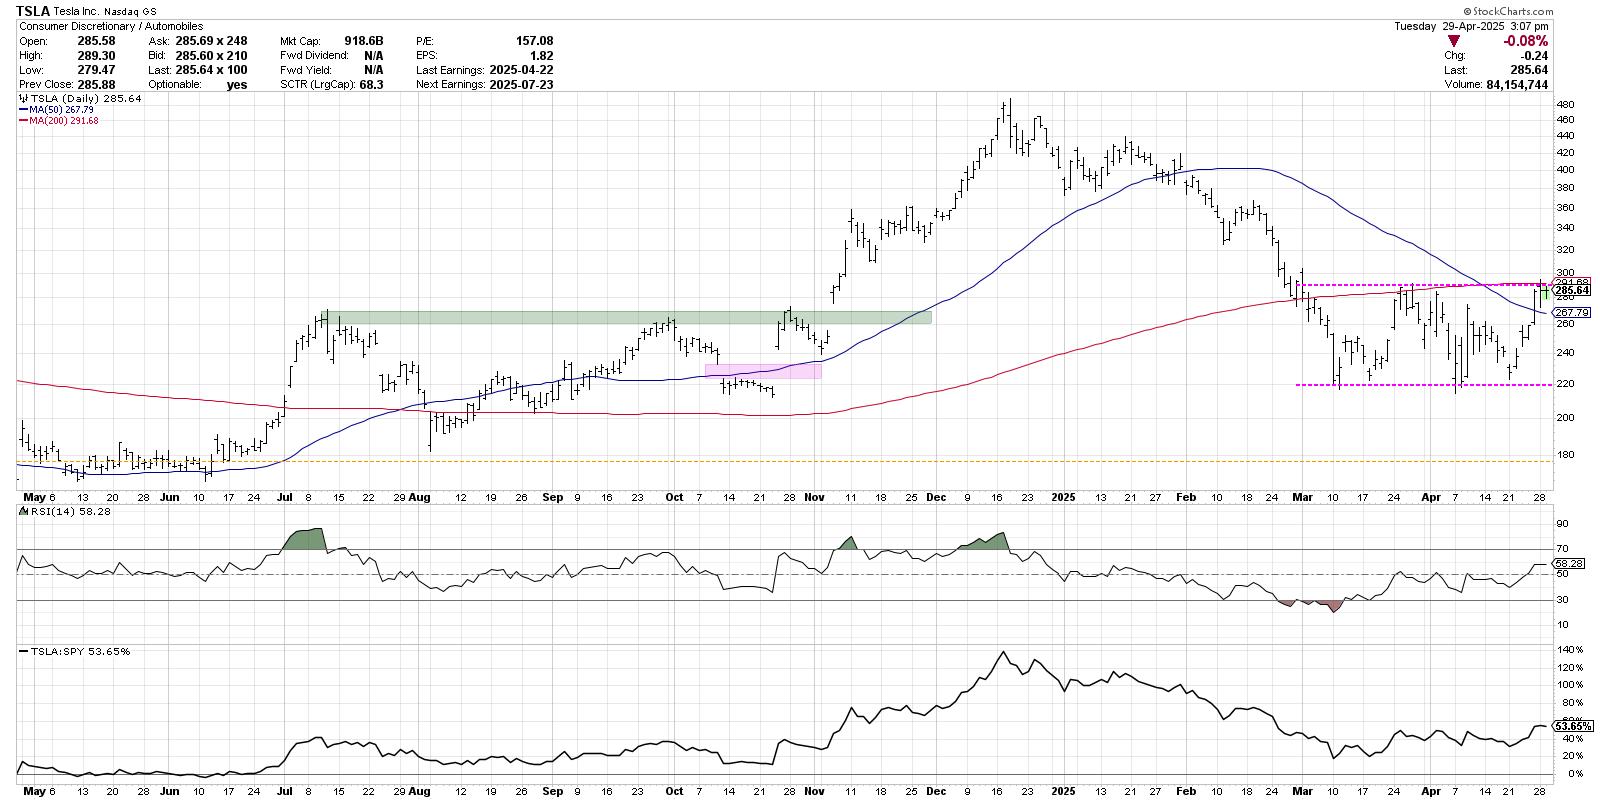
Tesla: The Breakout to Bolster the Bulls
by David Keller,
President and Chief Strategist, Sierra Alpha Research
KEY TAKEAWAYS
* An absence of strong momentum tells us to be patient and wait for a better entry point on the chart.
* Momentum indicators like RSI can help us define the trend phase and better identify when buyers are taking control.
* A breakout above $290 could indicate a new accumulation...
READ MORE
MEMBERS ONLY

Our Very Last Trading Room

by Erin Swenlin,
Vice President, DecisionPoint.com
Today, Carl and Erin made a big announcement! They are retiring at the end of June so today was the last free DecisionPoint Trading Room. It has been our pleasure educating you over the years and your participation in the trading room has been fantastic! Be sure and sign up...
READ MORE
MEMBERS ONLY

The Best Five Sectors, #17
by Julius de Kempenaer,
Senior Technical Analyst, StockCharts.com
KEY TAKEAWAYS
* Defensive sectors maintain dominance in top 5, despite strong market performance.
* Real Estate enters top 5, replacing Health Care; Consumer Staples, Utilities, and Financials remain stable in top 3 positions.
* Defensive positioning has put a dent in portfolio performance after strong week.
Real Estate and Healthcare Swapping Positions...
READ MORE
MEMBERS ONLY

Navigate Market Shifts Like a Pro: Utilize This Key Indicator Effectively
by Jayanthi Gopalakrishnan,
Director of Site Content, StockCharts.com
KEY TAKEAWAYS
* Market breadth indicators are flashing a bullish signal.
* Sector rotation is favoring risk-on investing.
* The Zweig Breadth Thrust triggered a signal, indicating a reversal from bearish to bullish conditions.
After weeks of uncertainty, the stock market finally gave us something to smile about. The major indexes just wrapped...
READ MORE
MEMBERS ONLY

S&P 500 Rises from Bearish to Neutral, But Will It Last?
by David Keller,
President and Chief Strategist, Sierra Alpha Research
KEY TAKEAWAYS
* This week's rally pushed the S&P 500 above an important trendline formed by the major highs in 2025.
* Improving market breadth indicators confirm a broad advance off the early April market low.
* Using a "stoplight" technique, we can better assess risk and...
READ MORE
MEMBERS ONLY

Earnings Week in Full Swing: Don't Overlook These Three Stocks
by Jay Woods,
Chief Global Strategist, Freedom Capital Markets
This week will be the biggest week of earnings season and yes, all eyes will be on the heavy-hitters: META, AMZN, MSFT, and AAPL. These names dominate headlines, and their charts are practically seared into our brains.
But let's look at some solid companies that might fly under...
READ MORE
MEMBERS ONLY

Sentiment Signals Suggest Skepticism
by David Keller,
President and Chief Strategist, Sierra Alpha Research
KEY TAKEAWAYS
* The AAII survey demonstrates a lack of bullish optimism after the recent bounce higher.
* The NAAIM Exposure Index suggests that money managers remain skeptical of the recent advance.
* While Rydex fund flows show a rotation to defensive positions, previous bearish cycles have seen much larger rotations.
When I...
READ MORE
MEMBERS ONLY

Everything Looks Fine... Until You See This Chart
by Karl Montevirgen,
The StockCharts Insider
KEY TAKEAWAYS
* Even though the stock market outlook may appear cautiously optimistic, it helps to monitor sentiment and money flow indicators.
* The S&P 500 is below its 40-week moving average and sentiment reads bearish.
* In a headline-driven market, any signs of optimism may reflect a pause, which means...
READ MORE
MEMBERS ONLY

Bonds Down, But Are They Out?
by Martin Pring,
President, Pring Research
Something didn't seem to ring true a couple of weeks ago when the whole world, by which I mean from the Treasury Secretary to your favorite cable news host, seized on the recent sell-off in bonds and why they would no longer be a safe haven and therefore...
READ MORE
MEMBERS ONLY

Hidden Gems: Bullish Patterns Emerging in These Country ETFs
by Joe Rabil,
President, Rabil Stock Research
In this video, Joe highlights key technical setups in select country ETFs that are showing strength right now. He analyzes monthly and weekly MACD, ADX, and RSI trends that are signaling momentum shifts. Joe also reviews the critical level to watch on the S&P 500 (SPX), while breaking...
READ MORE
MEMBERS ONLY
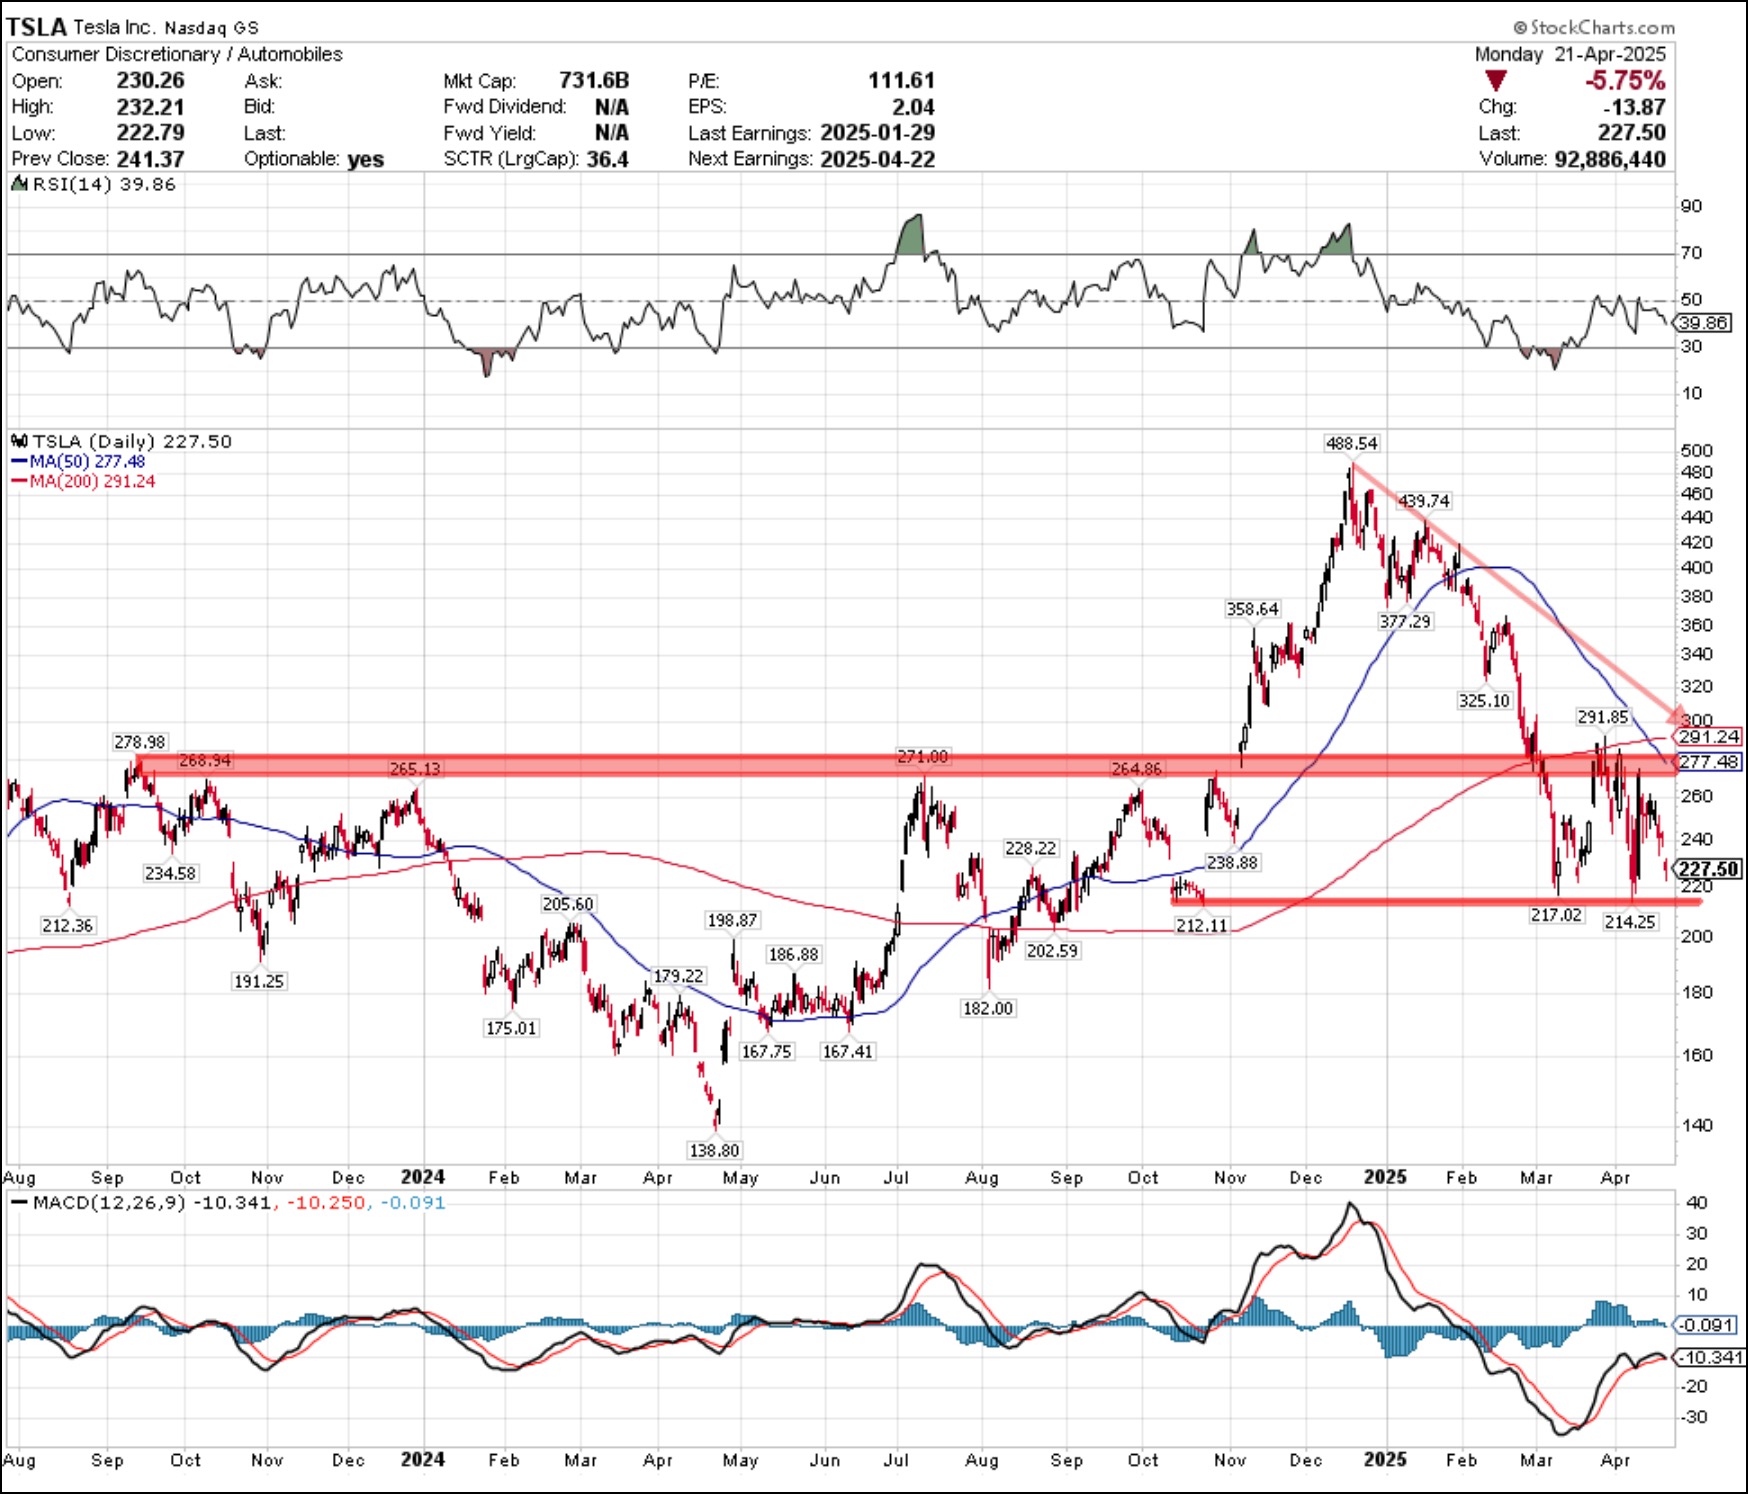
Three Stocks to Watch This Earnings Week
by Jay Woods,
Chief Global Strategist, Freedom Capital Markets
KEY TAKEAWAYS
* Tesla's daily chart displays key support levels to monitor after the company reports earnings.
* Service Now is showing signs of a bottom, which could mean a reversal depending on earnings results.
* Watch for Alphabet, Inc. shares to hit specific support levels, which could give traders favorable...
READ MORE
MEMBERS ONLY

Bearish Warning: 3 Market Sentiment Indicators You Can't Ignore
by David Keller,
President and Chief Strategist, Sierra Alpha Research
In this video, market sentiment, investor psychology, and stock market trends take center stage as David Keller, CMT, shares three powerful sentiment indicators that he tracks every week. He explains how the values are derived, what the current readings say about the market environment in April 2025, and how these...
READ MORE
MEMBERS ONLY

DP Trading Room: Long-Term Outlook for Bonds
by Erin Swenlin,
Vice President, DecisionPoint.com
The market continued to slide lower today as the bear market continues to put downside pressure on stocks in general. Bonds and Yields are at an inflection point as more buyers enter the Bond market which is driving treasury yields higher. What is the long-term outlook for Bonds? Carl gives...
READ MORE
MEMBERS ONLY
The Best Five Sectors, #16
by Julius de Kempenaer,
Senior Technical Analyst, StockCharts.com
KEY TAKEAWAYS
* Consumer staples and utilities continue to lead sector rankings.
* Defensive sectors are showing strength in both weekly and daily RRGs.
* Health care struggling, but maintains position in top 5
* RRG portfolio slightly underperforming S&P 500 YTD, but gap narrowing.
Top 5 Remains Unchanged
The latest sector...
READ MORE
MEMBERS ONLY

Stay Ahead of the Stock Market: Key Bond Market Signals Explained with Charts
by Jayanthi Gopalakrishnan,
Director of Site Content, StockCharts.com
KEY TAKEAWAYS
* The bond market has been as volatile as the equity market, as indicated by the Move Index.
* The price action in bonds will alert you to stability returning to equities.
* Investors should not rush to add positions until stability returns to the stock market.
It was another erratic...
READ MORE
MEMBERS ONLY
Breadth Maps Are A Bloodbath, BUT Has The Bounce Begun?
by Grayson Roze,
Chief Strategist, StockCharts.com
In this video, Grayson unveils StockCharts' new Market Summary ChartPack—an incredibly valuable new ChartPack packed full of pre-built charts covering breadth, sentiment, volatility data and MUCH MORE!
From there, Grayson then breaks down what he's seeing on the current Market Summary dashboard, illustrating how he'...
READ MORE
MEMBERS ONLY

Secure Your Retirement Happiness: Check Your 401(k) Now!
by Jayanthi Gopalakrishnan,
Director of Site Content, StockCharts.com
KEY TAKEAWAYS
* When the stock market is erratic you should evaluate your 401(k).
* The S&P 500 is trading below its 200-day moving average.
* The general sentiment continues to be bearish.
With so many articles and videos on popular media channels advising you not to look at your...
READ MORE