MEMBERS ONLY

Secure Your Retirement Happiness: Check Your 401(k) Now!

by Jayanthi Gopalakrishnan,
Director of Site Content, StockCharts.com
KEY TAKEAWAYS
* When the stock market is erratic you should evaluate your 401(k).
* The S&P 500 is trading below its 200-day moving average.
* The general sentiment continues to be bearish.
With so many articles and videos on popular media channels advising you not to look at your...
READ MORE
MEMBERS ONLY

Is This the Confidence Trap That Could Wreck Your Retirement Portfolio?

by Karl Montevirgen,
The StockCharts Insider
KEY TAKEAWAYS
* Despite extreme market volatility, the broader market's uptrend may still be intact.
* Defensive sectors like Consumer Staples and Utilities are flashing bullish signals.
* Defensive sectors don't typically drive uptrends so, depending on your time horizon, you will need to create an appropriate strategy.
If...
READ MORE
MEMBERS ONLY

Bullish Percent Index Confirms Short-Term Rebound

by David Keller,
President and Chief Strategist, Sierra Alpha Research
KEY TAKEAWAYS
* The Bullish Percent Index for both the Nasdaq 100 and S&P 500 have made moves similar to previous swing lows.
* A long-term review of these signals yields mixed results, especially during sustained bearish market regimes.
One of my favorite market breadth indicators remained in an extreme...
READ MORE
MEMBERS ONLY

Gold is at a Record High -- Is There a Message?

by Martin Pring,
President, Pring Research
The recent rally in the gold price has not yet attracted the kind of gold fever associated with the 1980 peak. At that time, there were numerous reports of unusual action, such as customers forming huge lines to buy the stuff at Canadian banks, an event that to my knowledge...
READ MORE
MEMBERS ONLY
DP Trading Room: SPX Earnings Update

by Erin Swenlin,
Vice President, DecisionPoint.com
The market has been overvalued for some time but how overvalued is it? Today Carl brings his earnings chart to demonstrate how overvalued the market is right now. We have the final data for Q4 2024.
The market continues to show high volatility but it did calm down somewhat Monday....
READ MORE
MEMBERS ONLY
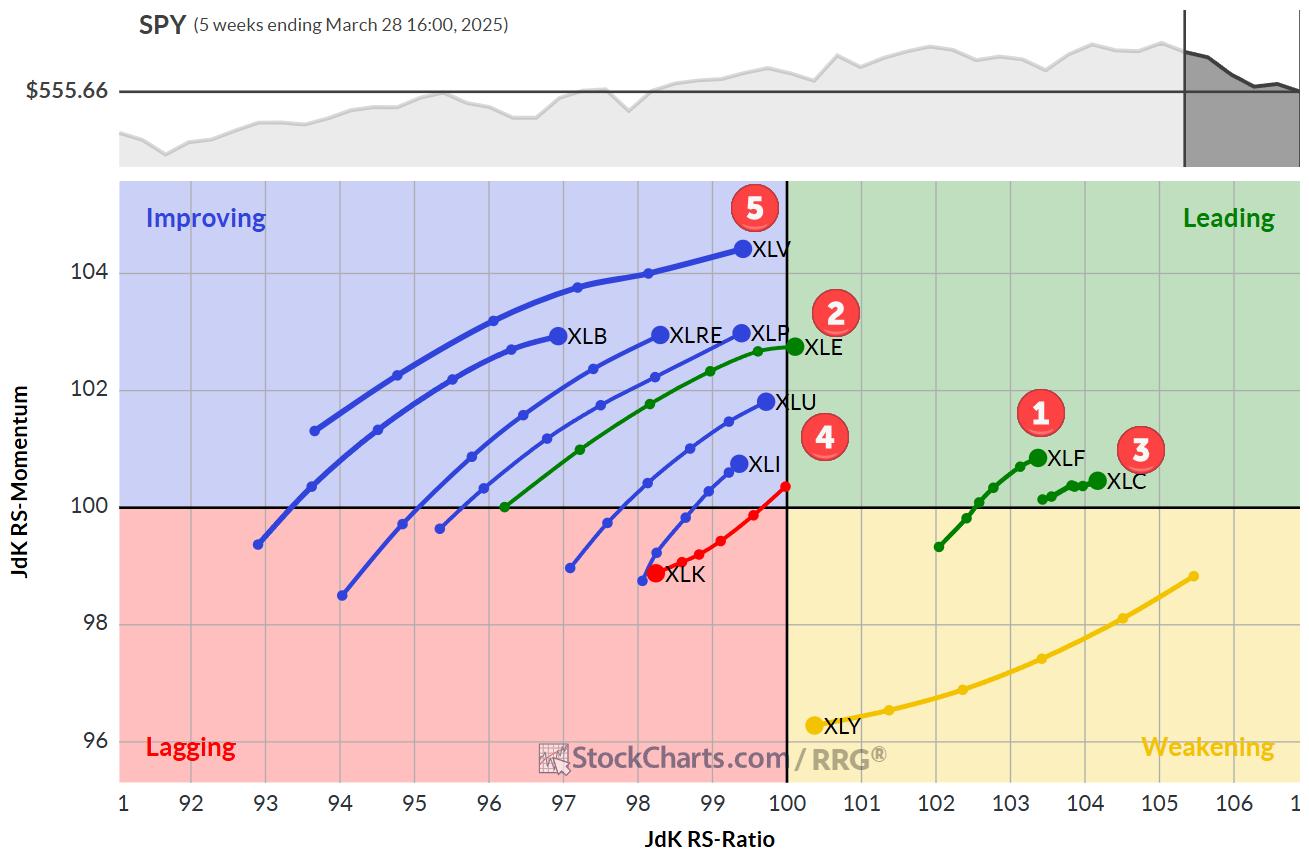
The Best Five Sectors, #15

by Julius de Kempenaer,
Senior Technical Analyst, StockCharts.com
KEY TAKEAWAYS
* The entire top 5 has now changed positions.
* All defensive sectors are now in the top 5, while Healthcare has reentered.
* Portfolio is now lagging S&P 500.
Healthcare Re-Enters the Top 5
After a wild week in the markets, the sector ranking got quite a shake-up....
READ MORE
MEMBERS ONLY
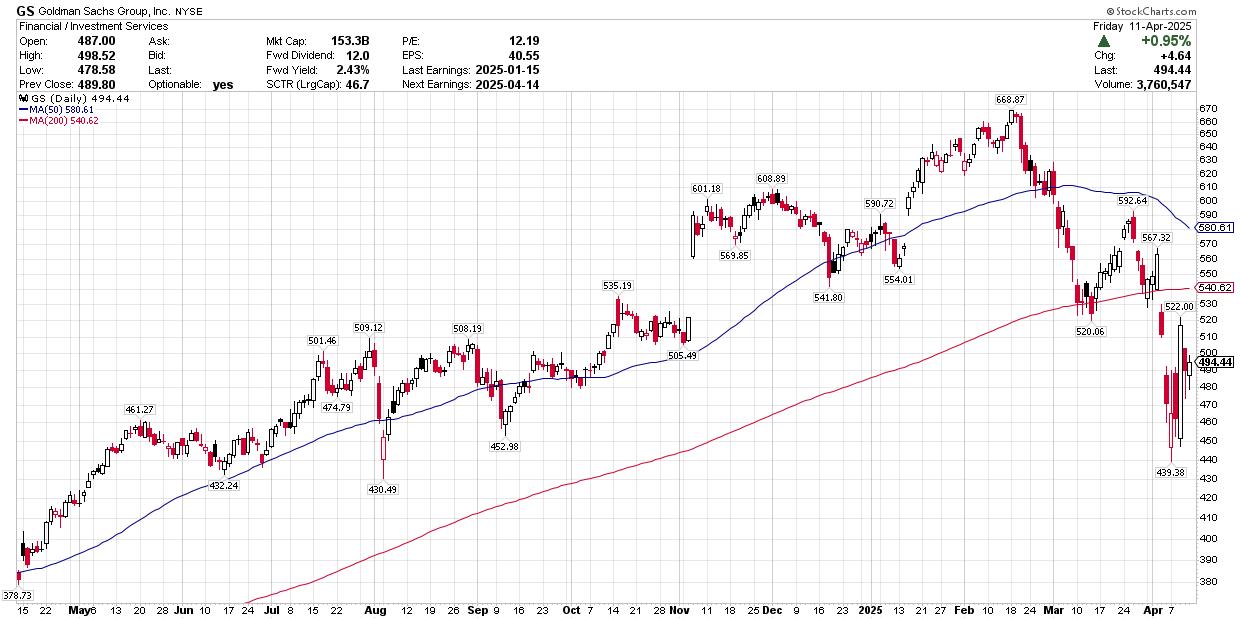
Earnings From These 3 Stocks Could Be Key

by Jay Woods,
Chief Global Strategist, Freedom Capital Markets
This week, we're getting back to earnings season during the shortened four-day period.
Goldman Sachs Group, Inc. (GS) reports on the heels of JP Morgan's solid results that saw its shares rally by 12.3% and recapture its 200-day moving average.
Watch the trading revenue numbers...
READ MORE
MEMBERS ONLY
Master the Market: A Guide to StockCharts' New Market Summary Page

by Grayson Roze,
Chief Strategist, StockCharts.com
Stock market analysis, technical indicators, and market trends are crucial for informed investing. StockCharts is making those things easier, and Grayson Roze is here to show you how.
In this video, Grayson provides an in-depth walk-through of the all-new Market Summary Page. This comprehensive tool offers a top-down overview of...
READ MORE
MEMBERS ONLY

Trade War Mayhem? Here's How to Cut Through the Noise!
by Karl Montevirgen,
The StockCharts Insider
KEY TAKEAWAYS
* Trade war-driven volatility has made short-term market forecasts highly unreliable.
* Despite near-term turbulence, long-term breadth indicators may offer clear insights.
* The McClellan Summation Index can help identify favorable entry points—but use it with caution and confirmation.
The current tariff environment is full of sudden moves that could...
READ MORE
MEMBERS ONLY

Is the Stock Market Getting Ready to Bounce? Key Market Breadth Signal Explained
by David Keller,
President and Chief Strategist, Sierra Alpha Research
When the stock market slides significantly, it's natural to question if the market has bottomed and getting ready to bounce.
In this video, David Keller, CMT highlights the Bullish Percent Index (BPI) as a key indicator to monitor during corrective moves. Learn more about how the BPI is...
READ MORE
MEMBERS ONLY

Stock Market Volatility: Pain Points, Bright Spots, and Strategies
by Grayson Roze,
Chief Strategist, StockCharts.com
by Julius de Kempenaer,
Senior Technical Analyst, StockCharts.com
Is the stock market volatility making you nervous?
In this video, Grayson Roze and Julius de Kempenaer unpack the volatile market environment and discuss pain points, some of the "bright spots" they are seeing in the market, and the StockCharts tools they are using to identify shifts in...
READ MORE
MEMBERS ONLY

Are the Tariffs Bullish or Bearish for the US Dollar?
by Martin Pring,
President, Pring Research
Tariffs have been front and center of market attention, but one asset class that has been relatively subdued in its response has been the US Dollar Index. It has declined in recent weeks, but a review of the technical picture suggests that the sell-off is part of an overall corrective...
READ MORE
MEMBERS ONLY
Key Levels for the S&P 500: Has It Bottomed?

by Joe Rabil,
President, Rabil Stock Research
Is the stock market on the verge of crashing or has it bottomed?
In this video, Joe Rabil uses moving averages and Fibonacci retracement levels on a longer-term chart of the S&P 500 to identify support levels that could serve as potential bottoms for the current market correction....
READ MORE
MEMBERS ONLY

DP Trading Room: Key Support Levels for the SPY
by Erin Swenlin,
Vice President, DecisionPoint.com
The market is in a tailspin as tariffs add volatility to the market. Carl and Erin believe the SPY is in a bear market given key indexes like the Nasdaq are already in bear markets. It's time to consider where the key support levels are.
Carl addressed his...
READ MORE
MEMBERS ONLY

The Best Five Sectors, #14
by Julius de Kempenaer,
Senior Technical Analyst, StockCharts.com
KEY TAKEAWAYS
* Consumer Staples replaces Healthcare in top 5
* More defensive rotation underway
* RRG portfolio remains in line with market performance
This article was first posted on 4/4/2025 and contained only rankings and charts. Then updated with comments 4/7/2025
I am attending and speaking at the...
READ MORE
MEMBERS ONLY

Demystifying Tariff Impact: Essential Insights for Every Investor
by Jayanthi Gopalakrishnan,
Director of Site Content, StockCharts.com
KEY TAKEAWAYS
* The broader stock market indexes are all trading below their 100-week moving averages.
* The Bullish Percent Index (BPI) indicates sellers are dominant.
* The AAII Sentiment Survey reveals extreme bearishness among investors.
The stock market hoped for curtailment of tariffs on Wednesday, but that didn't happen. Even...
READ MORE
MEMBERS ONLY
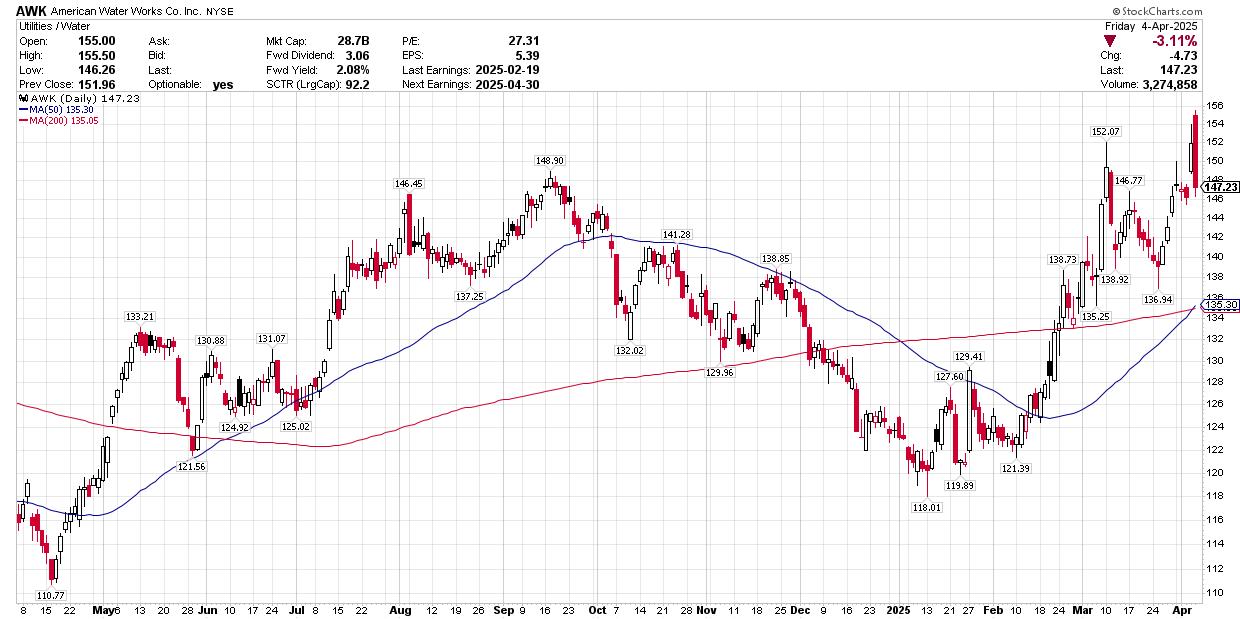
Three Stocks to Watch: Utilities, Banks, Airlines
by Jay Woods,
Chief Global Strategist, Freedom Capital Markets
When markets are sliding lower, where should you be investing? Here are three stocks to consider.
American Water Works (AWK)
Why focus on a utility company that isn't reporting earnings this week? It's because the biggest question of the week is where should you put your...
READ MORE
MEMBERS ONLY

Bitcoin Holds Up, but Remains Short of Relative Breakout

by Arthur Hill,
Chief Technical Strategist, TrendInvestorPro.com
KEY TAKEAWAYS
* Traders may consider alternatives, such as Bitcoin, in bear markets.
* Bitcoin and SPY are positively correlated long-term, but one period stands out.
* Even though Bitcoin shows short-term relative strength, it is short of a relative breakout.
Stocks are in a freefall with selling pressure spreading into industrial metals...
READ MORE
MEMBERS ONLY
Trend-Following Stocks: How a Low ADX Can Signal Huge Breakouts!
by Joe Rabil,
President, Rabil Stock Research
In this exclusive StockCharts video, Joe Rabil shows you how to use the ADX on monthly and weekly charts to find stocks with massive breakout potential. Joe walks you through several examples of stocks and ETFs that broke out of an extended period of trading sideways. He also discusses the...
READ MORE
MEMBERS ONLY

Sentiment Is Near-Perfect for a Rally: One Thing Could Stand In the Way
by Martin Pring,
President, Pring Research
KEY TAKEAWAYS
* Several sentiment indicators have reached levels that usually fuel a worthwhile rally or jump-started a new bull market.
* Sentiment indicators could be at levels that are ripe for a rally but keep an eye on them.
* The absence of a rally could increase the odds of a bull...
READ MORE
MEMBERS ONLY

AU Surges Above Resistance: Here's How to Take Action
by Karl Montevirgen,
The StockCharts Insider
KEY TAKEAWAYS
* AngloGold Ashanti Ltd. is outperforming gold and its mining peers.
* Despite long-term bullish projections, AU faces short-term overbought conditions.
* Key levels are at $33 and $28 on the downside and $42 to $45 on the upside.
As precious metals surgeon safe-haven demand, some gold mining companies are following...
READ MORE
MEMBERS ONLY

Top 10 Stock Charts for April 2025: Big Breakouts Ahead?
by David Keller,
President and Chief Strategist, Sierra Alpha Research
by Grayson Roze,
Chief Strategist, StockCharts.com
Finding stocks that show promising opportunities can be challenging in a market that goes up and down based on news headlines. But, it's possible.
In this video, watch how Grayson Roze and David Keller, CMT use the tools available in StockCharts to find stocks that are breaking out,...
READ MORE
MEMBERS ONLY

DP Trading Room: Magnificent Seven Stocks in Bear Markets
by Erin Swenlin,
Vice President, DecisionPoint.com
You may not know it, but all of the Magnificent Seven stocks are in bear markets. Given they are such an integral part of the major indexes, we have to believe that the market will follow suit and continue lower in its own bear market. The SP500 is in correction...
READ MORE
MEMBERS ONLY
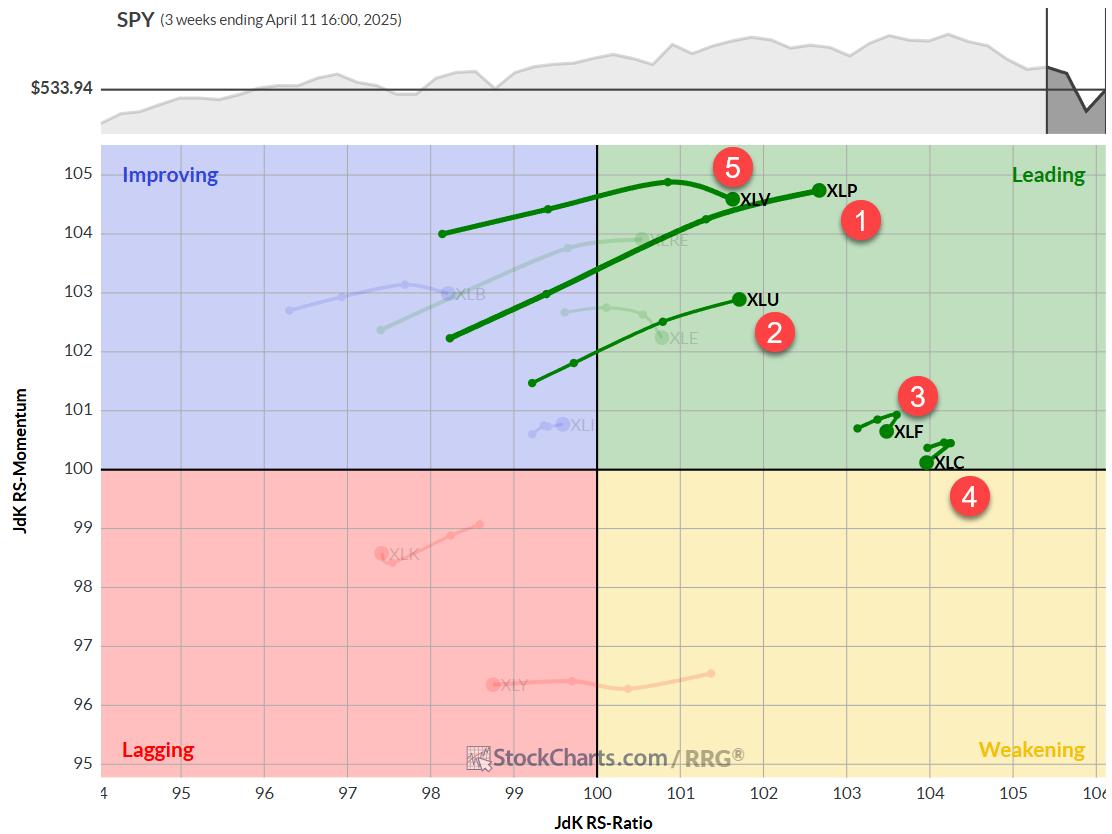
The Best Five Sectors, #13
by Julius de Kempenaer,
Senior Technical Analyst, StockCharts.com
KEY TAKEAWAYS
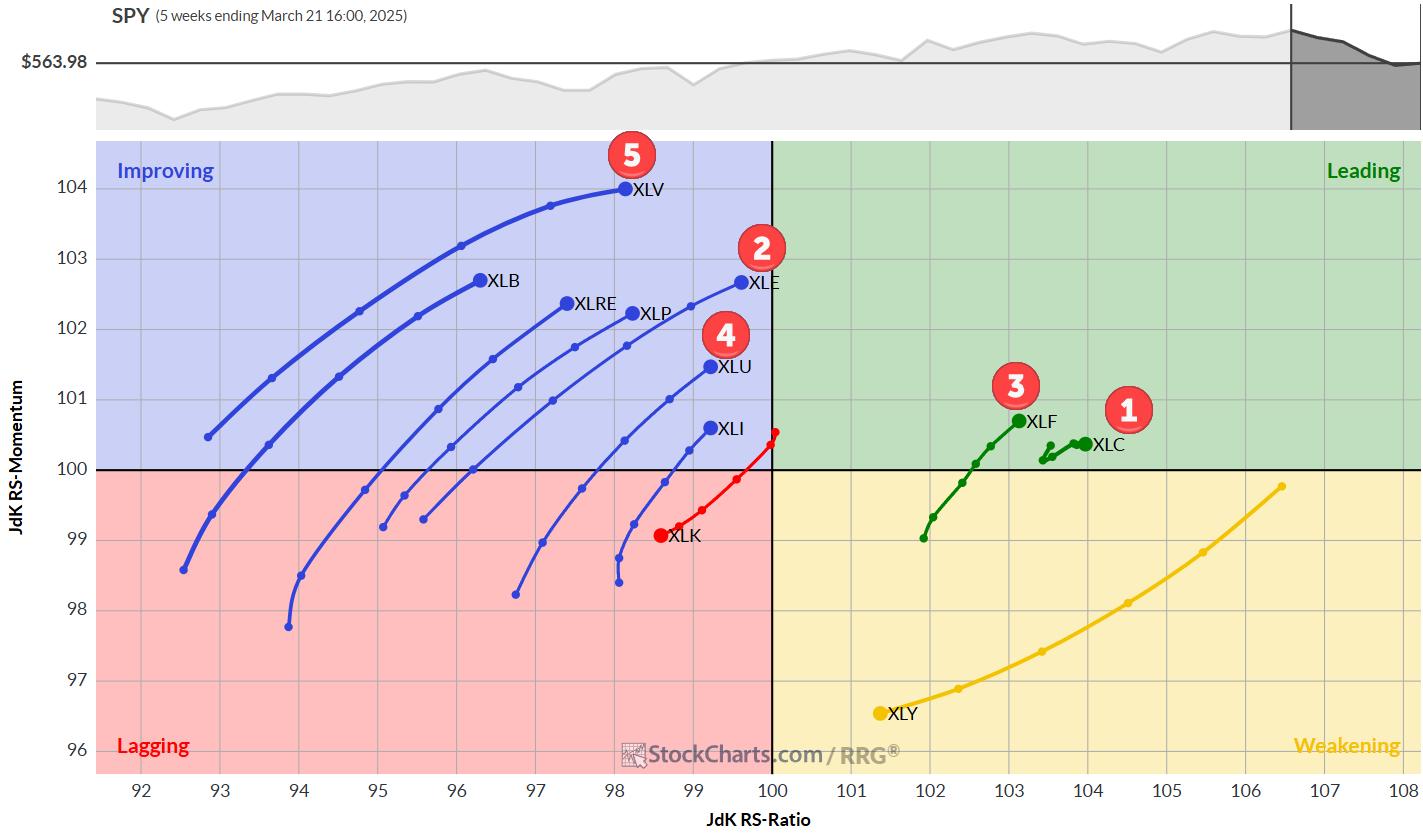
* Financials jump to #1 spot in S&P 500 sector rankings.
* Three sectors now in leading quadrant on weekly RRG
* Only Tech and Consumer Discretionary showing negative RRG headings
* RRG portfolio outperforming S&P 500 YTD by 10 basis points
Financials take the lead.
No changes...
READ MORE
MEMBERS ONLY

Stocks In Focus: Three Charts to Watch
by Jay Woods,
Chief Global Strategist, Freedom Capital Markets
KEY TAKEAWAYS
* Two Consumer Staples stocks and one Consumer Discretionary stock made the cut this week.
* These three stocks show clear support levels that could serve as potential entry points.
This week, we get back to earnings and, sadly, the pickings are slim.
Given these turbulent times, we have two...
READ MORE
MEMBERS ONLY

Silver Cross Index Tops Beneath Signal Line on SPY
by Erin Swenlin,
Vice President, DecisionPoint.com
One of the indicators that Carl Swenlin developed is the Silver Cross Index. It is one of the best participation indicators out there! Here's how it works:
We consider a positive 20/50-day EMA crossover a "Silver Cross". If a stock has a Silver Cross it...
READ MORE
MEMBERS ONLY

Performance Profile Paints Different Pictures for Commodity and Equity ETFs
by Arthur Hill,
Chief Technical Strategist, TrendInvestorPro.com
KEY TAKEAWAYS
* Among equity ETFs, non-cyclical groups are holding up the best.
* Cyclical names have the most pronounced downtrends.
The performance profile for 2025 says a lot about the state of the market. Commodity-related ETFs are leading, non-cyclical equity ETFs are holding up the best and cyclical names are performing...
READ MORE
MEMBERS ONLY
Three Growth Stocks Testing the Ultimate Trend Barometer
by David Keller,
President and Chief Strategist, Sierra Alpha Research
KEY TAKEAWAYS
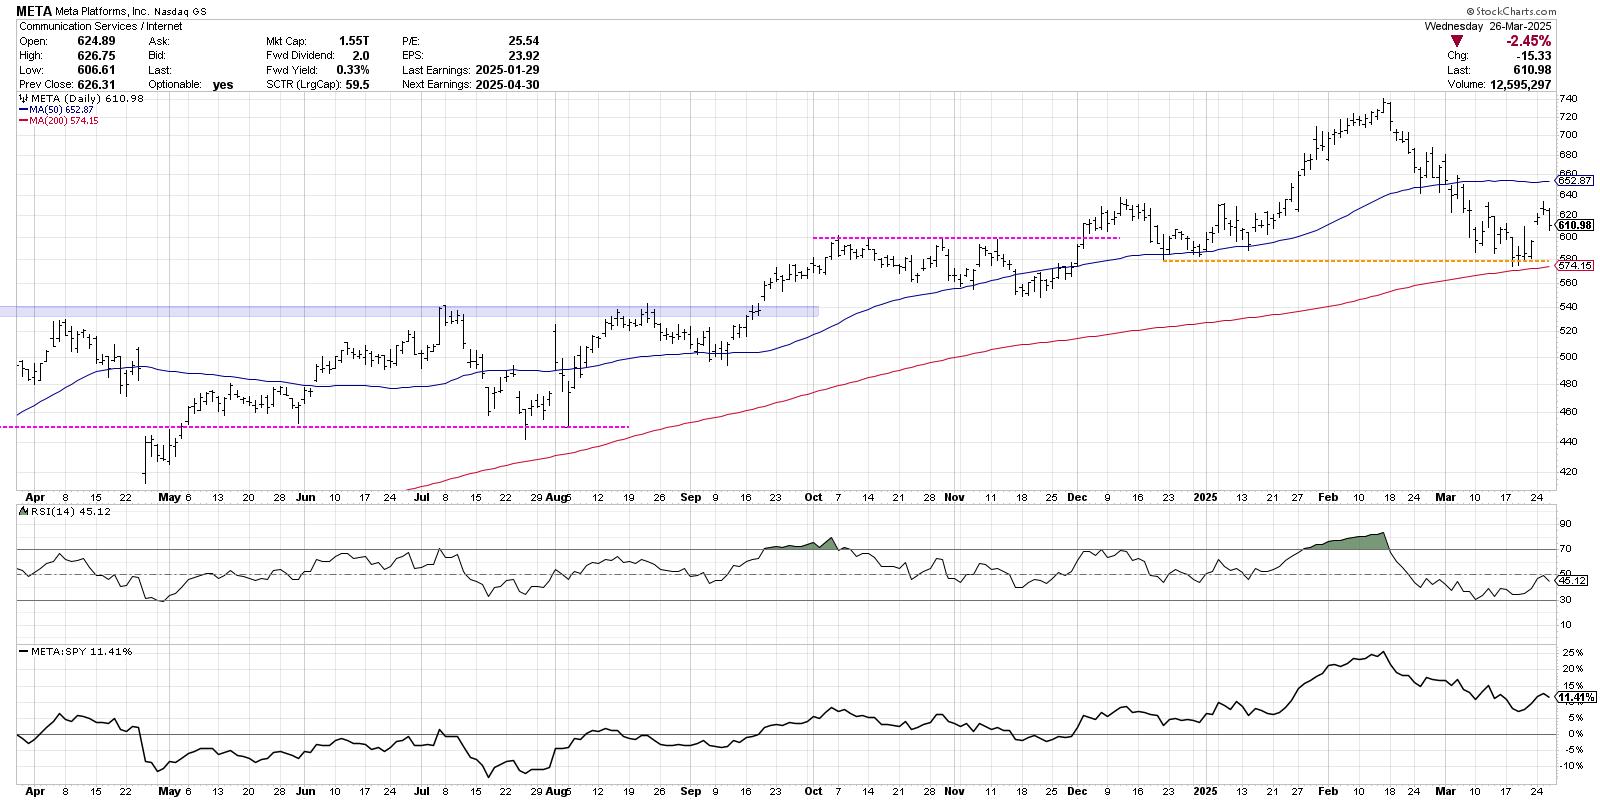
* META remains above an upward-sloping 200-day moving average.
* If AMZN fails to hold its 200-day, this could mean bad things for AMZN and bad things for the markets.
* TSLA has rallied up to its 200-day moving average, but so far has failed to gain a foothold above this...
READ MORE
MEMBERS ONLY

This Precious Metal is On the Verge of a Massive Breakout. Here's How to Catch It!
by Karl Montevirgen,
The StockCharts Insider
KEY TAKEAWAYS
* Silver and gold have been rallying due to macroeconomic uncertainty, central bank purchases, and industrial demand.
* Precious metals have risen considerably and many analysts are projecting even higher target prices, especially for silver.
* Gold and silver are approaching key levels of entry and support.
Gold at $3,100...
READ MORE
MEMBERS ONLY

Is It Time to Buy Tesla?
by Martin Pring,
President, Pring Research
Recently, there have been horror stories about individual Tesla owners being harassed and dealers being vandalized, all because people have decided they don't like Elon Musk or his recent DOGE actions. In Europe, sales are reported down 49% in the first two months of the year, and, to...
READ MORE
MEMBERS ONLY

Key Levels for AAPL, AMZN, NVDA — Will This Market Rally Hold?
by David Keller,
President and Chief Strategist, Sierra Alpha Research
In this video, Dave breaks down the upside bounce in the Magnificent 7 stocks — AAPL, AMZN, NVDA, and more — highlighting key levels, 200-day moving averages, and top trading strategies using the StockCharts platform. Find out whether these leading growth stocks are set for a bullish reversal or more downside. Will...
READ MORE
MEMBERS ONLY

DRI Stock Breakout Confirmed: Here's What You Need to Know Now!
by Karl Montevirgen,
The StockCharts Insider
KEY TAKEAWAYS
* When markets rebound from a sharp decline, you'll have more than enough stocks to choose from.
* If you're considering stocks that are outpacing their peers, you need to run the right scan to spot them.
* Darden Restaurants' stock price made an all-time high,...
READ MORE
MEMBERS ONLY
DP Trading Room: Tariffs Narrowing, Sparks Market Rally
by Erin Swenlin,
Vice President, DecisionPoint.com
Over the weekend it was announced that tariffs will be narrowing and possibly not as widespread as initially thought. Negotiations are continuing in the background and this seems to be allaying market participants' fears. The market rallied strongly on the news.
Carl and Erin gave you their opinions of...
READ MORE
MEMBERS ONLY
The Best Five Sectors, #12
by Julius de Kempenaer,
Senior Technical Analyst, StockCharts.com
KEY TAKEAWAYS
* Energy sector jumps to position #2 in top 5
* Consumer Staples drops out of portfolio
* Communication Services remains at #1 spot
* Modest pick up of relative momentum for XLK and XLY not enough yet
Energy Jumps to #2
A big move for the energy sector last week as...
READ MORE
MEMBERS ONLY

Stocks in Focus: 3 Stocks to Watch
by Jay Woods,
Chief Global Strategist, Freedom Capital Markets
KEY TAKEAWAYS
* These three stocks are showing great relative strength when compared to their peers.
* Two stocks are relatively less risky, while one is a tech high-flyer.
* Identify your entry and exit points and set alerts to notify you when price reaches these levels.
Seeing that the earnings slate is...
READ MORE
MEMBERS ONLY

American Association of Individual Investors (AAII) Breaks Record
by Erin Swenlin,
Vice President, DecisionPoint.com
We wrote about the American Association of Individual Investors (AAII) poll results a few weeks ago. Since then, the bearish activity on the chart has broken a record for the poll. Going back to the poll's inception in 1987, we have never seen four weeks in a row...
READ MORE
MEMBERS ONLY
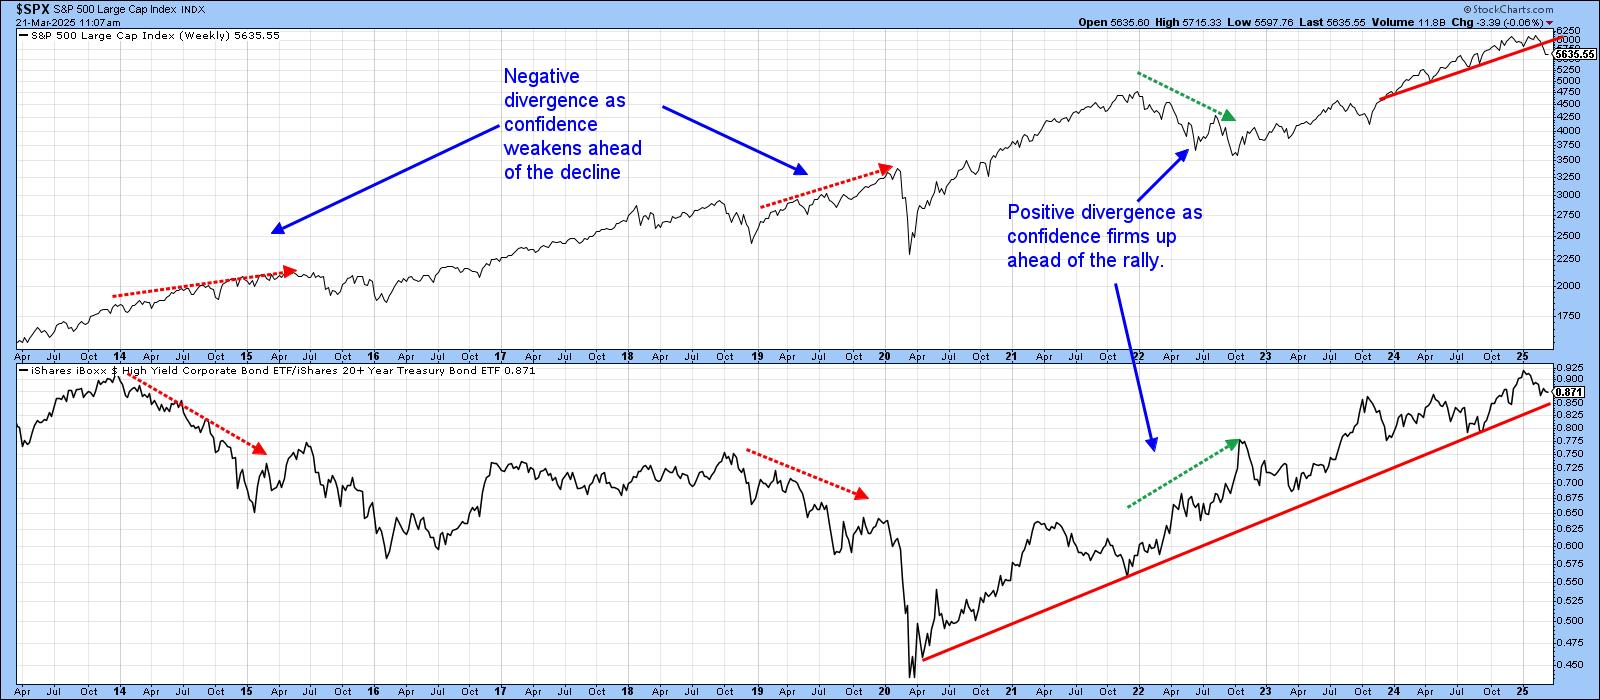
Confidence Ratios are in an Uptrend, But Looking Vulnerable
by Martin Pring,
President, Pring Research
At this week's news conference, Jerome Powell mentioned that the Fed is cautious about making significant changes to interest rates due to unclear economic conditions, citing factors like trade policies and inflation, which have contributed to this uncertainty. If the "experts" don't know, it&...
READ MORE
MEMBERS ONLY

Two Ways to Use the Zweig Breadth Thrust - Plus an Added Twist
by Arthur Hill,
Chief Technical Strategist, TrendInvestorPro.com
KEY TAKEAWAYS
* The Zweig Breadth Thrust is best known for its bullish reversal signals.
* Traders can also use the "setup" period to identify oversold conditions.
* Nasdaq stocks were left out of the original, but there is solution.
The Zweig Breadth Thrust is best known for its bullish reversal...
READ MORE
MEMBERS ONLY

New SPX Correction Signal! How Long Will It Last?
by Joe Rabil,
President, Rabil Stock Research
In this exclusive StockCharts video, Joe breaks down a new SPX correction signal using the monthly Directional Lines (DI), showing why this pullback could take time to play out. He explains how DI lines influence the ADX slope and how this impacts shorter-term patterns. Joe also reveals a strong area...
READ MORE
MEMBERS ONLY

4 Scenarios for Nasdaq 100: Bullish Surge or Bearish Collapse?
by David Keller,
President and Chief Strategist, Sierra Alpha Research
Can the Nasdaq 100 rally to all-time highs or break down below key support? In this video, Dave uses probabilistic analysis to explore 4 possible scenarios for the QQQ over the next 6 weeks — from a super bullish surge to a bearish breakdown below the August 2024 low. Discover the...
READ MORE