MEMBERS ONLY

Unlocking the Secrets to Profitable Semiconductor Investments

by Jayanthi Gopalakrishnan,
Director of Site Content, StockCharts.com
KEY TAKEAWAYS
* Semiconductor stocks are waking up from a long slumber.
* The StockCharts MarketCarpets tool can help identify the high performers.
* Analyze each chart to identify trends and support or resistance levels.
Disappointing guidance from Walmart (WMT) may have hurt the stock market on Thursday sending the broader indexes lower....
READ MORE
MEMBERS ONLY

Three Signs of the Bear and What May Come Next!

by David Keller,
President and Chief Strategist, Sierra Alpha Research
KEY TAKEAWAYS
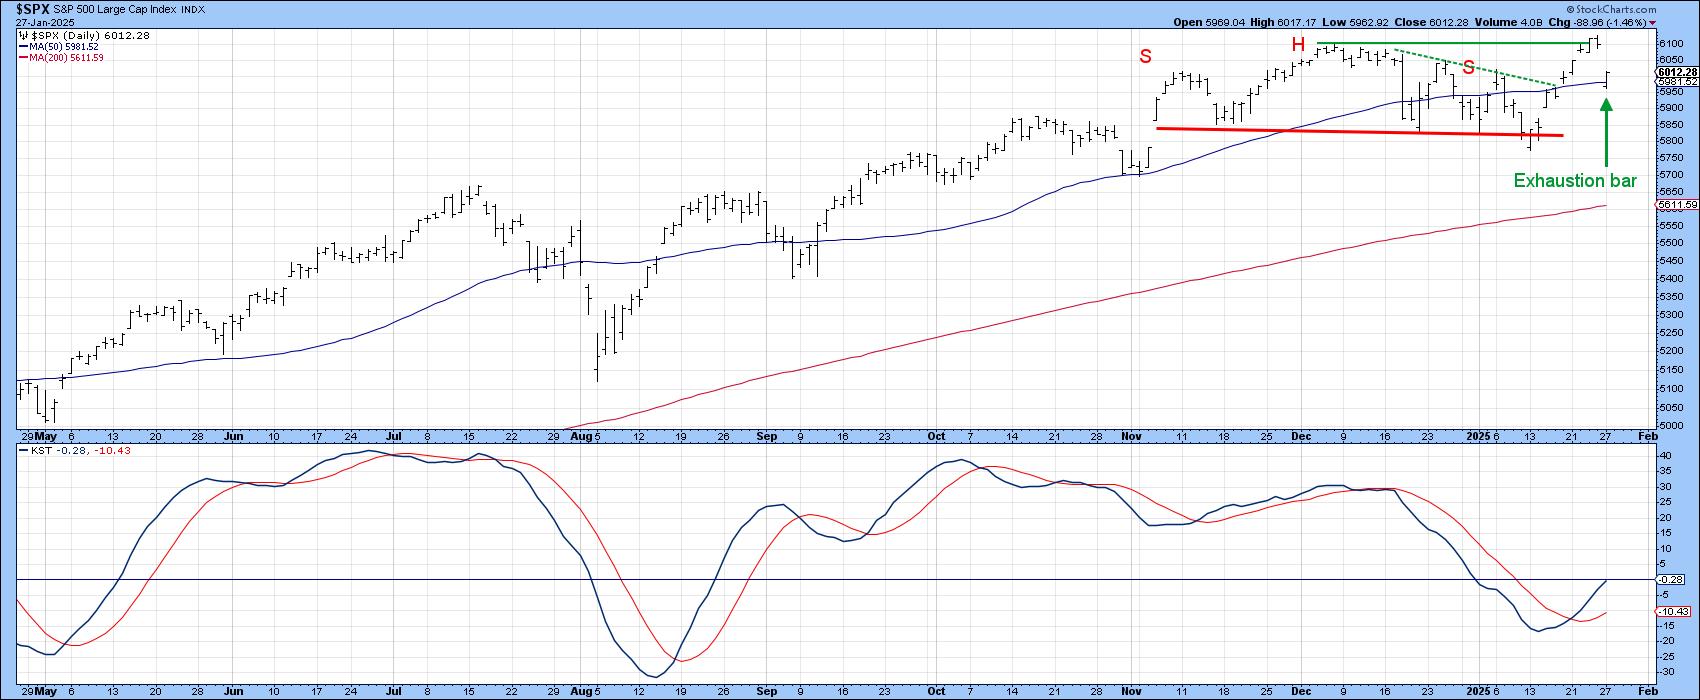
* Bearish momentum divergences suggest potential exhaustion of the bulls and limited upside.
* Market breadth indicators have not confirmed recent highs, reflecting a lack of support outside the leading performers.
* Dow Theory non-confirmation, a pattern first identified by Charles Dow, shows that market indexes are not confirming one another....
READ MORE
MEMBERS ONLY

From Crash to Comeback: Is SMCI Stock the Hottest AI Asset Right Now?

by Karl Montevirgen,
The StockCharts Insider
KEY TAKEAWAYS
* SMCI shot up 110% following a 1,167% plunge.
* While the company is projecting $40 billion in revenue by next year, many analysts aren't convinced (yet).
* The price action, however, tells its own story and is a few levels away from a buy and an uptrend....
READ MORE
MEMBERS ONLY
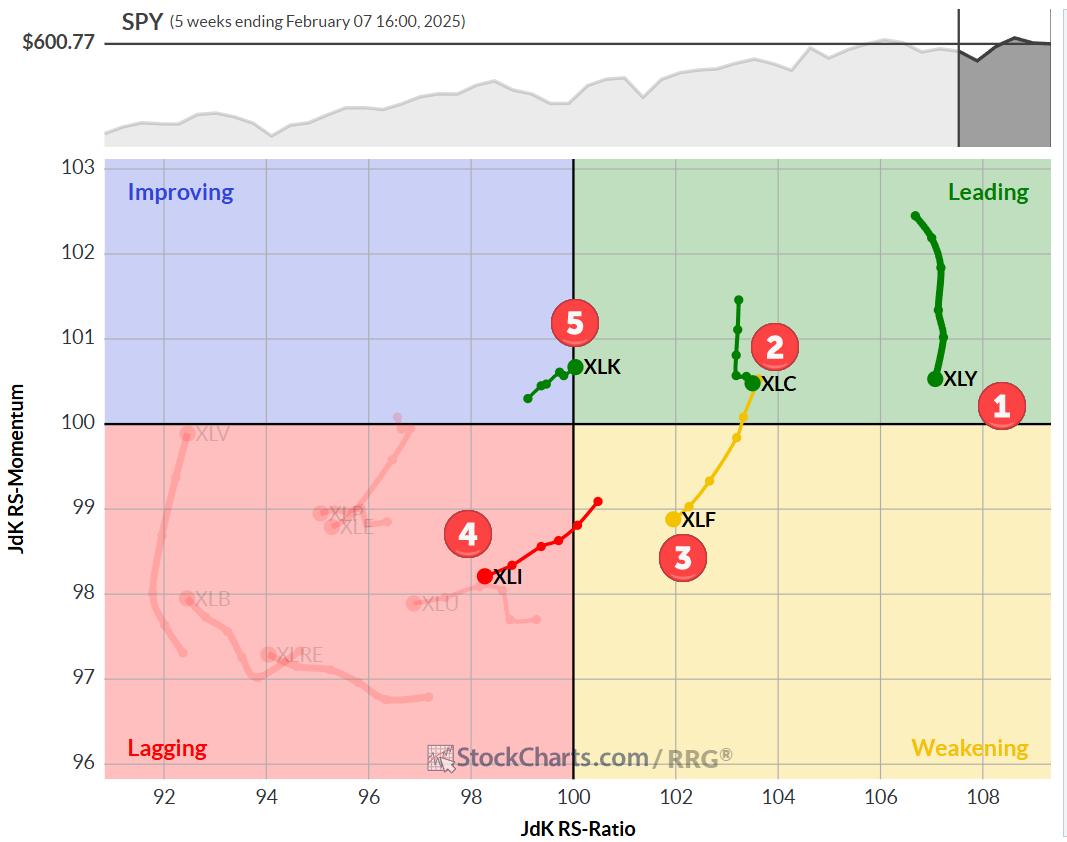
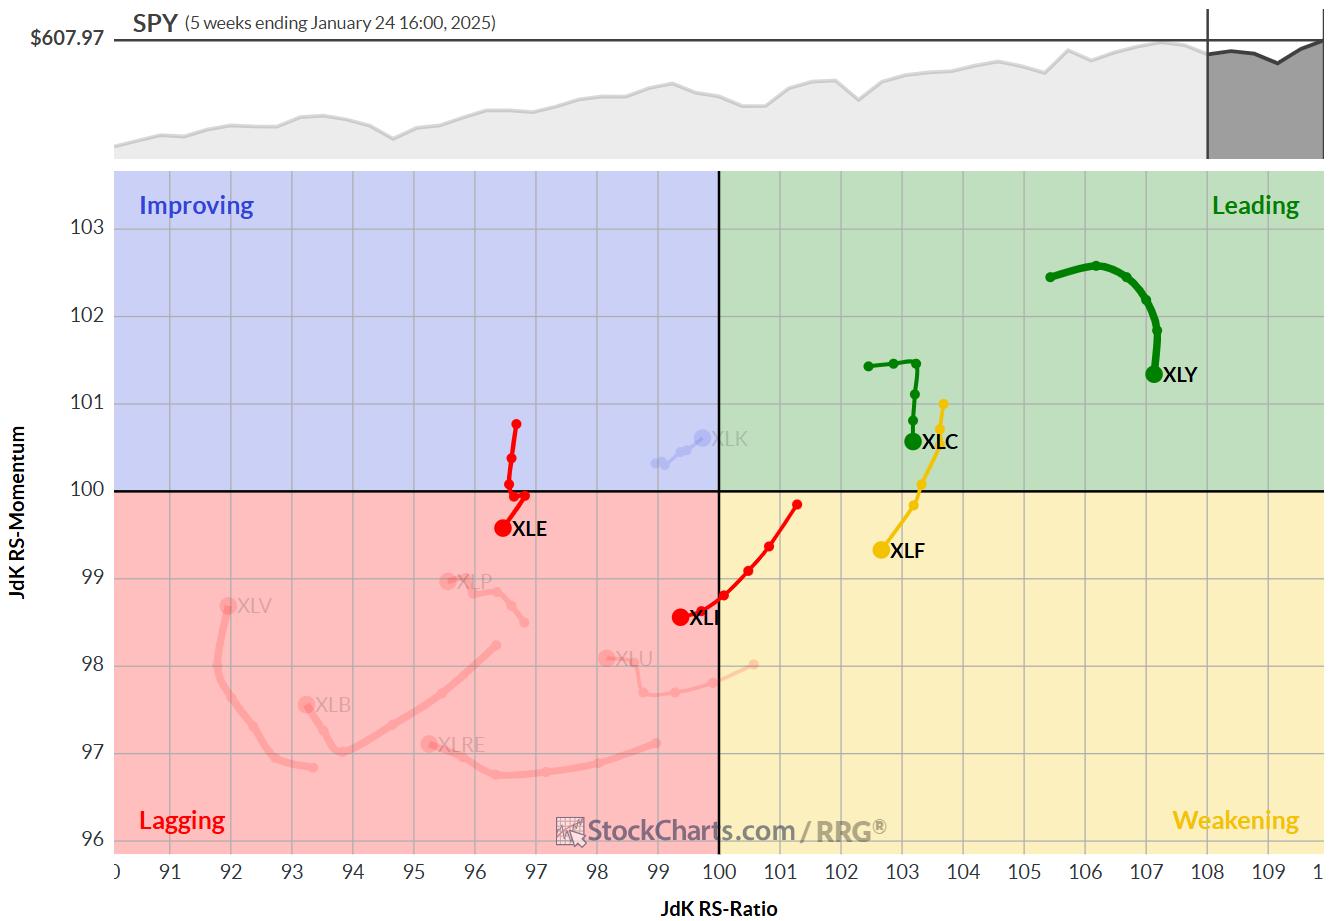
The Best Five Sectors, #7

by Julius de Kempenaer,
Senior Technical Analyst, StockCharts.com
KEY TAKEAWAYS
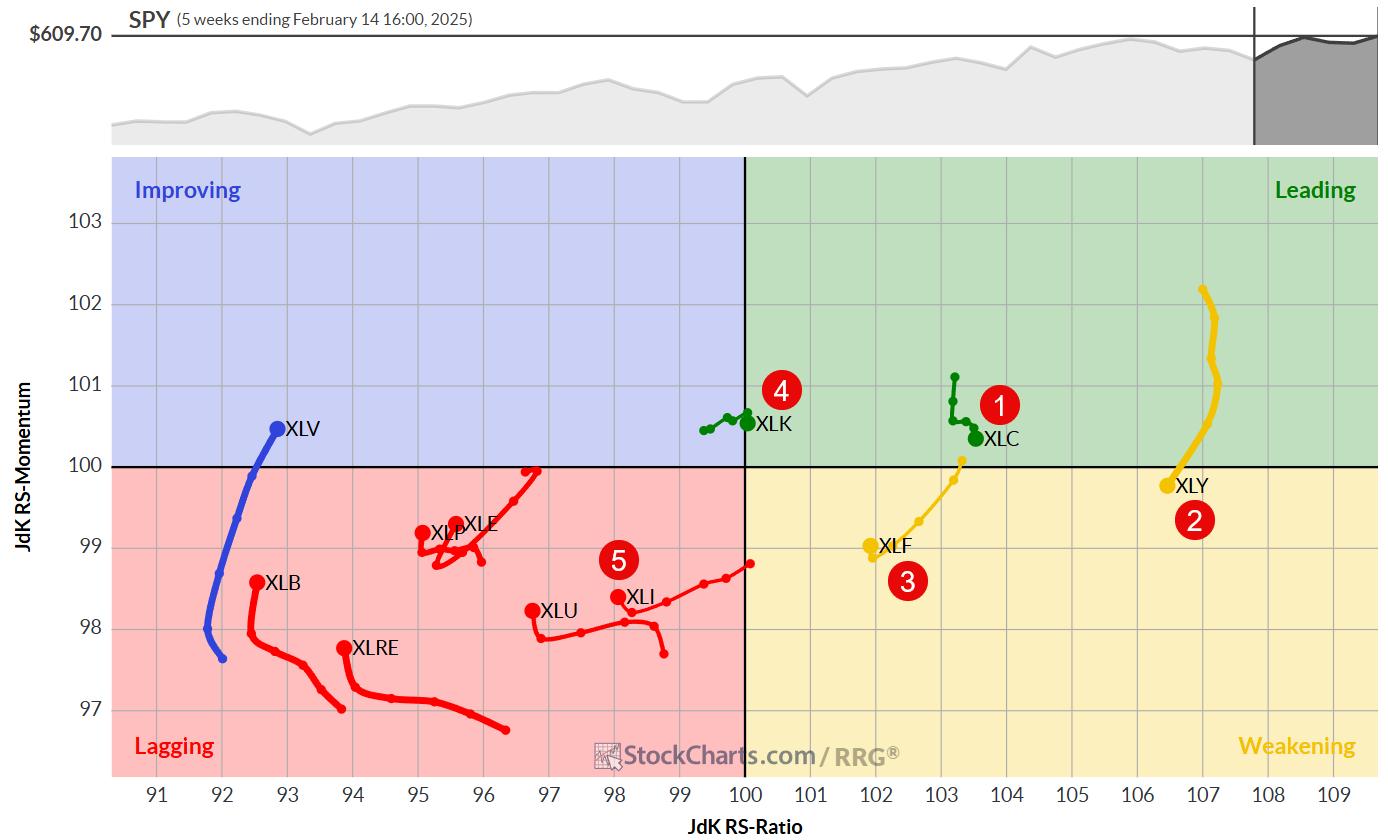
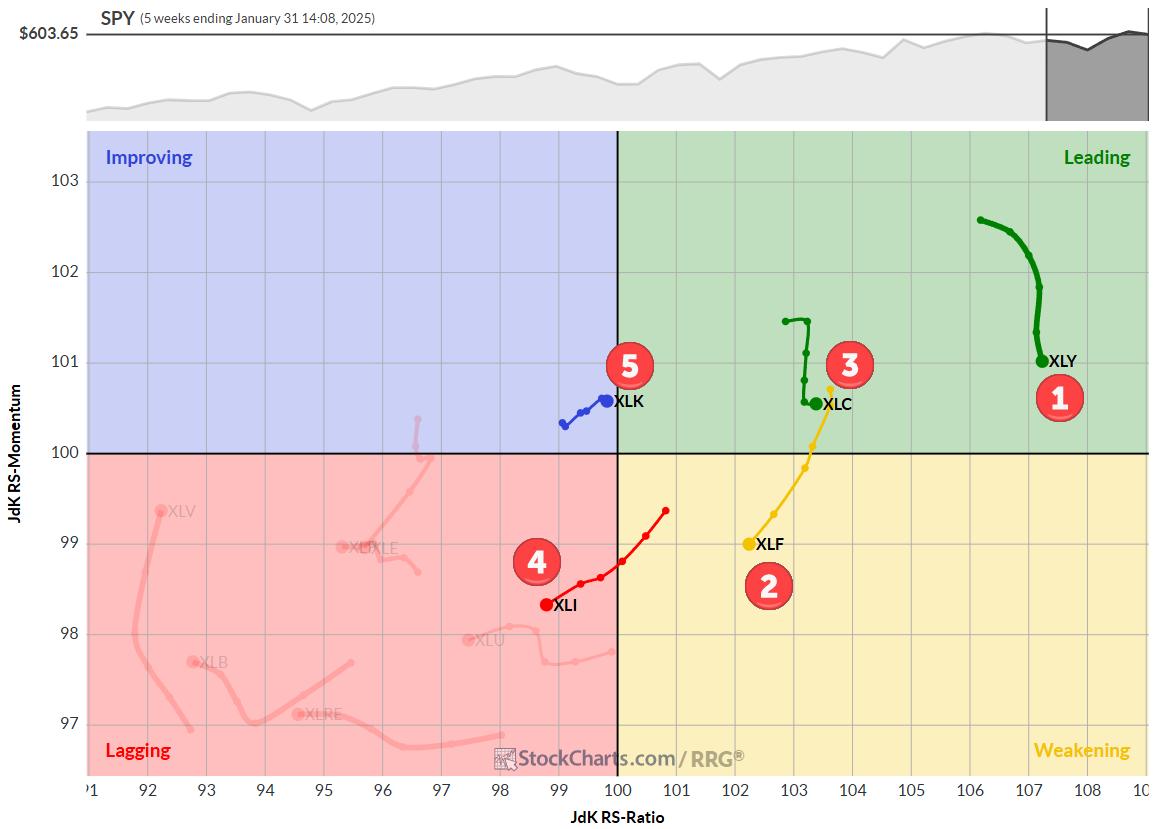
* Communication services (XLC) claims the top spot, pushing consumer discretionary (XLY) to second place
* Technology (XLK) shows strength, moving up to fourth and displacing industrials (XLI)
* Industrials displaying weakness, at risk of dropping out of the top five
* RRG portfolio outperforming SPY benchmark by 69 basis points
Shifting...
READ MORE
MEMBERS ONLY
Master Multiple Timeframe Analysis With This Simple Method
by David Keller,
President and Chief Strategist, Sierra Alpha Research
KEY TAKEAWAYS
* We can use the slope of moving averages, as well as a simple crossover technique, to define trends and identify trend changes.
* Our Market Trend Model uses exponential moving averages, as they are more sensitive to changes in market direction.
* Based on our Market Trend Model, the S&...
READ MORE
MEMBERS ONLY
Double Tops In Bitcoin and the Dollar

by Erin Swenlin,
Vice President, DecisionPoint.com
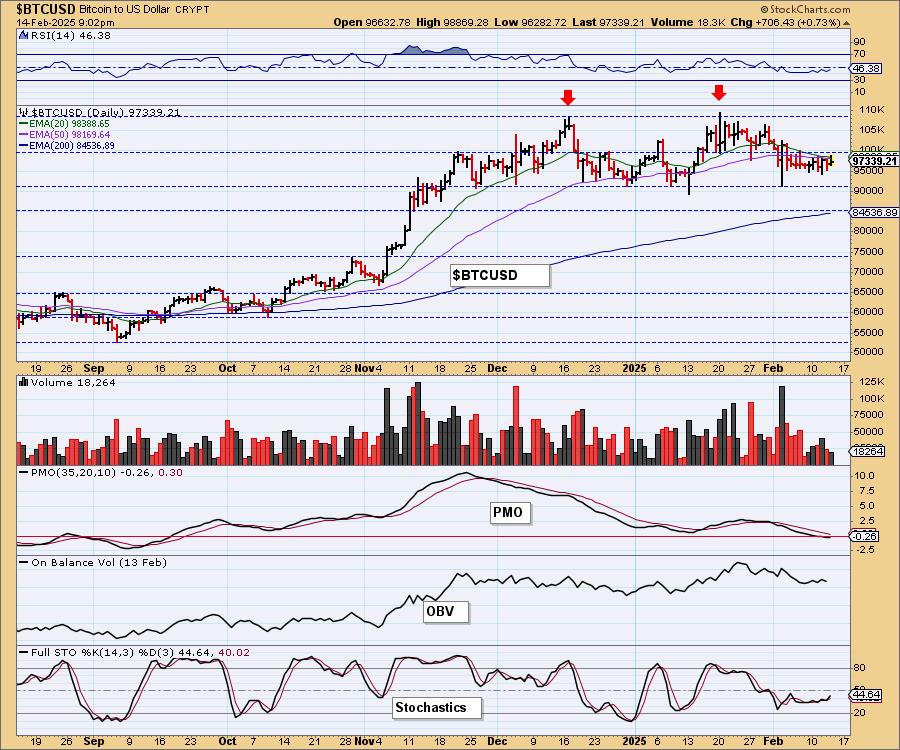
As part of the DP Alert, we cover Bitcoin and the Dollar every market day. We have been watching some bearish indications on both Bitcoin and the Dollar with the double top chart patterns.
On Bitcoin, price has been moving mostly sideways above support at 90,000. This happens to...
READ MORE
MEMBERS ONLY
Market Chaos: How to Spot Bottoming Stocks Before the Rebound
by Karl Montevirgen,
The StockCharts Insider
KEY TAKEAWAYS
* Markets plunged early Wednesday morning following a hotter-than-expected CPI report.
* The Real Estate sector was among those hit hardest.
* These stocks, filtered using a bearish New 52-Week Lows scan, display bottoming opportunities.
Not everyone likes to take a contrarian stance. Most people prefer to move with the market,...
READ MORE
MEMBERS ONLY

Intel's Rising SCTR Score: Why You Should Add This Stock to Your Portfolio
by Jayanthi Gopalakrishnan,
Director of Site Content, StockCharts.com
KEY TAKEAWAYS
* Intel stock has seen strong upside movement for four consecutive days.
* Intel's stock price is hitting its 200-day moving average resistance.
* If INTC stock breaks above its 200-day moving average and its next resistance level, considering accumulating INTC shares in your portfolio.
Intel's stock...
READ MORE
MEMBERS ONLY
Master Trades in Volatile Markets With This 4MA Strategy

by Joe Rabil,
President, Rabil Stock Research
In this exclusive StockCharts video, Joe shows how the 4-day moving average can be useful especially in volatile markets. He explains the advantages of using it in conjunction with the 18-day MA to prevent buying at the wrong time and highlighting when good opportunities appear. He then goes through the...
READ MORE
MEMBERS ONLY

Bearish Divergences Plaguing Former Leadership Names
by David Keller,
President and Chief Strategist, Sierra Alpha Research
KEY TAKEAWAYS
* META and NFLX remain in strong uptrend phases, with limited drawdowns in 2025.
* Four of the Mag7 names can be classified as "broken charts", with recent breakdowns representing an important change of character.
* AMZN and GOOGL offer perhaps the most concerning short-term patterns, with bearish momentum...
READ MORE
MEMBERS ONLY

Why NVDA's Stock Price Shift Could Be Your Gain!
by Jayanthi Gopalakrishnan,
Director of Site Content, StockCharts.com
KEY TAKEAWAYS
* NVDA stock is staying within clear support and resistance levels.
* NVDA's stock price is approaching a position of strength.
* If NVDA's stock sees upside momentum, it may be time to accumulate positions.
Do you remember when NVDA stock had a very high StockCharts Technical...
READ MORE
MEMBERS ONLY
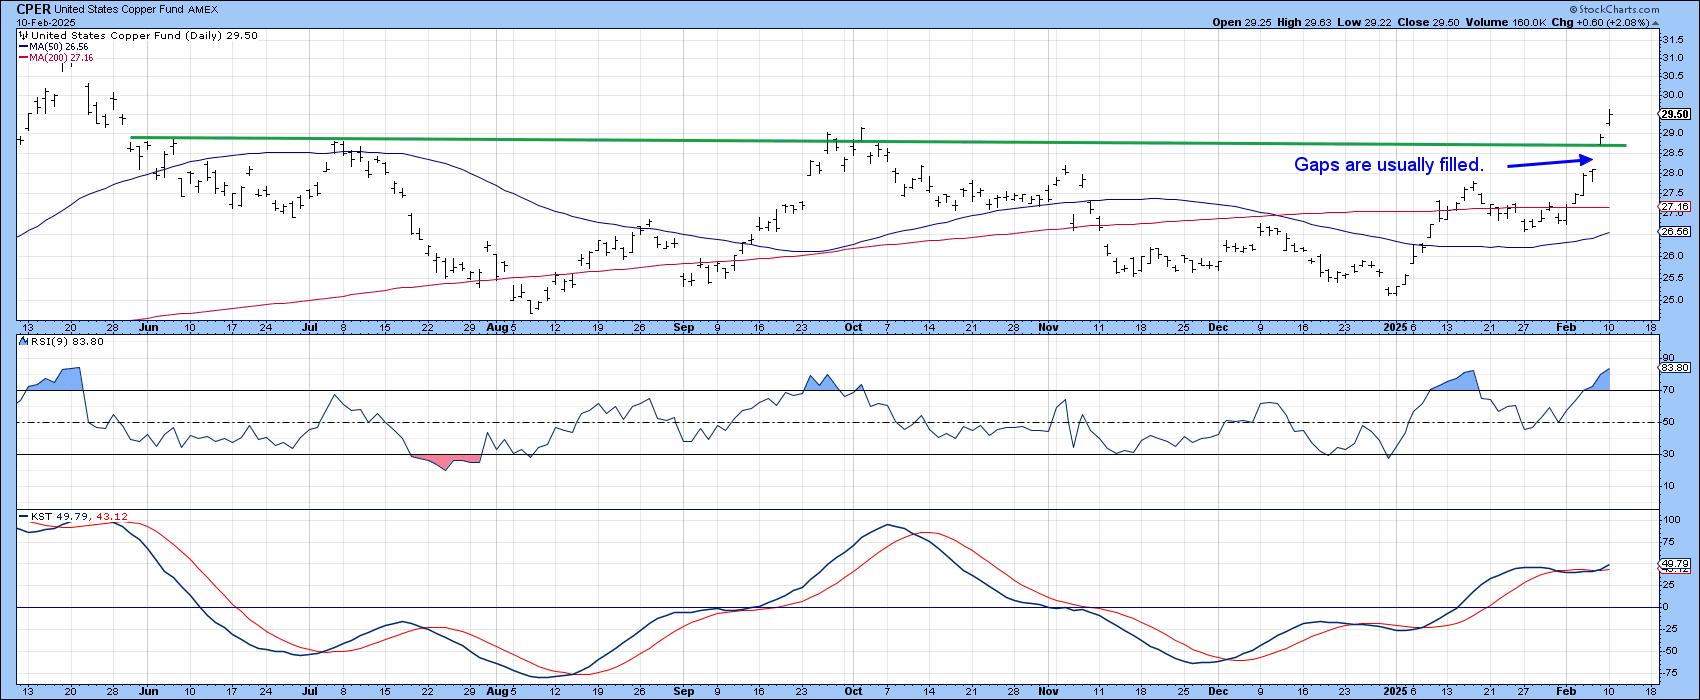
Dr Copper Could Be Close to a Major Breakout. What That Could Mean for the CPI

by Martin Pring,
President, Pring Research
The nickname "Dr. Copper" comes from its reputation as a reliable economic indicator. That's because it is used worldwide in a wide range of industries, including construction, electronics, and manufacturing. When demand for the red metal is high, it often signals that these industries are booming,...
READ MORE
MEMBERS ONLY

DP Trading Room: Gold Hits Another All-Time High
by Erin Swenlin,
Vice President, DecisionPoint.com
The market rebounded to start trading on Monday, but indicators on Friday suggest internal weakness. Carl gives us his latest analysis on the market as well as taking a look at Gold which is making more all-time highs. Get Carl's perspective on the Gold rally.
Besides looking at...
READ MORE
MEMBERS ONLY
The Best Five Sectors, #6
by Julius de Kempenaer,
Senior Technical Analyst, StockCharts.com
KEY TAKEAWAYS
* Top-5 remains unchanged
* Healthcare and Staples jump to higher positions
* Price and Relative trends remain strong for XLC and XLF
No Changes In Top-5
At the end of the week ending 2/7, there were no changes in the top-5, but there have been some significant shifts in...
READ MORE
MEMBERS ONLY
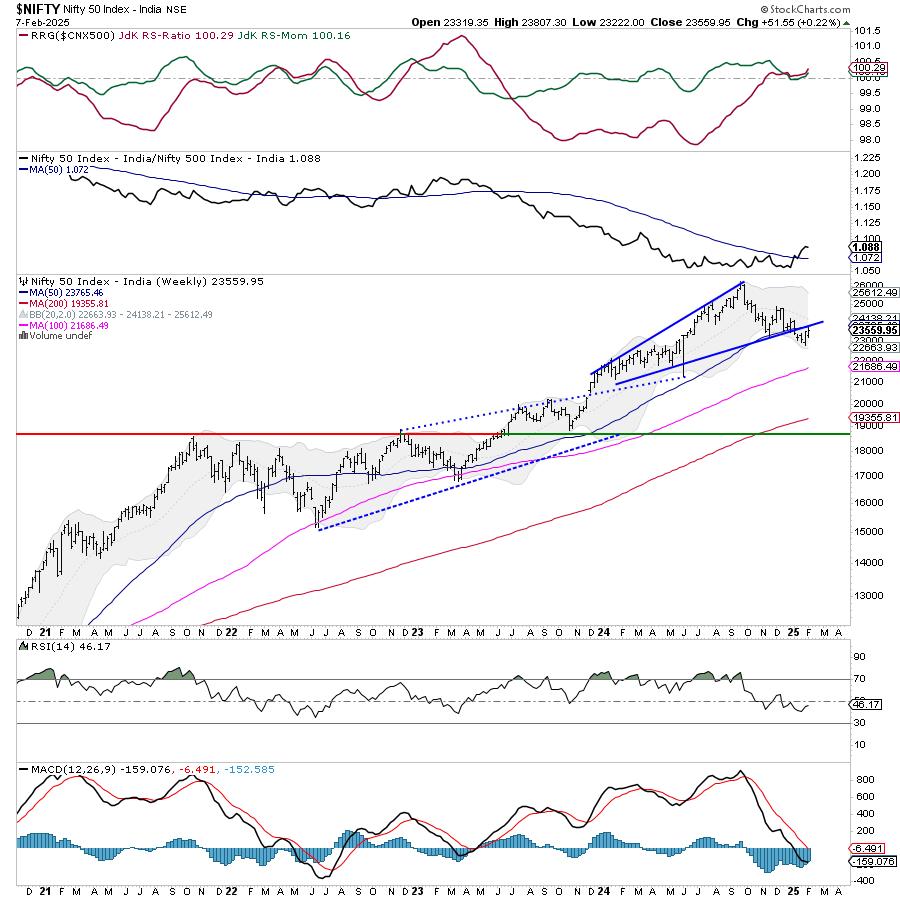
Week Ahead: NIFTY Stares at Crucial Support; RRG Hints at Defensive & Risk-Off Setups

by Milan Vaishnav,
Founder and Technical Analyst, EquityResearch.asia and ChartWizard.ae
In what can be called an indecisive week for the markets, the Nifty oscillated back and forth within a given range and ended the week on a flat note. Over the past five sessions, the Nifty largely remained within a defined range. While it continued resisting the crucial levels, it...
READ MORE
MEMBERS ONLY
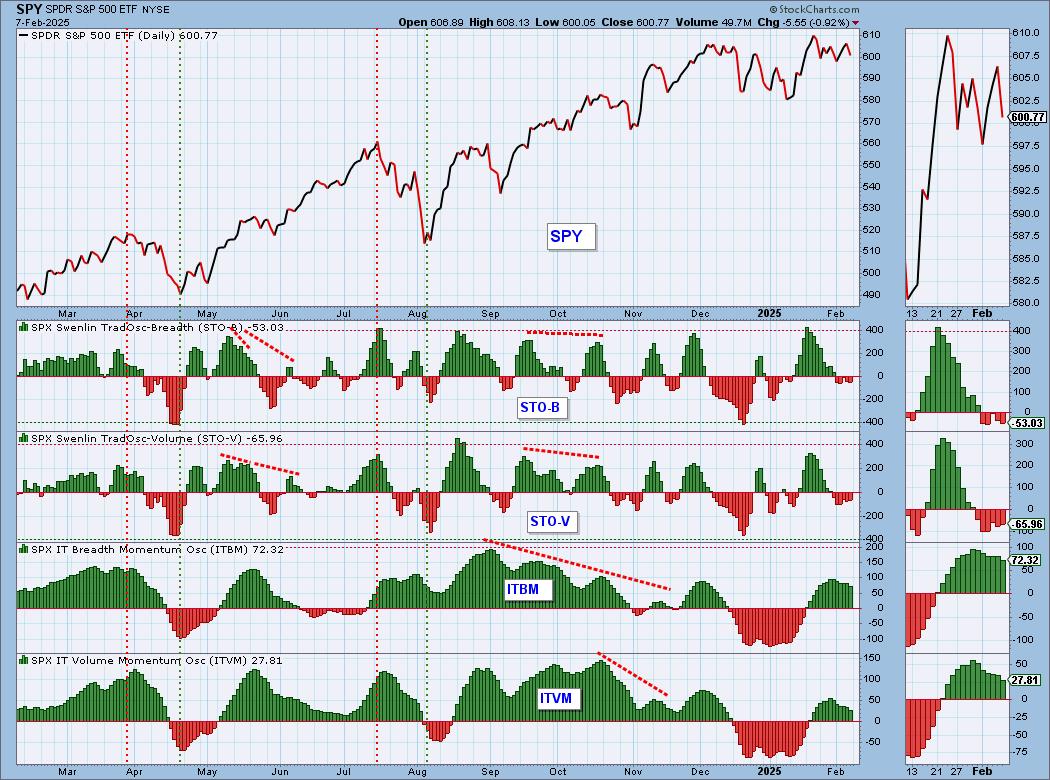
IT Breadth Momentum (ITBM) and IT Volume Momentum (ITVM) Top - Participation Draining
by Erin Swenlin,
Vice President, DecisionPoint.com
We are currently in a declining trend in the market and internals are telling us that this weakness will continue to be a problem. Our primary indicators in the short- and intermediate-term have topped with one exception. The Swenlin Trading Oscillators (STOs) started down on Thursday and the STO-B continued...
READ MORE
MEMBERS ONLY

Hotel Stocks Spike: Why You Should Add These Stocks to Your Portfolio
by Jayanthi Gopalakrishnan,
Director of Site Content, StockCharts.com
KEY TAKEAWAYS
* Hilton's strong quarterly earnings sent hotel stocks surging.
* The StockCharts Technical Rank score indicates the hotel industry is technically strong.
* If hotel stocks continue to trend higher, consider adding these stocks to your portfolio.
When you think travel industry, airline and cruise line stocks are usually...
READ MORE
MEMBERS ONLY
Missed Amgen's 5% Surge? Here's What You Need to Know Now!
by Karl Montevirgen,
The StockCharts Insider
KEY TAKEAWAYS
* Amgen's stock surged dramatically despite recent challenges.
* The stock has been underperforming its key industries and broader sector for over a year.
* Key support and resistance levels will determine whether Amgen's bullish reversal can be sustained.
On Wednesday morning, the markets wavered, with cautious...
READ MORE
MEMBERS ONLY

The BEST Simple Moving Average Trading Strategy
by Joe Rabil,
President, Rabil Stock Research
In this exclusive StockCharts video, Joe presents a trading strategy using the simple moving average. Explaining what to watch and how it can tell you what timeframe to trade, he shares how to use it in multiple timeframes. Joe covers the QQQ and IWM and explains the levels to monitor...
READ MORE
MEMBERS ONLY
Watch For These Seasonality Patterns in 2025
by Julius de Kempenaer,
Senior Technical Analyst, StockCharts.com
In this exclusive StockCharts video,Julius shares a new approach to seasonality by using a more granular, data-set constructed UDI (User Defined Index) for every sector. Using the UDI functionality on StockCharts.com allows Julius to plot the seasonal patterns for each sector forward to the end of 2025 and...
READ MORE
MEMBERS ONLY
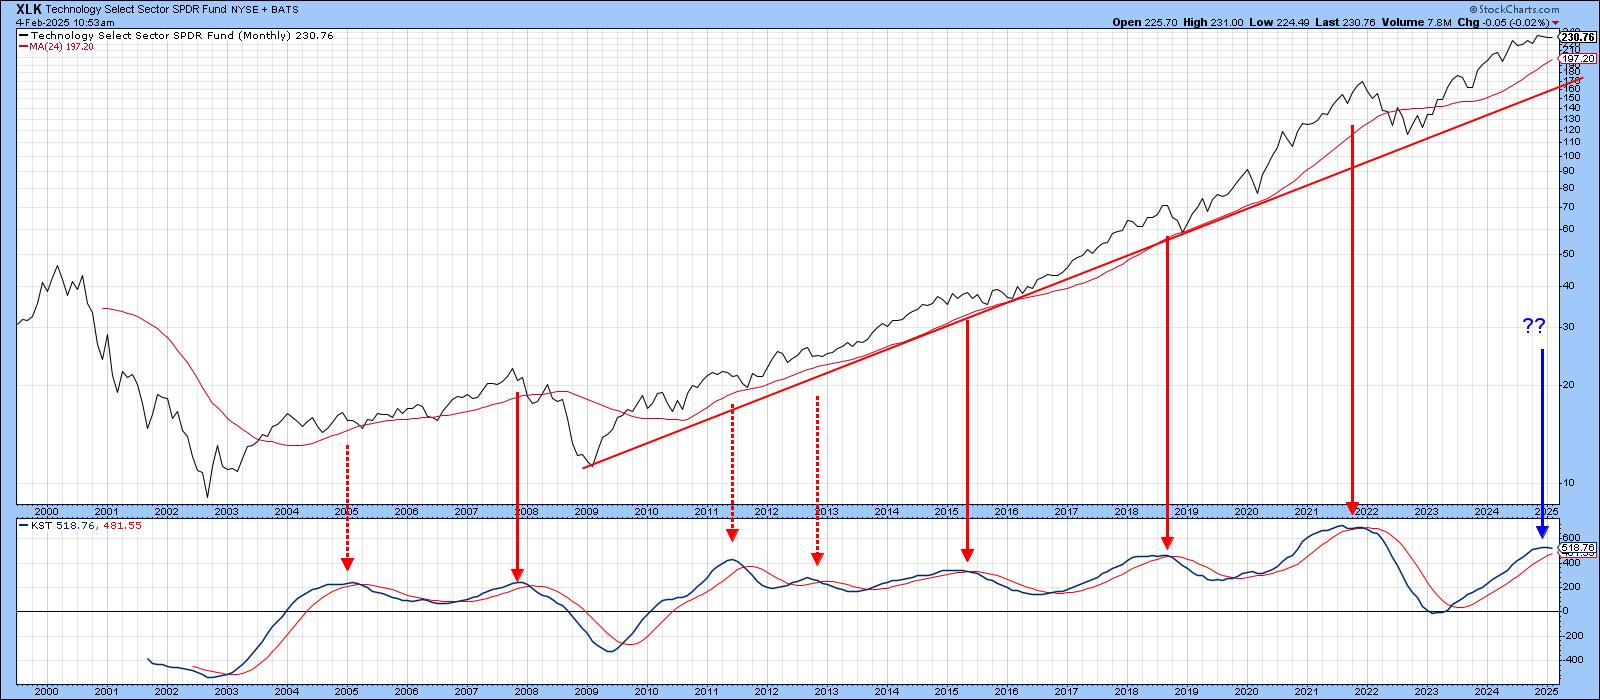
Forget Technology and Take a Look at This Sector
by Martin Pring,
President, Pring Research
Technology stocks, in the form of the SPDR Technology ETF (XLK), have been on a tear since their secular low in 2009. That strength has not only resulted in higher absolute prices, but also striking relative action.
Chart 1 compares the XLK to its long-term KST. Reversals in this indicator...
READ MORE
MEMBERS ONLY

Walmart, Costco, and Sprouts: The Ultimate Trade War Survivors?
by Karl Montevirgen,
The StockCharts Insider
KEY TAKEAWAYS
* A breakout above resistance in Costco's stock price could see the stock move higher.
* Walmart's stock price continues to trend higher, but volume and momentum may be giving.
* Sprouts Farmers Markets Inc. has the momentum to take the stock price higher.
Monday's...
READ MORE
MEMBERS ONLY

DP Trading Room: Tariff Trepidation
by Erin Swenlin,
Vice President, DecisionPoint.com
Trading is being affected by the scare of a trade war. With new tariffs being placed on Mexico, Canada and China, the market fell heavily on Friday. The same was occurring this morning, but then the tariff on Mexico was delayed by one month which helped the market breathe a...
READ MORE
MEMBERS ONLY
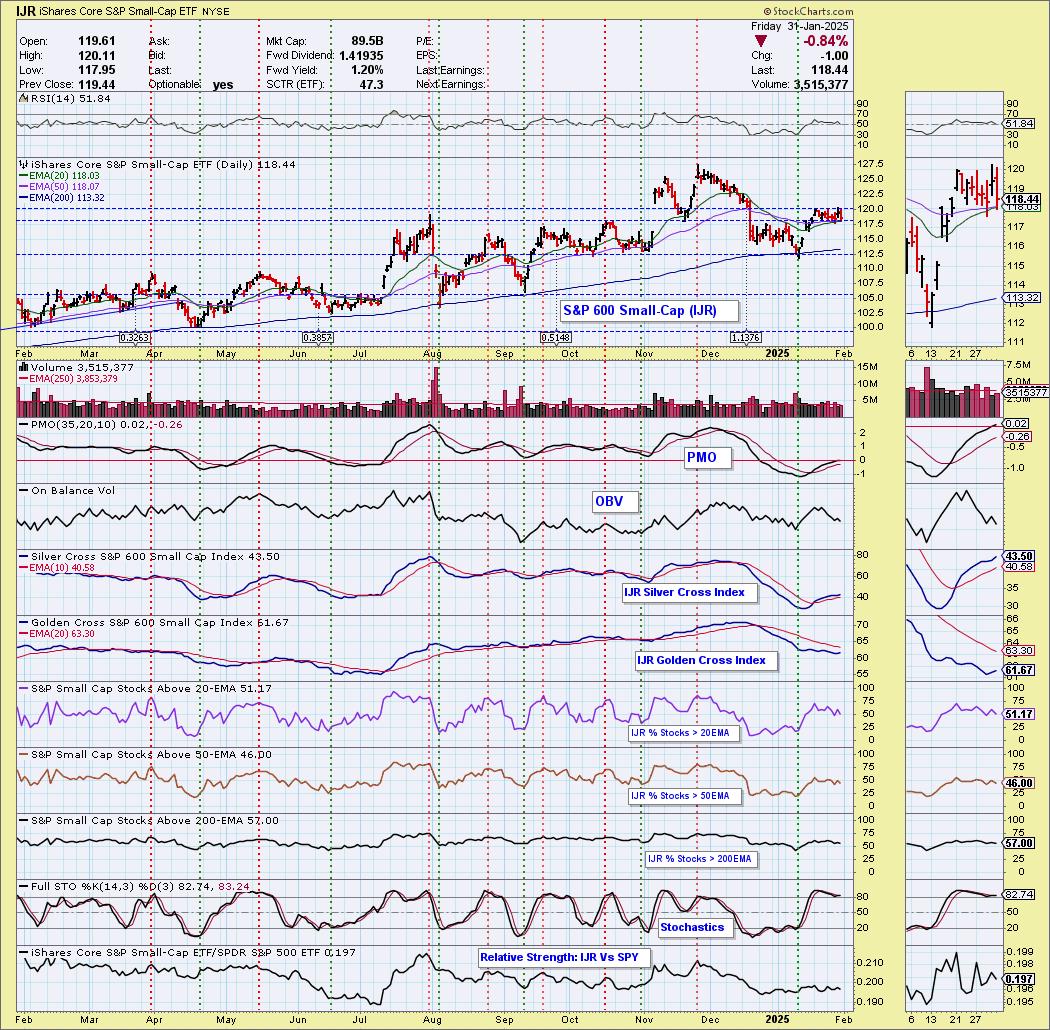
S&P 600 (IJR) Silver Cross BUY Signal May Arrive Too Late
by Erin Swenlin,
Vice President, DecisionPoint.com
Today on the S&P 600 (IJR), the 20-day EMA nearly crossed above the 50-day EMA for a "Silver Cross" IT Trend Model BUY Signal. Price is really going nowhere. Bulls might look at it as a bull flag, but the 'flag' is horizontal, not...
READ MORE
MEMBERS ONLY
The Best Five Sectors, #5
by Julius de Kempenaer,
Senior Technical Analyst, StockCharts.com
KEY TAKEAWAYS
* Technology (XLK) re-enters top 5 sectors, displacing Energy (XLE)
* Consumer Discretionary (XLY) maintains #1 position
* Weekly and daily RRGs show supportive trends for leading sectors XLY and XLC
* Top-5 portfolio outperforms S&P 500 by nearly 50 basis points
Technology Moves Back into Top-5
As we wrap...
READ MORE
MEMBERS ONLY

Quantum Computing Stocks You NEED to See
by Joe Rabil,
President, Rabil Stock Research
In this exclusive StockCharts video, Joe shares the details of his favorite MACD setup. Joe then covers NVDA, and cryptocurrencies, before covering which Quantum Computing stocks look the best right now, including IONQ and RGTI. Finally, he goes through the symbol requests that came through this week, including AAPL, COIN,...
READ MORE
MEMBERS ONLY

AI Stocks and Their Impact on the Stock Market: Hype or Reality?
by Jayanthi Gopalakrishnan,
Director of Site Content, StockCharts.com
KEY TAKEAWAYS
* The release of an efficient and cost-effective AI sent waves through the stock market.
* After the initial reaction, Wall Street reassessed the situation and stocks like NVDA recovered.
* The price action of the broader indexes suggests the bullish sentiment hasn't gone away.
The week started with...
READ MORE
MEMBERS ONLY
Snowflake and Twilio Stocks are Surging: Here's What to Do Now!
by Karl Montevirgen,
The StockCharts Insider
KEY TAKEAWAYS
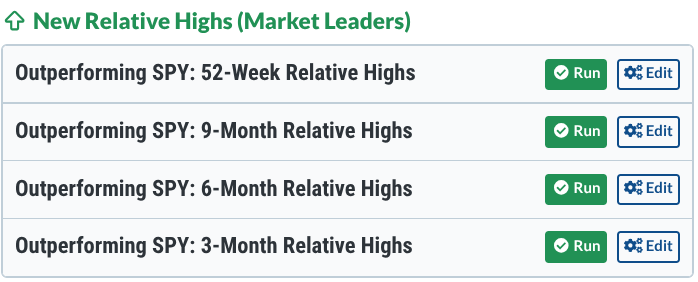
* SNOW and TWLO stocks are outperforming the market based on a three-month relative highs scan.
* Both stocks show bullish momentum, but conflicting volume signals suggest caution.
* Monitor the key support and resistance levels for potential trade opportunities.
While StockCharts offers numerous tools you can use to find top...
READ MORE
MEMBERS ONLY
Some Silver Linings Following a Day of AI Panic
by Martin Pring,
President, Pring Research
I woke up this morning noting that NASDAQ futures had been down nearly 1,000 points at their overnight intraday low. Later, I tuned into a couple of general purpose, as opposed to financial, cable news channels. They, too, were talking about the sell-off and its rationale. I began to...
READ MORE
MEMBERS ONLY

What's NEXT for Semiconductors After Monday's SHOCKING Drop?
by David Keller,
President and Chief Strategist, Sierra Alpha Research
In this video, Dave reviews the VanEck Semiconductor ETF (SMH) from a technical analysis perspective. He focuses on the recent failure at price gap resistance, the breakdown below price and moving average support, and the frequent appearance of bearish engulfing patterns which have often indicated major highs over the last...
READ MORE
MEMBERS ONLY
The Best Five Sectors, #4
by Julius de Kempenaer,
Senior Technical Analyst, StockCharts.com
KEY TAKEAWAYS
* No changes in top-5 sectors
* XLC showing strong break from consolidation flag
* XLE remains just barely above XLK as a result of strong daily RRG
No changes in the top-5
At the end of this week, there were no changes in the ranking of the top-5 sectors.
1....
READ MORE
MEMBERS ONLY
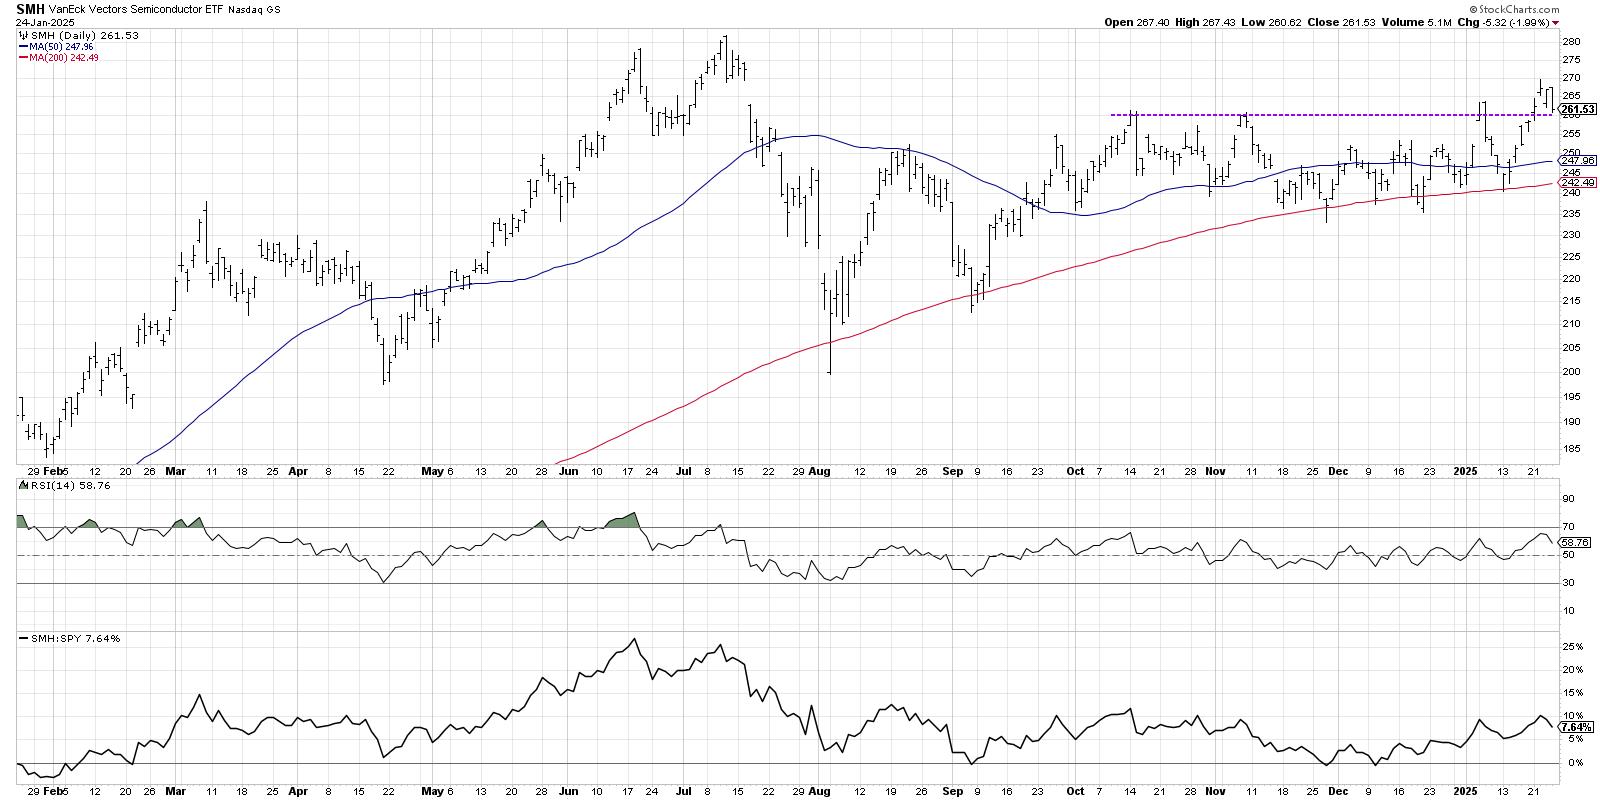
Semiconductors Have More to Prove Before Breakout is Believed
by David Keller,
President and Chief Strategist, Sierra Alpha Research
KEY TAKEAWAYS
* The VanEck Vectors Semiconductor ETF (SMH) broke out of a six-month base this week, suggesting further upside potential.
* While the breakout in SMH appears bullish, the ETF still has yet to eclipse a key price gap from July 2025.
* A bearish engulfing pattern to end the week indicates...
READ MORE
MEMBERS ONLY

Investors are Pouring Into Gold Miners—Here's What You Need to Know!
by Karl Montevirgen,
The StockCharts Insider
KEY TAKEAWAYS
* There's a renewed interest in gold mining stocks.
* Does gold outperforming miners signal an increase in mining activity and profitability?
* Miners are at a critical turning point, and the key levels discussed can help you assess whether the trend will turn bullish or bearish.
Gold mining...
READ MORE
MEMBERS ONLY
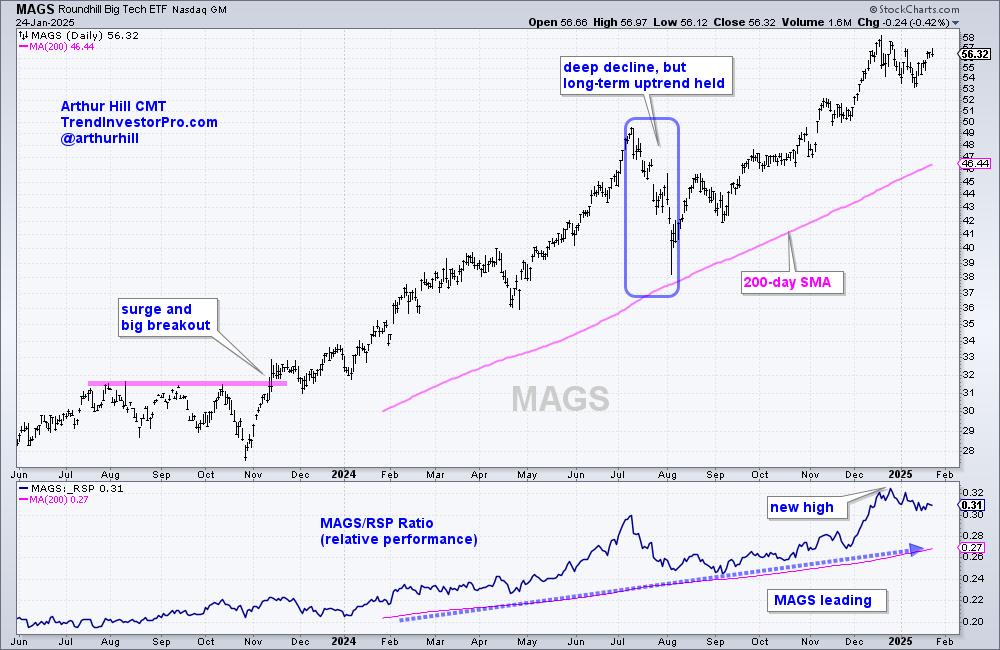
Mag7 ETF Leads as Bullish Pattern Forms - Charting the Trends and Trading Setups for the Mag7 Stocks

by Arthur Hill,
Chief Technical Strategist, TrendInvestorPro.com
KEY TAKEAWAYS
* The Mag7 ETF (MAGS) is outperforming the market and in a strong uptrend.
* MAGS broke out of a short-term bullish continuation pattern this week.
* Nvidia, Tesla, Amazon and Meta are powering MAGS higher.
The Mag7 ETF (MAGS) formed another short-term bullish continuation pattern as it worked its way...
READ MORE
MEMBERS ONLY

Biotechs Looking Up - Two Stocks To Take Advantage
by Erin Swenlin,
Vice President, DecisionPoint.com
The Biotech industry group is making a comeback, with the 'under the hood' chart displaying new strength coming into the group. We have a constructive bottom that price is breaking from and, while it does need to overcome resistance at the 200-day EMA, it looks encouraging. What was...
READ MORE
MEMBERS ONLY
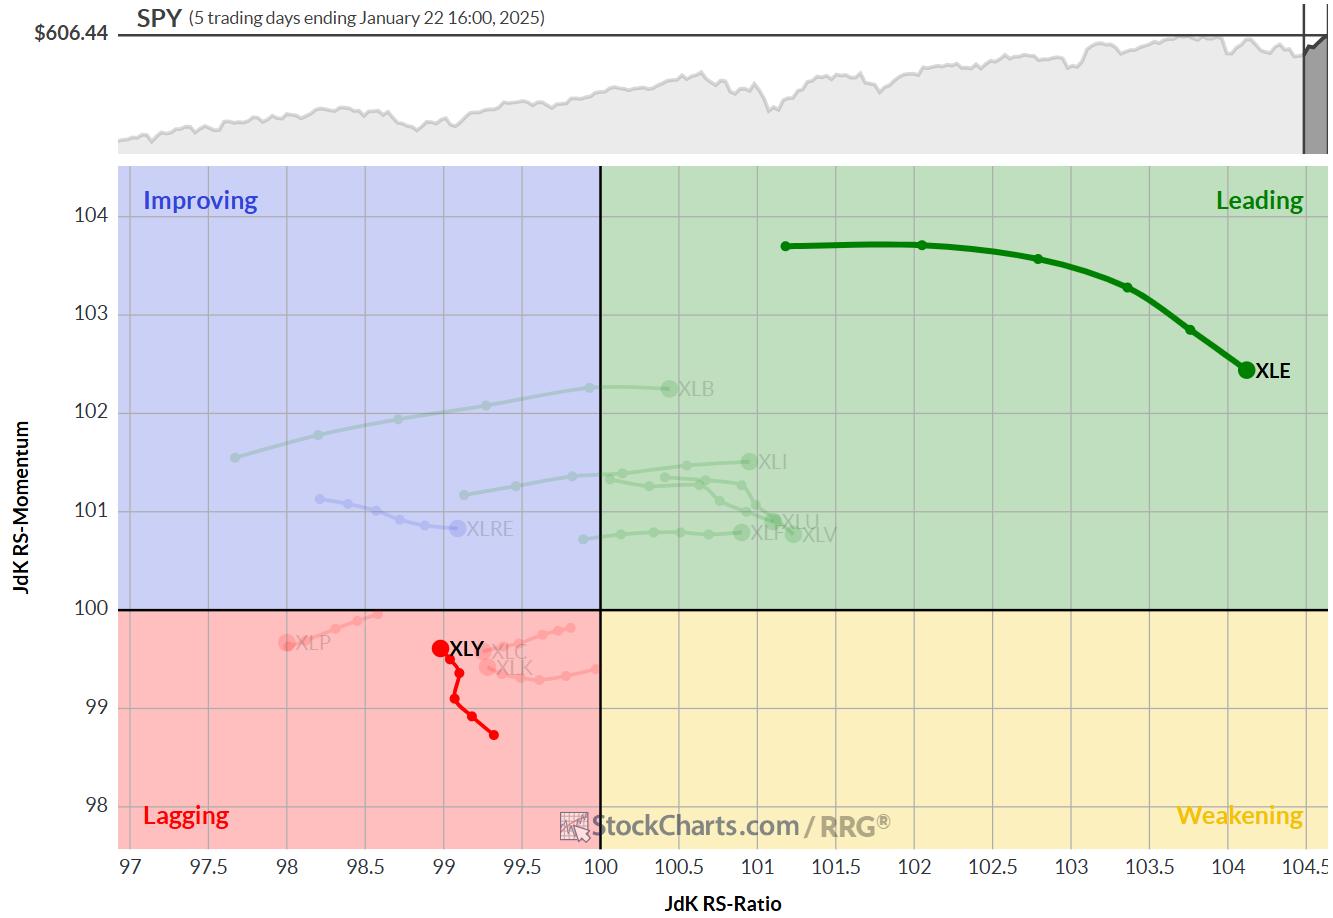
Energy Picks Up and Consumer Discretionary Continues to Lead
by Julius de Kempenaer,
Senior Technical Analyst, StockCharts.com
KEY TAKEAWAYS
* Short term strength drags enery sector up
* Long term strength keeps consumer discretionary on top
* Massive upside potential ready to get unlocked in EOG
I have been traveling in the US since 1/15 and attended the CMTA Mid-Winter retreat in Tampa, FL 1/16-1/17 and then...
READ MORE
MEMBERS ONLY

Discover the BEST Way to Spot TREND CHANGES
by Joe Rabil,
President, Rabil Stock Research
In this exclusive StockCharts video, Joe demonstrates how to use the 1-2-3 reversal pattern as a buy signal on the weekly chart. This approach can be used when the monthly chart is in a strong position. Joe shares how to use MACD and ADX to help when the trendline pattern...
READ MORE
MEMBERS ONLY

Cisco Systems' Stock Keeps Hitting All-Time Highs: Investment Tips to Maximize Your Success
by Jayanthi Gopalakrishnan,
Director of Site Content, StockCharts.com
KEY TAKEAWAYS
* Cisco Systems' stock has made substantial investments in AI, which has helped the stock rally higher.
* CSCO's stock price has been making all-time highs recently and is worth monitoring.
* Look for a pullback and reversal with strong momentum before entering a long position.
When you...
READ MORE
MEMBERS ONLY

Stocks are Facing an Important Test
by Martin Pring,
President, Pring Research
I have been expecting a bull market correction for about a month, but it's not been as deep as I expected. Now, however, several indexes have completed small bullish two-bar reversal patterns on the weekly charts. If they work, that would be a characteristic of a bull market,...
READ MORE
MEMBERS ONLY

The Best Five Sectors, #3
by Julius de Kempenaer,
Senior Technical Analyst, StockCharts.com
KEY TAKEAWAYS
* Energy replaces Technology in top-5
* Financials rise to #2 position pushing XLC down to #3
* Top-5 portfolio out-performs SPY 0.52%
* A closer look at the (equal) weighting scheme
Energy Replaces Technology
At the end of this week, 1/17/2024, the Technology sector dropped out of the...
READ MORE