MEMBERS ONLY
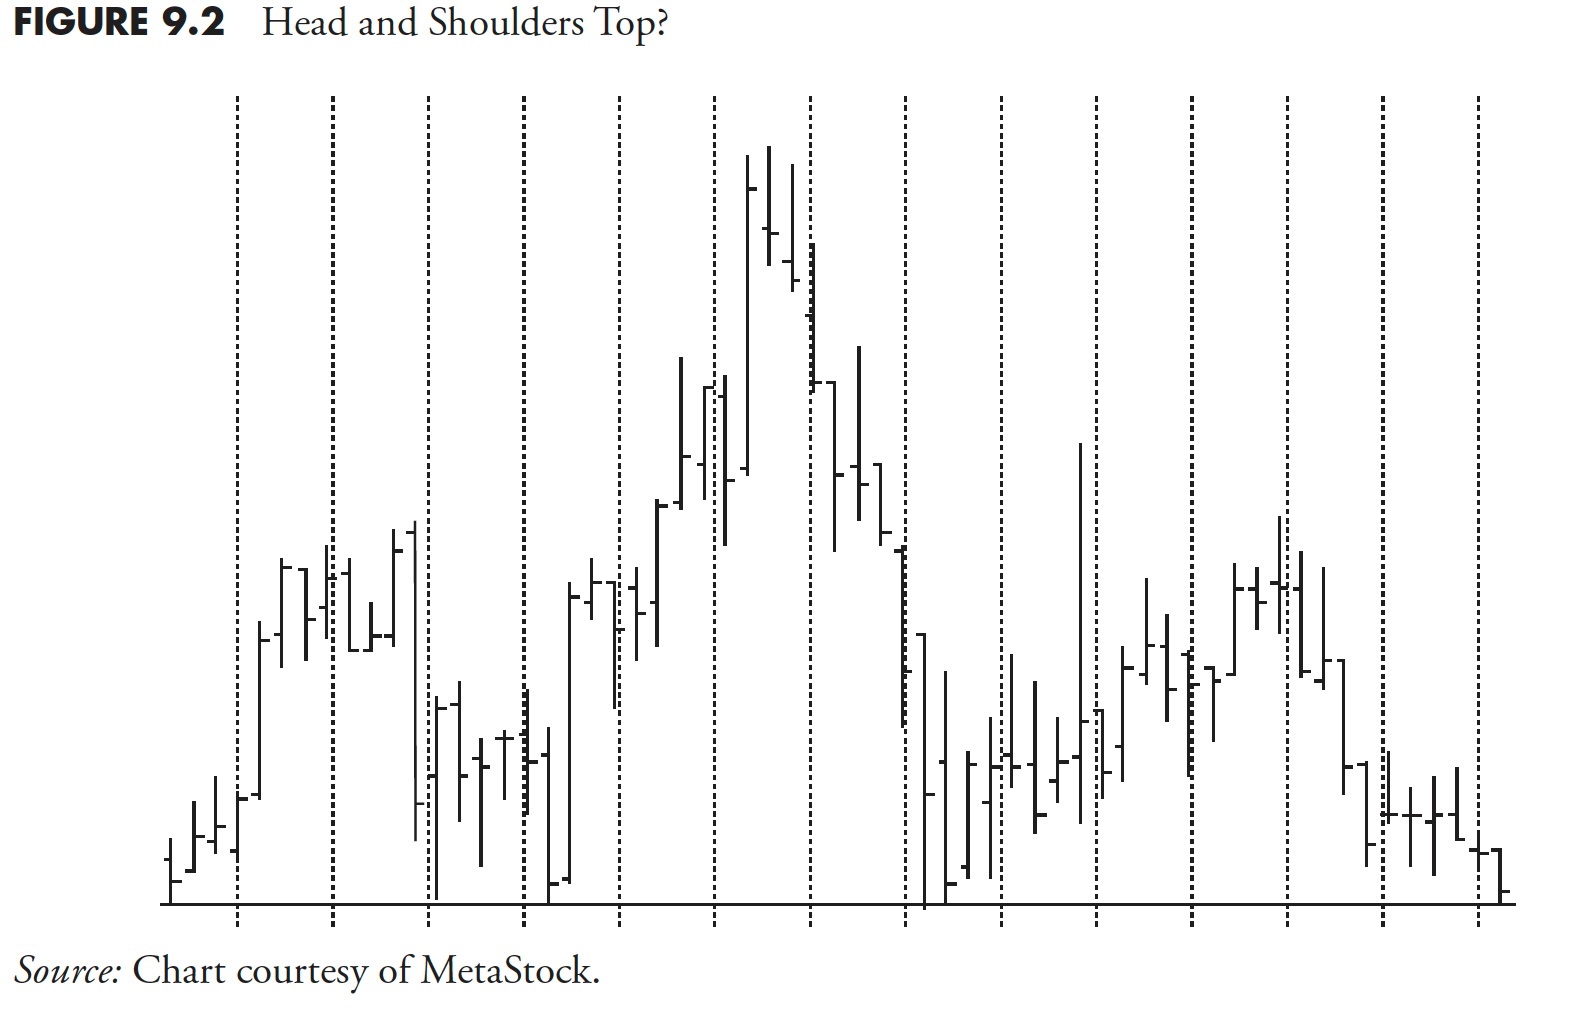
Market Research and Analysis - Part 2: Using Technical Indicators

by Greg Morris,
Veteran Technical Analyst, Investor, and Author
Note to the reader: This is the thirteenth in a series of articles I'm publishing here taken from my book, "Investing with the Trend." Hopefully, you will find this content useful. Market myths are generally perpetuated by repetition, misleading symbolic connections, and the complete ignorance of...
READ MORE
MEMBERS ONLY
Coinbase Stock Didn't Crash, But the Trade Still Raked in Cash

by Karl Montevirgen,
The StockCharts Insider
KEY TAKEAWAYS
* Technical indicators suggested that Coinbase stock was due for a pullback
* The scenario identified a clear short setup with multiple price targets and stop-loss levels
* Coinbase eventually dipped but the risk may have been greater than the reward
As a trader, calling market tops (or bottoms) is...
READ MORE
MEMBERS ONLY
Downside Risk in a Bullish Market

by David Keller,
President and Chief Strategist, Sierra Alpha Research
In this edition of StockCharts TV'sThe Final Bar, Dave welcomes guest Chris Ciovacco of Ciovacco Capital Management. David focuses on downside risk for GOOGL and AMZN, and shares one utility name that should be on your radar! Chris updates a weekly S&P 500 chart he first...
READ MORE
MEMBERS ONLY
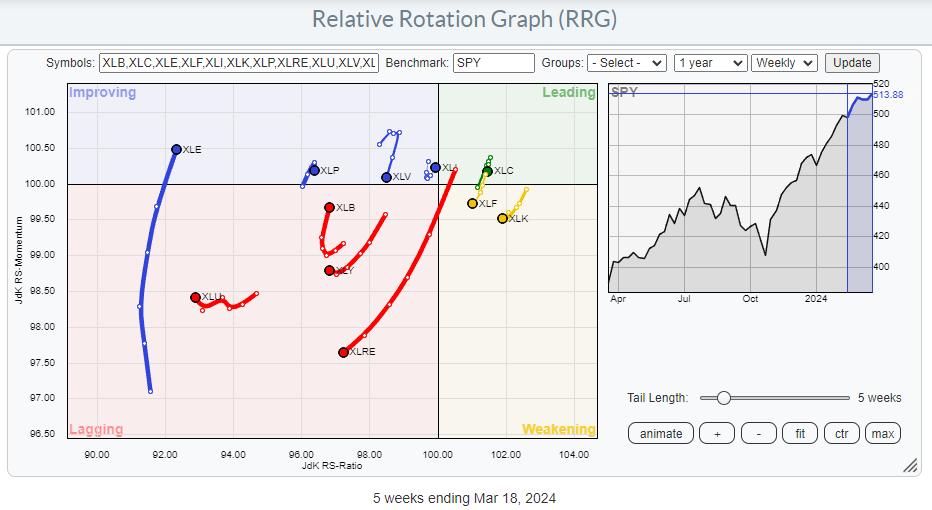
Energy: A Long-Term Turnaround in Relative Strength is Brewing

by Julius de Kempenaer,
Senior Technical Analyst, StockCharts.com
KEY TAKEAWAYS
* Energy sector showing relative strength in three timeframes
* The sector is nearing a heavy resistance area
* A long-term turnaround in relative strength appears to be underway
Energy Improving in Three Time Frames
Watching the sector rotation at the start of this week shows a continued improvement for...
READ MORE
MEMBERS ONLY

DP Trading Room: Use a Price Momentum Oscillator (PMO) Sort to Find Winners!

by Erin Swenlin,
Vice President, DecisionPoint.com
Today Carl and Erin open the show with an example of how you can find stock and ETF relative strength using a Price Momentum Oscillator (PMO) sort. Many may not know but PMO readings can be compared to one another to determine relative strength.
Carl gives us a review of...
READ MORE
MEMBERS ONLY
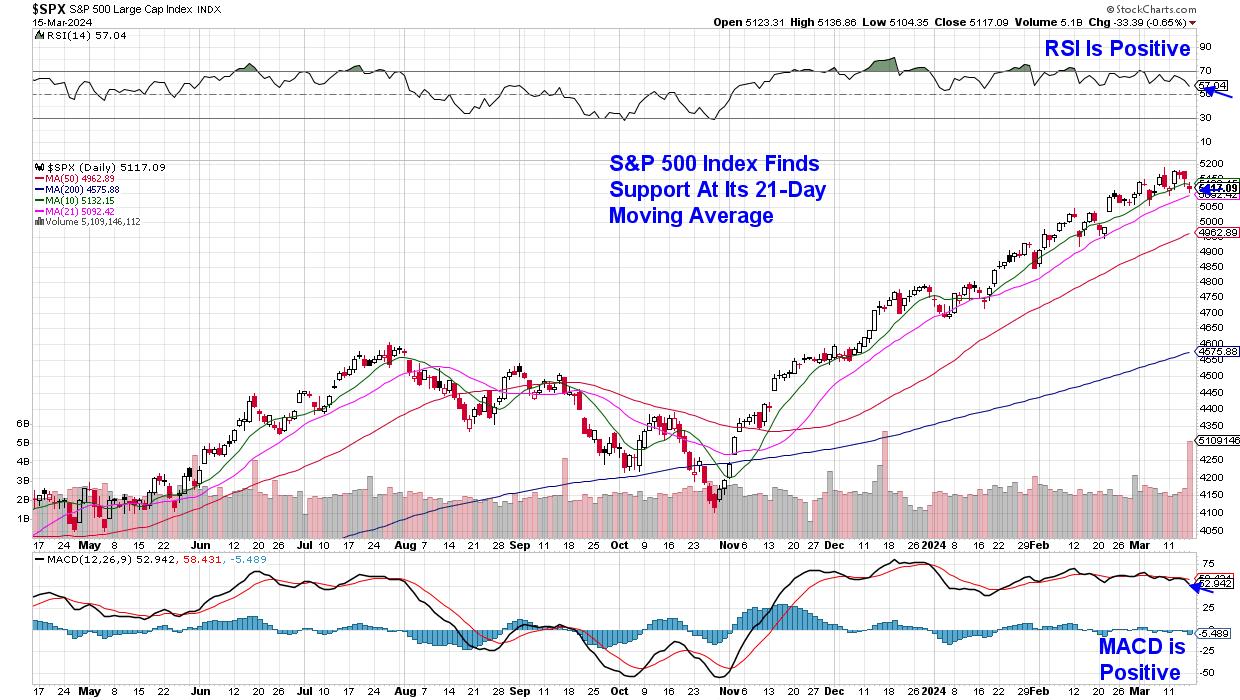
How To Profit From Bullish Gap-Down Reversals

by Mary Ellen McGonagle,
President, MEM Investment Research
The S&P 500 ended the week with a slight pullback that has this Index closing below its key 10-day simple moving average, but above its 21-day moving average. With the RSI and MACD in positive territory, the near-term uptrend in this Index remains in place....
READ MORE
MEMBERS ONLY
Stop Trading In The WRONG DIRECTION With This Simple Rule

by Grayson Roze,
Chief Strategist, StockCharts.com
On this week's edition of StockCharts TV'sStockCharts in Focus, Grayson shares a little trick out of his own process to make sure he's trading in the right direction. If you find yourself buying a new stock only to watch it go down, down, down...
READ MORE
MEMBERS ONLY
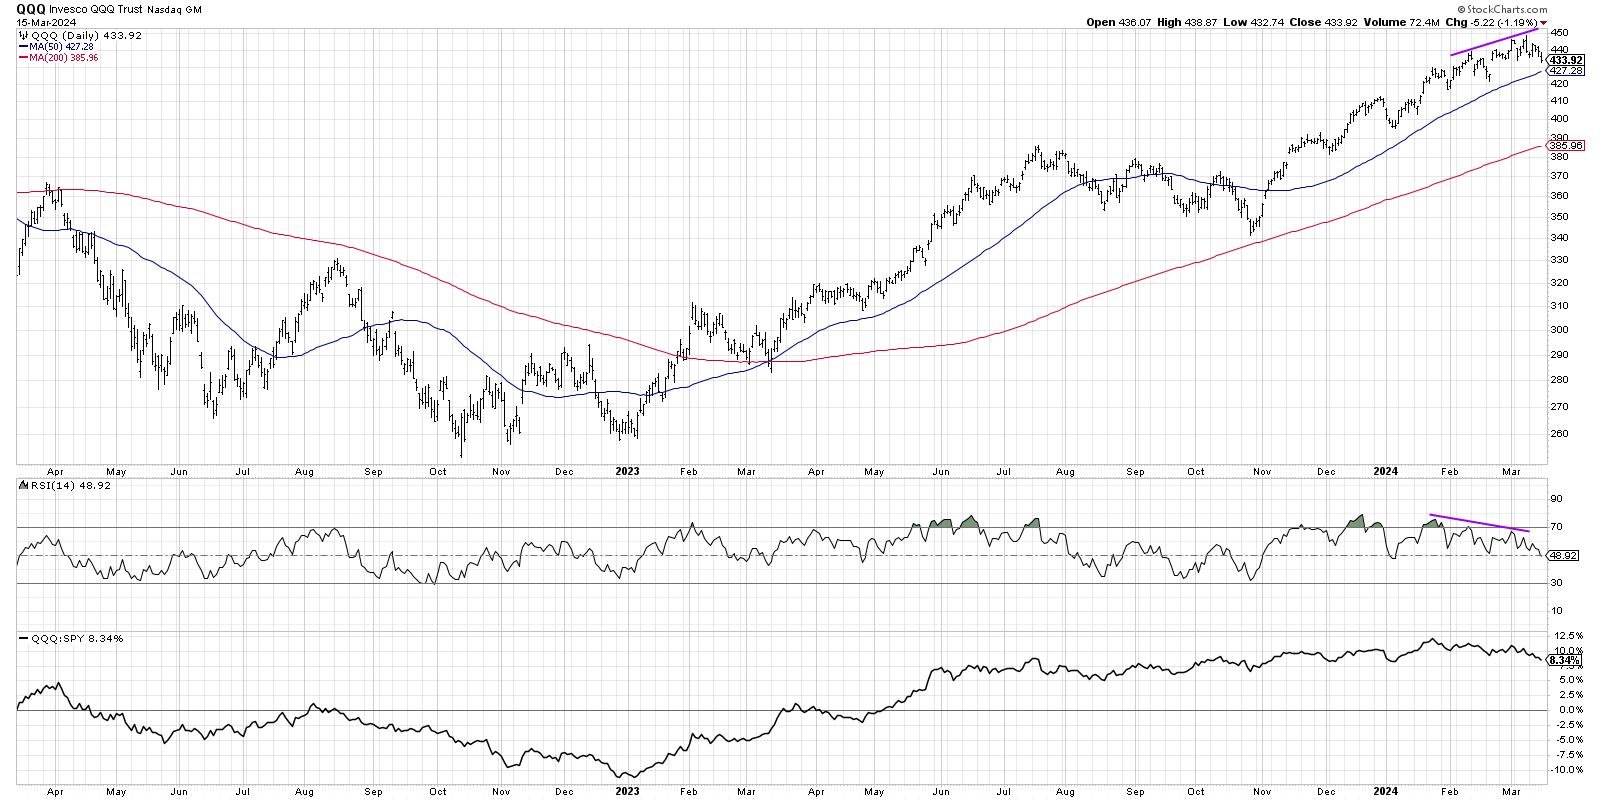
What's the Downside Risk for QQQ?
by David Keller,
President and Chief Strategist, Sierra Alpha Research
KEY TAKEAWAYS
* A bearish momentum divergence and declining Bullish Percent Index suggests rough waters ahead for the QQQ.
* The 50-day moving average and Chandelier Exit system can serve as trailing stops to lock in gains from the recent uptrend.
* If stops are broken, we can use Fibonacci Retracements to...
READ MORE
MEMBERS ONLY
Spot The Warning Signs of Bankruptcy!
by David Keller,
President and Chief Strategist, Sierra Alpha Research
In this edition of StockCharts TV'sThe Final Bar, Dave presents an in-depth discussion on technical analysis patterns, market trends, and risk management. Explore how to spot bankruptcy risks, candlestick patterns, Dave's approach to QQQ, optimizing the Market Trend Model, RSI and MACD signals, "master...
READ MORE
MEMBERS ONLY
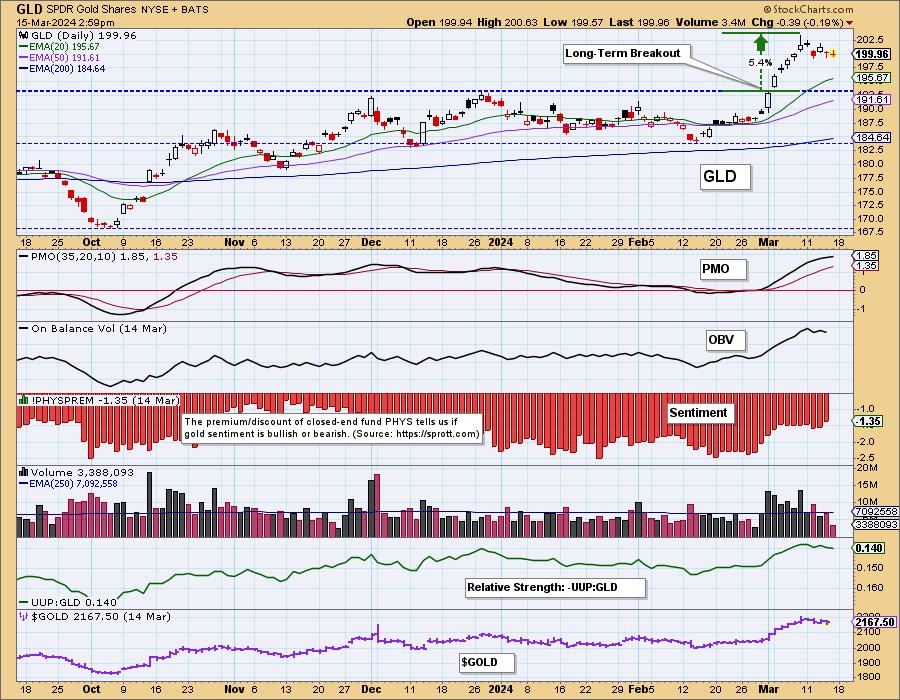
Decisive Long-Term Breakout for Gold

by Carl Swenlin,
President and Founder, DecisionPoint.com
This month, the SPDR Gold Shares (GLD) broke out to new, all-time highs. That was a significant long-term move, which we will discuss when we get to the monthly chart.
Of more immediate interest is the fact that sentiment is still bearish, which bodes well for a continued...
READ MORE
MEMBERS ONLY

Oil & Gas Equipment & Services ETF Resumes its Uptrend

by Arthur Hill,
Chief Technical Strategist, TrendInvestorPro.com
The Oil & Gas Equipment & Services ETF (XES) is showing strength here in March as it breaks back above its 40-week SMA. More importantly, the long-term trend is up and this week's breakout argues for a continuation of this uptrend.
The chart below shows XES...
READ MORE
MEMBERS ONLY

Missed Out on Micron's 112% Surge? Here's Your Second Chance!
by Karl Montevirgen,
The StockCharts Insider
KEY TAKEAWAYS
* Micron's AI game just got started and is looking to heat up as it provides key components to both Nvidia and Advanced Micro Devices
* MU's price, however, has begun to pull back as bulls look for a favorable entry point
* Using a bearish StockCharts...
READ MORE
MEMBERS ONLY
These Signals Will Improve Your Timing!

by Joe Rabil,
President, Rabil Stock Research
On this week's edition of Stock Talk with Joe Rabil, Joe explains how to use the MACD crossover signal and the Pinch play signal. There are times when one is better than the other, and he uses several examples to show this distinction. He discusses how the low...
READ MORE
MEMBERS ONLY
Market Research and Analysis - Part 1: Why Technical Analysis?
by Greg Morris,
Veteran Technical Analyst, Investor, and Author
Note to the reader: This is the twelfth in a series of articles I'm publishing here taken from my book, "Investing with the Trend." Hopefully, you will find this content useful. Market myths are generally perpetuated by repetition, misleading symbolic connections, and the complete ignorance of...
READ MORE
MEMBERS ONLY
Key Support Levels Broken, BUT Breadth is Bullish!
by David Keller,
President and Chief Strategist, Sierra Alpha Research
In this edition of StockCharts TV'sThe Final Bar, Dave focuses on the resilient strength in market breadth indicators, suggesting a leadership rotation continues as growth stocks like AAPL and TSLA fail to hold key support. He highlights stocks making new three-month highs, including FCX, SCCO, and WSM....
READ MORE
MEMBERS ONLY
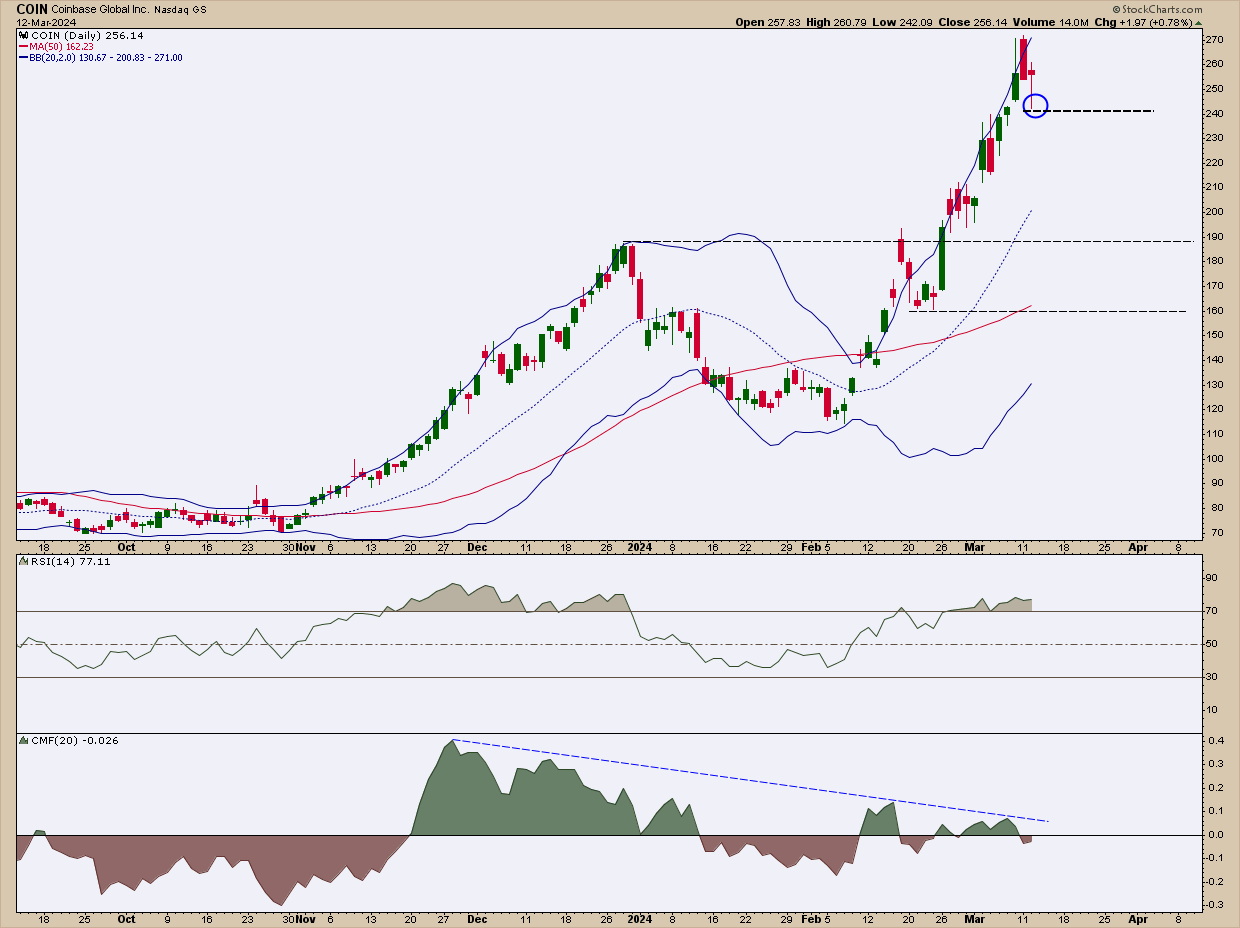
Is Coinbase Stock About to Crater? Here's One Way to Exploit It
by Karl Montevirgen,
The StockCharts Insider
KEY TAKEAWAYS
* Coinbase's (COIN) stock is blasting off, hitting a jaw-dropping 99.6 SCTR score.
* The pin bar (most current bar) seems like a desperate attempt for the bulls to advance the stock amidst being potentially outnumbered by sellers.
* Ready to go on the offensive? Here'...
READ MORE
MEMBERS ONLY
WFC Stock: A Step-By-Step Analysis to Better Time Your Entry

by Jayanthi Gopalakrishnan,
Director of Site Content, StockCharts.com
KEY TAKEAWAYS
* Wells Fargo stock hits a new all-time high
* The Financial sector has been gaining strength with several big bank stocks displaying positive movement
* Momentum in WFC may be strong now but a slowdown could mean a big pullback since the stock is trading above its average price...
READ MORE
MEMBERS ONLY
GNG TV: Materials, Industrials, Financials, Oh My...!

by Alex Cole,
Co-founder, GoNoGo Charts®

by Tyler Wood,
Co-founder, GoNoGo Charts®
On this week's edition of the GoNoGo Charts show from StockCharts TV, as the S&P 500 continues the rally at all time highs, Alex and Tyler take a look at GoNoGo Trend® conditions of several areas of the market. The recent breakout in Gold has much...
READ MORE
MEMBERS ONLY
DP Trading Room: Semiconductors - SOXX v. SMH, They're Not the Same
by Erin Swenlin,
Vice President, DecisionPoint.com
Carl and Erin explore the differences between two Semiconductor ETFs, SOXX and SMH. They are NOT the same. One offers far more upside potential than the other. Learn how to easily compare two ETFs or even two stocks using relative strength.
Carl covered the market in general with special attention...
READ MORE
MEMBERS ONLY
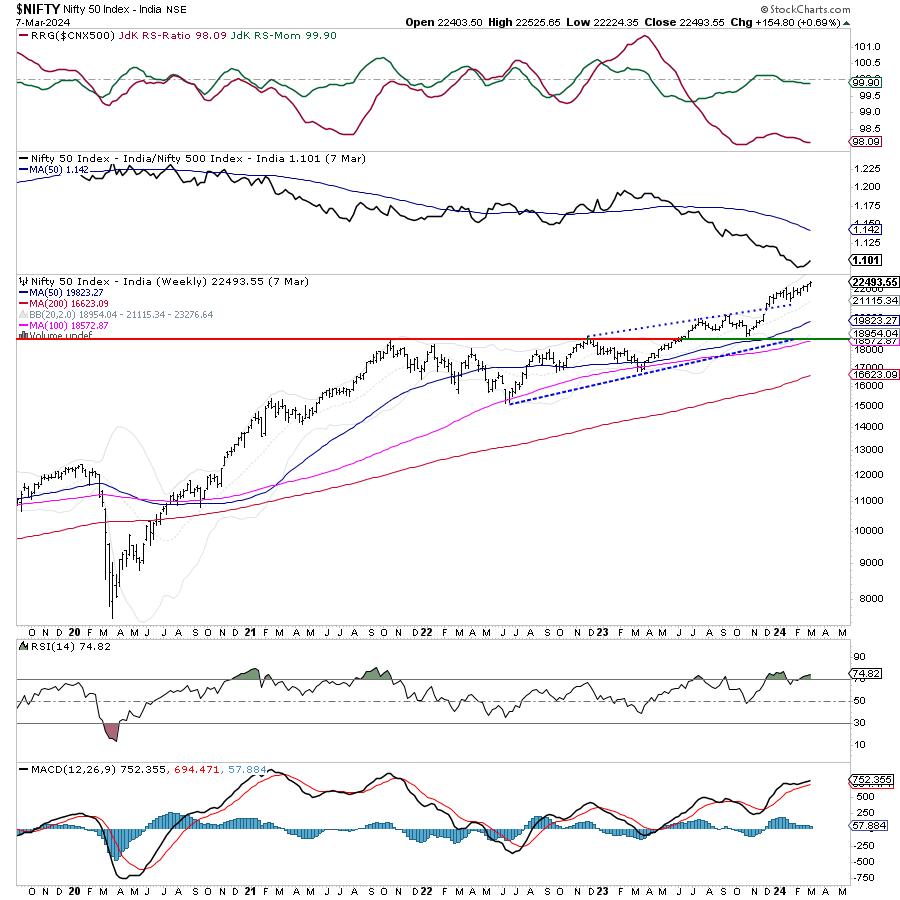
Week Ahead: NIFTY Stares at Both Incremental Highs and Consolidation at Higher Levels; Tread with Caution

by Milan Vaishnav,
Founder and Technical Analyst, EquityResearch.asia and ChartWizard.ae
The markets continued to trade on expected lines. The trading week was short, as Friday was a trading holiday on account of Mahashivratri. In the four trading sessions, the markets stayed choppy and failed to make any definite and convincing moves while continuing to modestly advance on a weekly basis....
READ MORE
MEMBERS ONLY
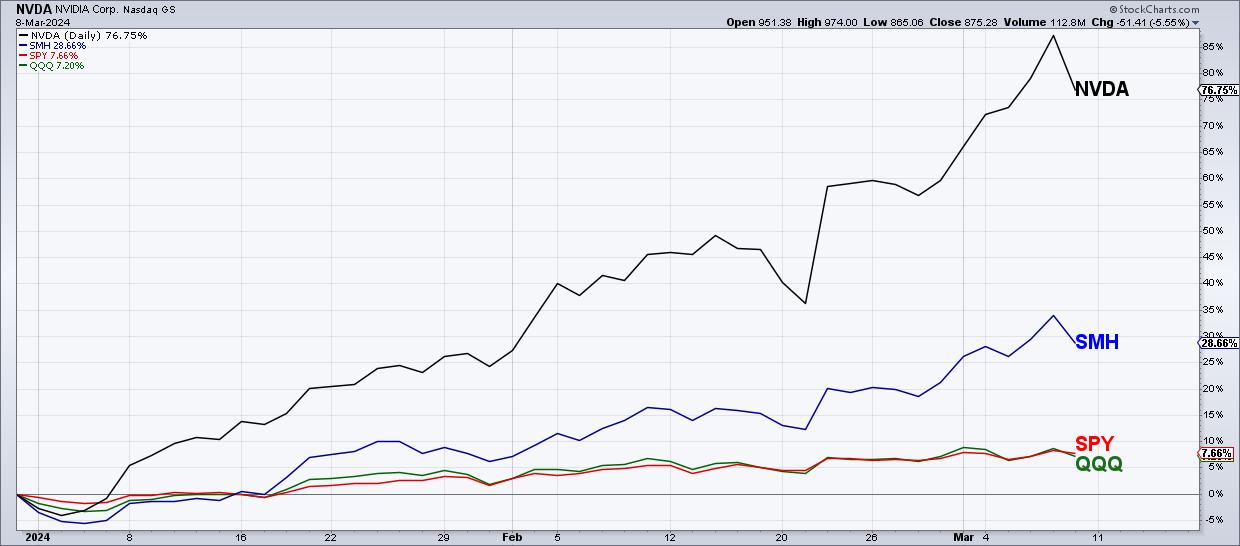
Bearish Engulfing Pattern Marks Top For NVDA?
by David Keller,
President and Chief Strategist, Sierra Alpha Research
KEY TAKEAWAYS
* Nvidia is up 77% year-to-date, far outpacing the S&P 500 and Nasdaq which are both up about 7-8%.
* A bearish engulfing pattern is a two-bar candle pattern indicating short-term distribution and negative sentiment.
* Downside targets for NVDA can be identified using...
READ MORE
MEMBERS ONLY
The Halftime Show: 100th and LAST Show!
by Pete Carmasino,
Chief Market Strategist, Chaikin Analytics
Pete presents the 100th and final edition ofStockCharts TV'sHalftime! This week, Pete shares some parting tips on what to look for when the trends change from defense, (risk off) to offense (risk on). He explains how he saw them coming and how the Chaikin Power Gauge did as...
READ MORE
MEMBERS ONLY

Find Stocks That Are BEATING The S&P 500 - In Just One Click!
by Grayson Roze,
Chief Strategist, StockCharts.com
Feel like you never find those high-flying stocks before they make their big moves? This week's edition of StockCharts TV'sStockCharts in Focus is for you! Grayson walks you through the 3 simple steps he uses to find, track and trade the market's strongest...
READ MORE
MEMBERS ONLY
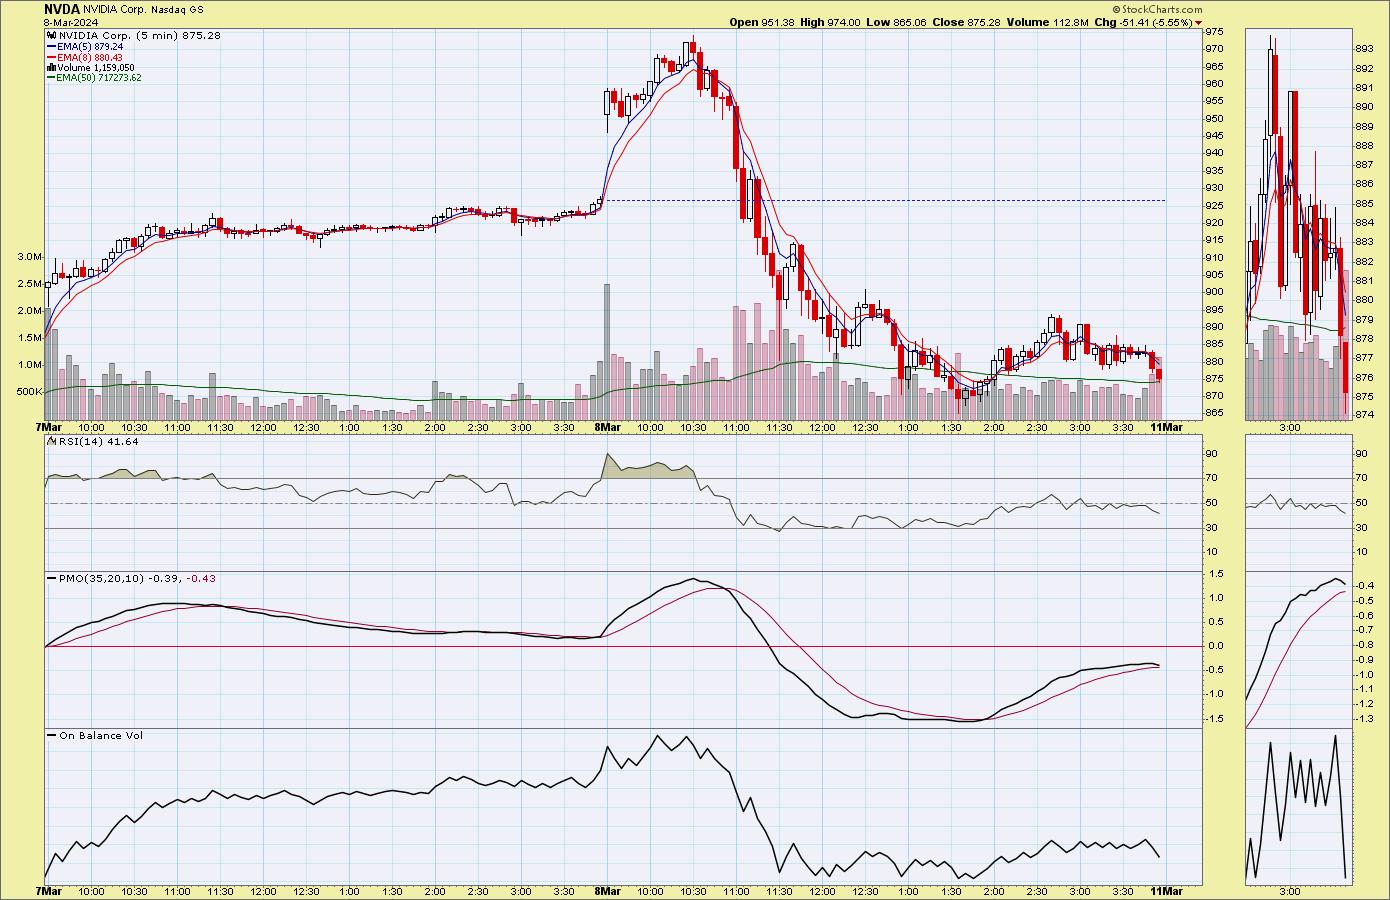
What Happened to NVIDIA (NVDA)?
by Erin Swenlin,
Vice President, DecisionPoint.com
NVIDIA (NVDA) was enjoying quite a rally to start the day. All seemed right with the world. Someone recently said to me, regarding another company, that it was "a victim of its own success." This is what happened to NVDA.
It appears that the ceiling was reached for...
READ MORE
MEMBERS ONLY

Top 10 Actionable Charts to Watch 2024
by David Keller,
President and Chief Strategist, Sierra Alpha Research
by Grayson Roze,
Chief Strategist, StockCharts.com
In this edition of StockCharts TV'sThe Final Bar, Grayson and Dave run through the 10 charts they feel present actionable opportunities based on their technical analysis setups. They'll cover breakout strategies, moving average techniques, relative strength, and much more. And you'll have ten new...
READ MORE
MEMBERS ONLY
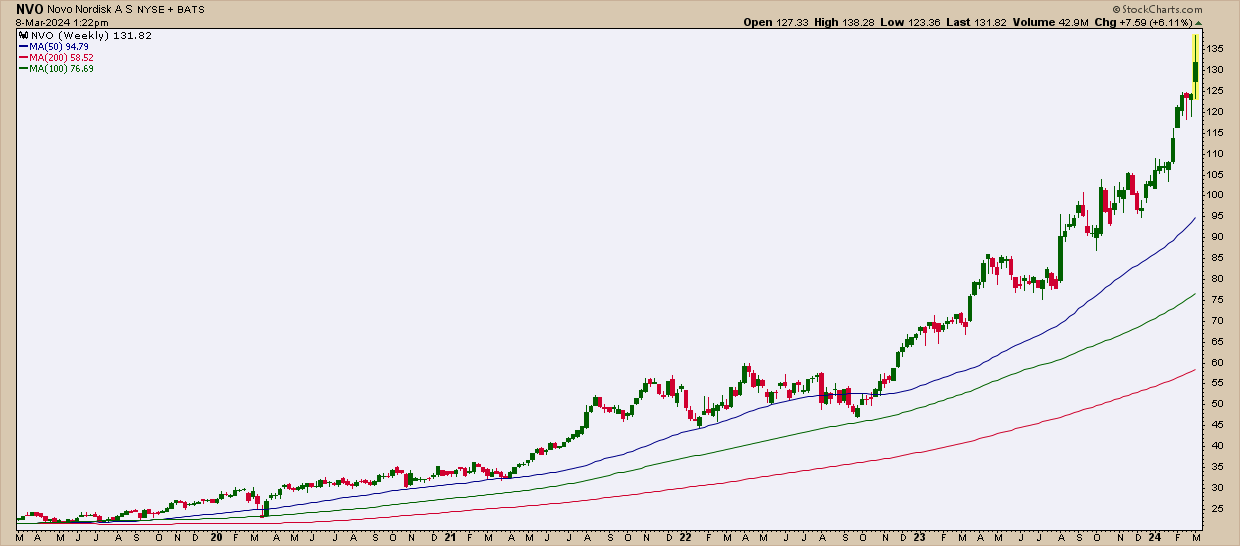
Ozempic Set the Stage, But Could Novo's Newest Drug Be the Real Moneymaker?
by Karl Montevirgen,
The StockCharts Insider
KEY TAKEAWAYS
* Novo Nordisk A/S (NVO) has been riding a strong uptrend since 2017, fueled by its Ozempic drug.
* This last week, positive results for its new drug, amycretin, transformed the Ozempic fever into a Wall Street frenzy.
* Technical and fundamental buy points seem to be at odds if...
READ MORE
MEMBERS ONLY
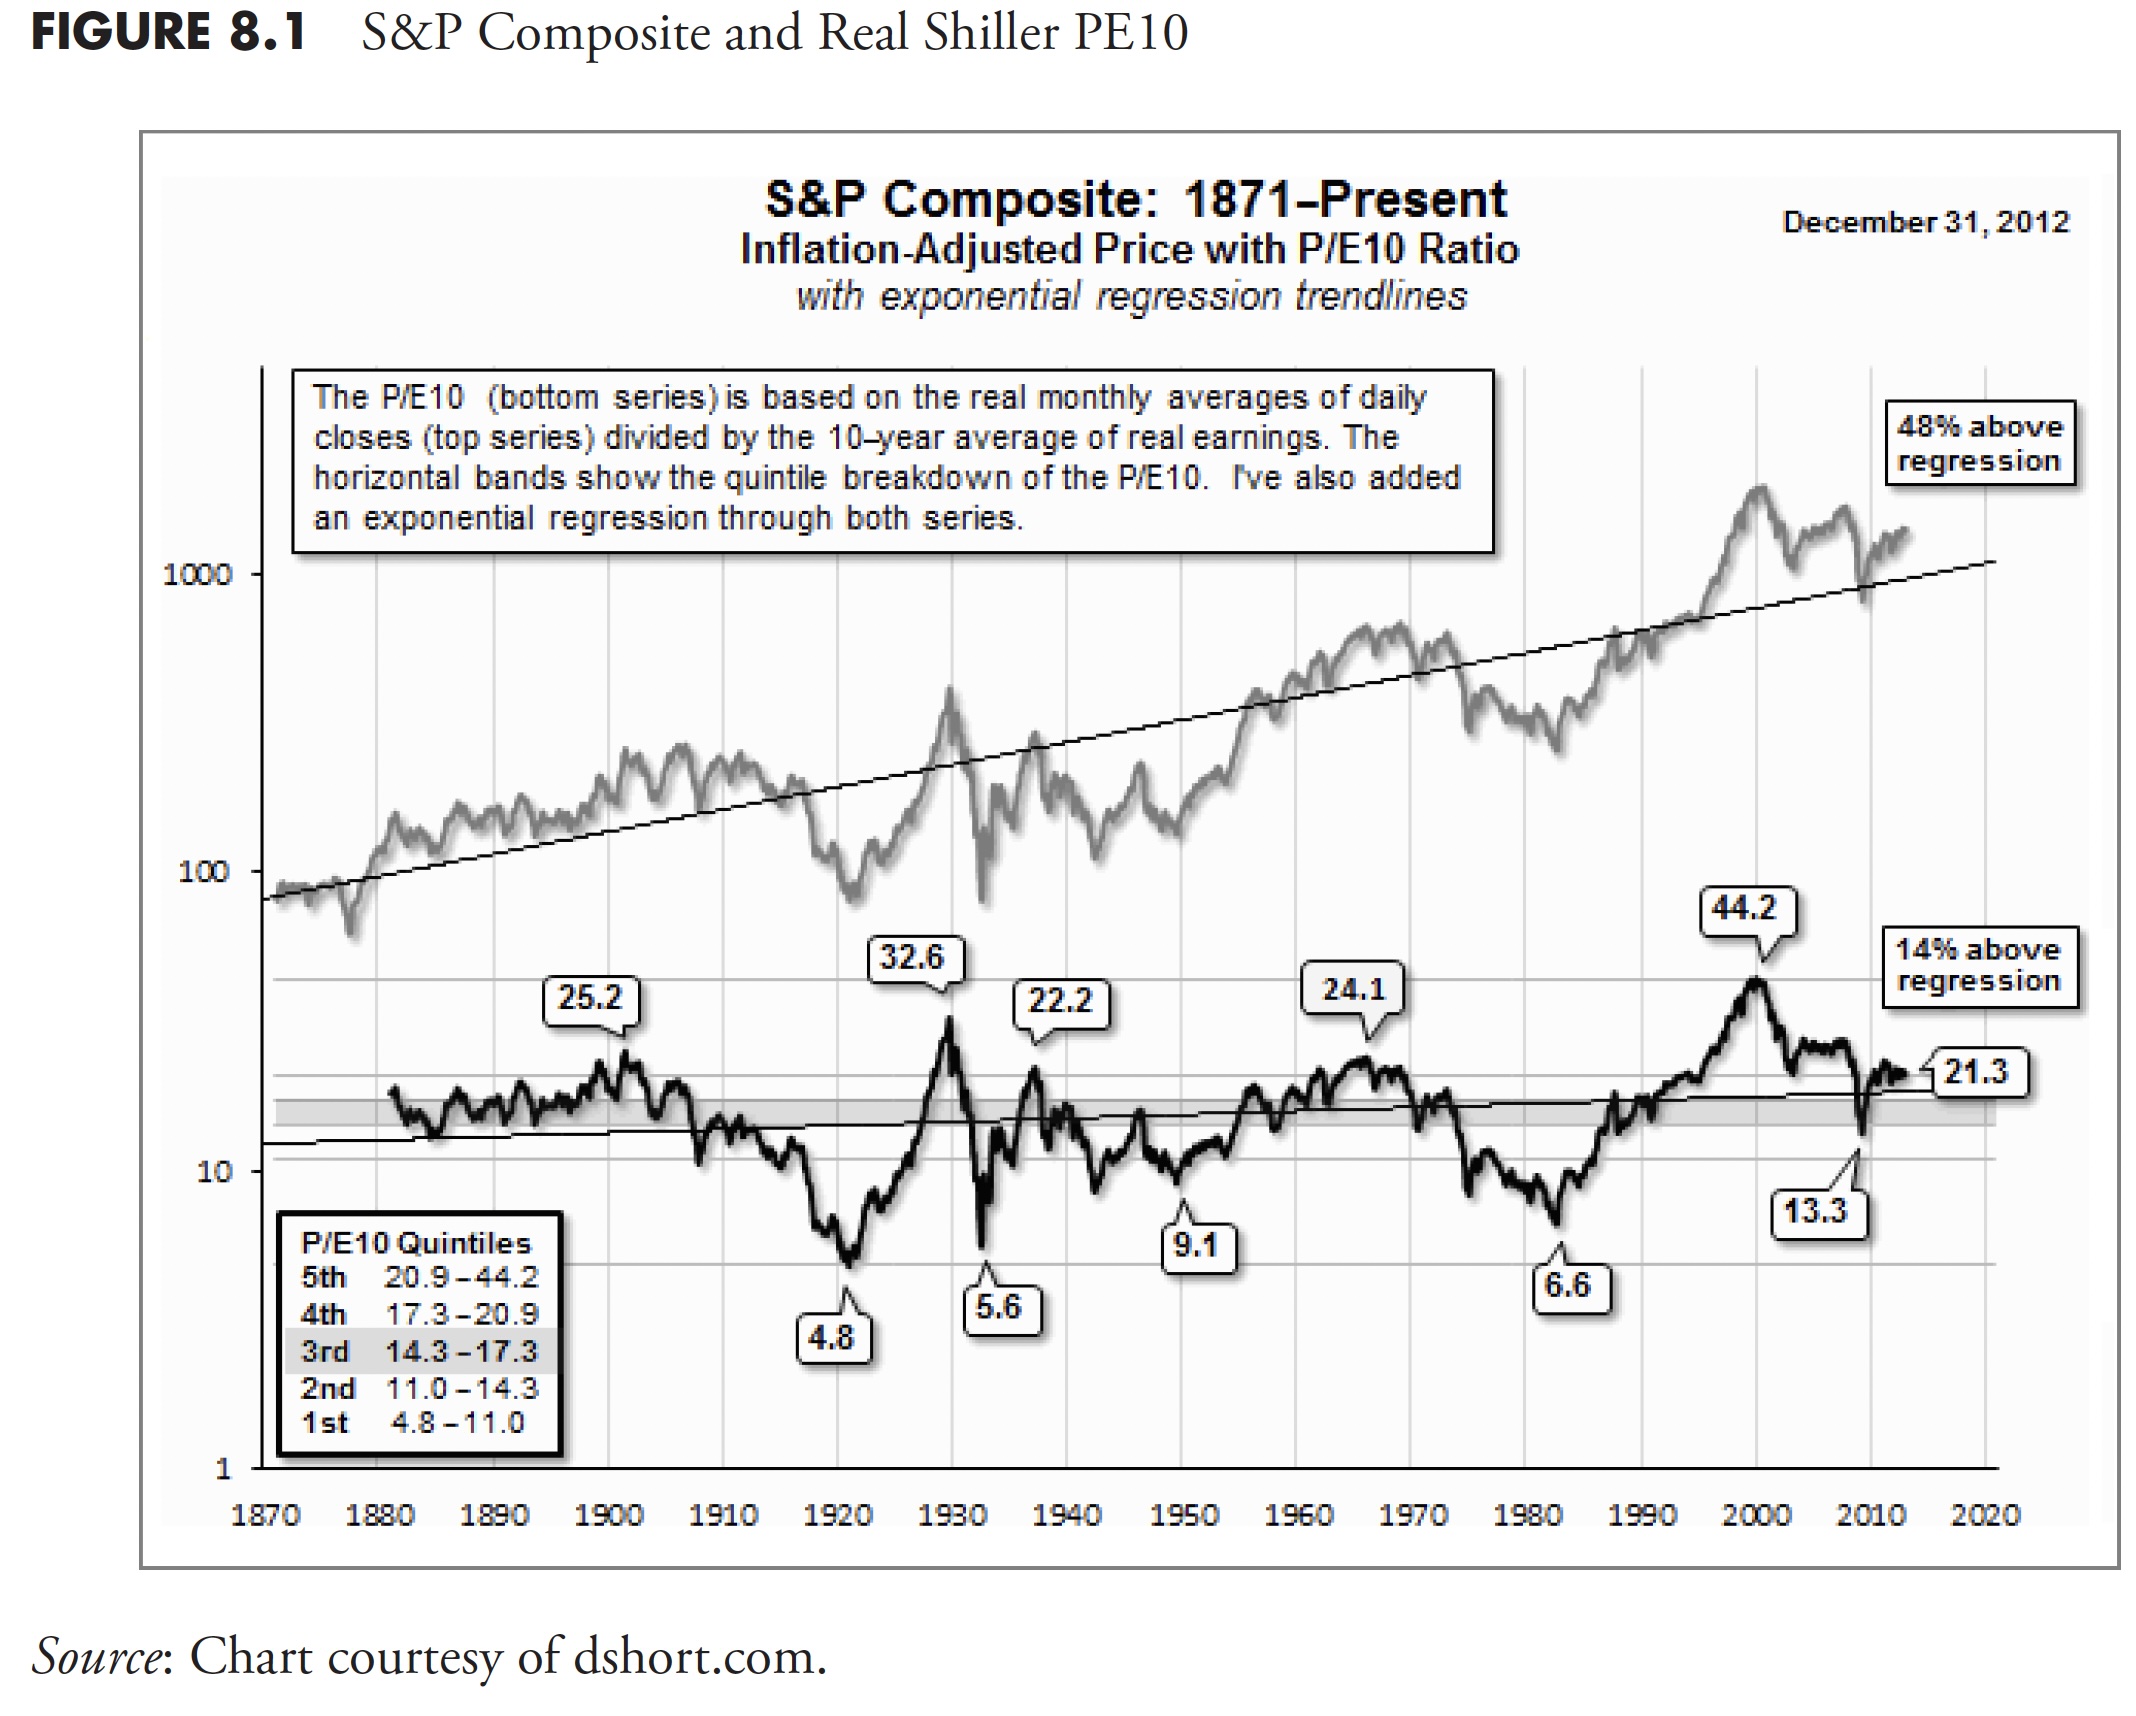
The Hoax of Modern Finance - Part 11: Valuations, Returns, and Distributions
by Greg Morris,
Veteran Technical Analyst, Investor, and Author
Note to the reader: This is the eleventh in a series of articles I'm publishing here taken from my book, "Investing with the Trend." Hopefully, you will find this content useful. Market myths are generally perpetuated by repetition, misleading symbolic connections, and the complete ignorance of...
READ MORE
MEMBERS ONLY
AAPL and TSLA Stocks Are COLLAPSING!
by David Keller,
President and Chief Strategist, Sierra Alpha Research
In this edition of StockCharts TV'sThe Final Bar, Dave highlights mega-cap growth names that are in full breakdown mode, including TSLA, AAPL, and GOOGL. He also updates the latest market breadth indicators which suggest more of a leadership rotation into value-oriented sectors, and even Consumer Staples...
READ MORE
MEMBERS ONLY

Everyone Has a Plan Until They Get Punched in the Face. Did Jerome Powell Just Get Punched in the Face?

by Martin Pring,
President, Pring Research
The title of this article may be exaggerated, but, last Friday, the probabilities for an upward reversal in the rate of inflation later this year went substantially higher. That's because the gold price, an inflationary bellwether, broke out from a 4-year trading range to a new all-...
READ MORE
MEMBERS ONLY
Target's Stock Defied Gravity When the Market Tanked: Timely Buy or FOMO?
by Karl Montevirgen,
The StockCharts Insider
KEY TAKEAWAYS
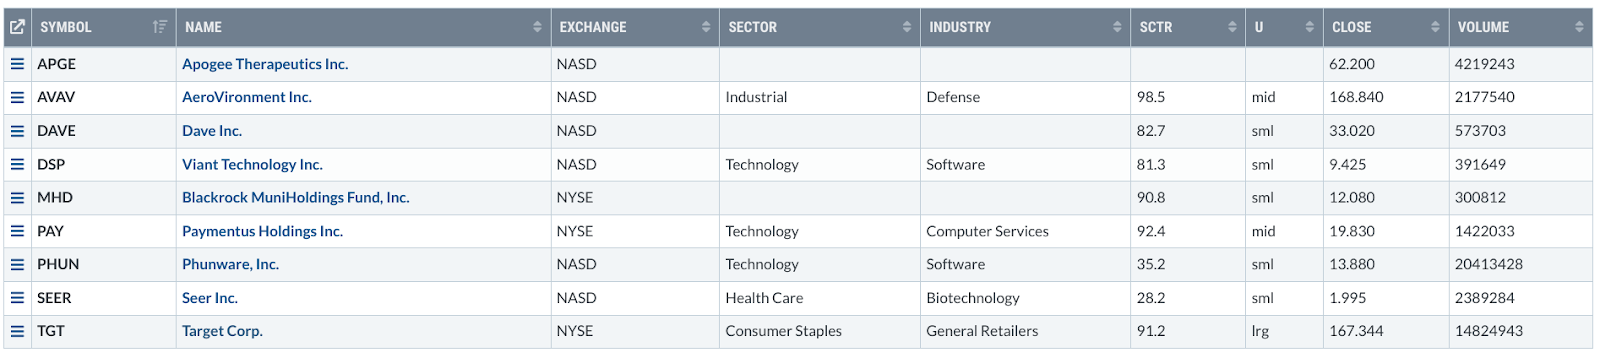
* Target Corp (TGT) bucked the trend on Tuesday, popping 13% despite a broader market selloff.
* Investors jumped in despite the retailer's weak 2024 guidance.
* A potentially strong entry point for TGT rests on two factors, one technical and the other fundamental.
On Tuesday, Target Corp (TGT)...
READ MORE
MEMBERS ONLY
Bitcoin Tests All-Time Highs While Growth Stocks Sag
by David Keller,
President and Chief Strategist, Sierra Alpha Research
In this edition of StockCharts TV'sThe Final Bar, Dave breaks down the hourly chart of Bitcoin and highlights recent breakouts for regional banks. Guest Julius de Kempenaer of RRG Research focuses in on the Communication Services sector, including META, DIS, and GOOG, and shows how defensive sectors have...
READ MORE
MEMBERS ONLY
DP Trading Room: Must See Gold Charts!
by Erin Swenlin,
Vice President, DecisionPoint.com
Carl begins today's show with a walk through General Electric (GE) which was in the news this week. See what Carl thinks of the charts!
Carl covers the market in general and pays particular attention to Gold as it launches skyward. Can this run continue? What does this...
READ MORE
MEMBERS ONLY
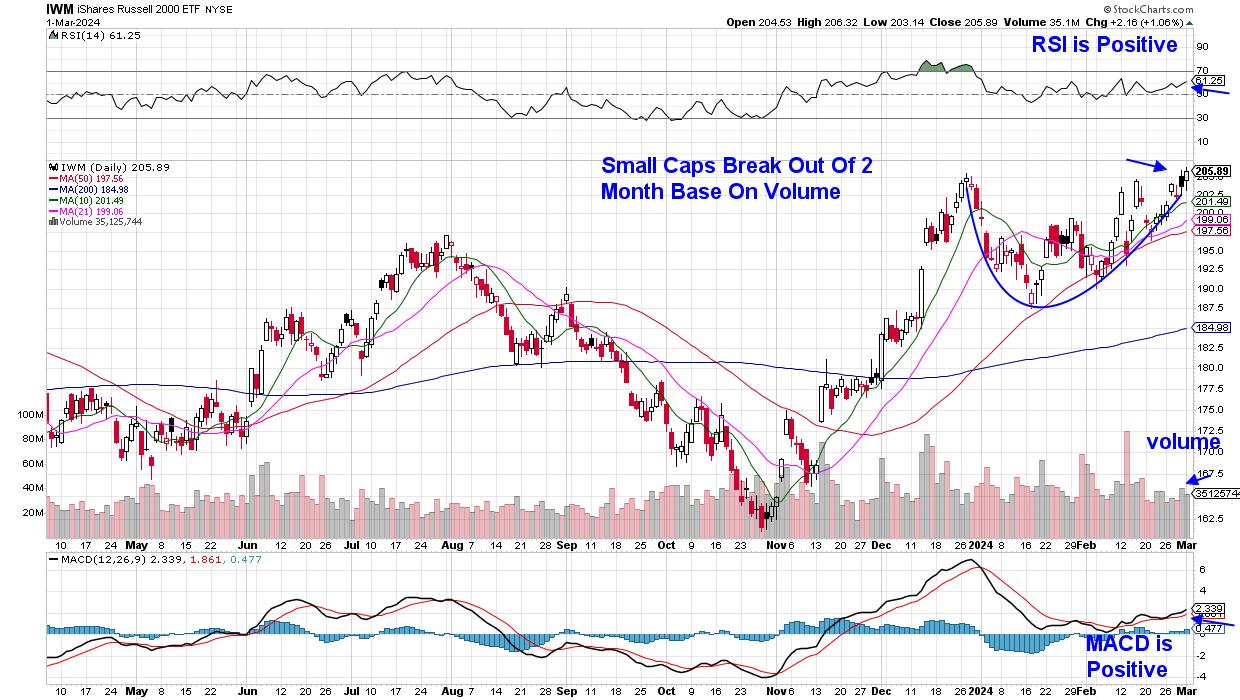
Small Caps Join The Party -- Here's a Top Stock to Consider
by Mary Ellen McGonagle,
President, MEM Investment Research
The S&P 500 and the NASDAQ both reached an all-time high today boosted by a Tech-fueled rally amid AI-related names. Small-cap stocks also had a bullish day after posting a two-month base breakout to near-term highs. This index has had a tough...
READ MORE
MEMBERS ONLY
Could This Stock Be the NEXT NVDA?
by David Keller,
President and Chief Strategist, Sierra Alpha Research
In this edition of StockCharts TV'sThe Final Bar, Dave wraps up his Dubai journey with a special Viewer's Questions Mailbag edition! Dave explores whether LABU is on the path to mimic NVIDIA and if it's still the right time to jump in. He also...
READ MORE
MEMBERS ONLY

Spotting Tradable Pullbacks after Trend Reversing Surges
by Arthur Hill,
Chief Technical Strategist, TrendInvestorPro.com
Most stocks surged with the broader market in the fourth quarter of 2023. SPY and QQQ extended their advances in 2024, but some stocks did not partake and fell back. Even so, some of these stocks show signs of long-term trend reversals and their declines in 2024 look corrective....
READ MORE
MEMBERS ONLY
AMD Spikes Higher as AI Trade Still Kicking
by David Keller,
President and Chief Strategist, Sierra Alpha Research
In this edition of StockCharts TV'sThe Final Bar, Dave recaps today's market activity from the CMT 2024 Summit in Dubai, highlighting AMD's upside breakout, breadth improvement for US stocks, and why big round numbers matter for stocks like SMCI.
This video originally premiered on...
READ MORE
MEMBERS ONLY
Are "The Seven" Still Magnificent?
by Carl Swenlin,
President and Founder, DecisionPoint.com
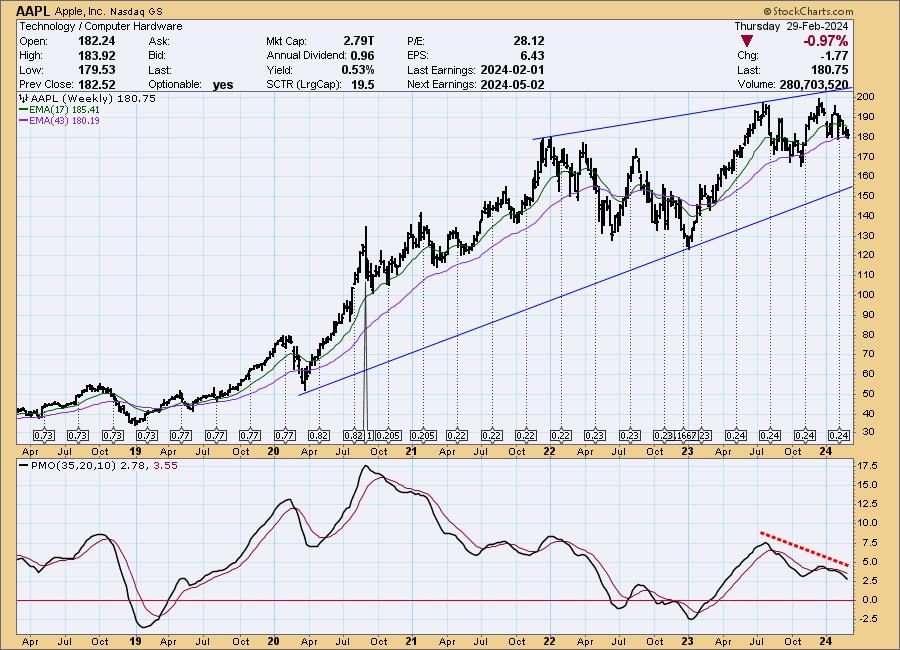
I have been hearing comments that some of the Magnificent Seven no longer qualify for membership, so I thought a quick look at them might be helpful. For this analysis, I'll be using weekly charts.
Apple (AAPL): AAPL is dealing with trying to move production out of China,...
READ MORE
MEMBERS ONLY
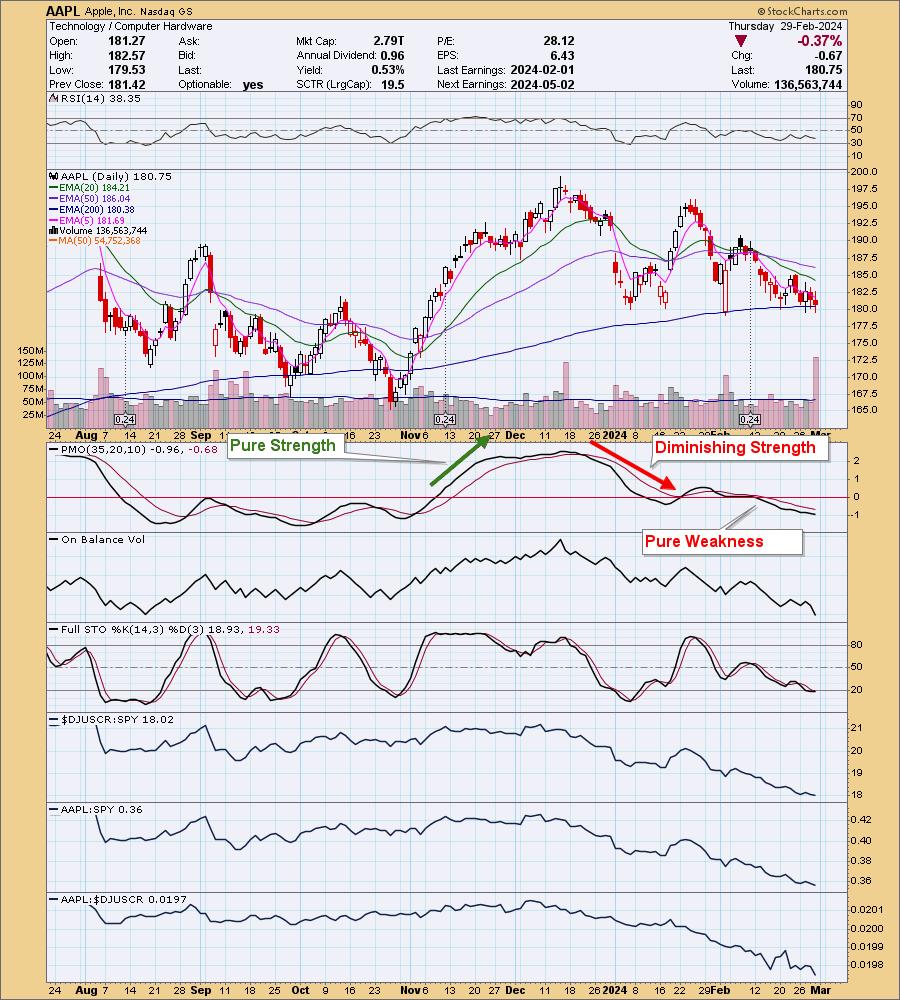
Apple (AAPL) and Google (GOOGL) Flashing "Pure Weakness"
by Erin Swenlin,
Vice President, DecisionPoint.com
We've begun talking more about the Price Momentum Oscillator (PMO) as it relates to finding "pure strength" and "pure weakness". What it all comes down to is the zero line and the PMO's behavior above or below.
We review the Magnificent 7...
READ MORE
MEMBERS ONLY
Swing Trading Strategies, Tips & Trends
by Joe Rabil,
President, Rabil Stock Research

by Bruce Fraser,
Industry-leading "Wyckoffian"
On this week's edition of Stock Talk with Joe Rabil, Joe features special guest, Bruce Fraser of Power Charting. Joe and Bruce discuss swing trading in detail, first by defining swing trading and how it is different from trend trading, and then spending time going through the SIG...
READ MORE
MEMBERS ONLY

Three Intermarket Relationships That Say This Bull Market is Going Higher
by Martin Pring,
President, Pring Research
Absorbing the information gleaned from monthly charts for various asset classes or sectors can help gain some perspective. However, I find that an examination of the relationships between them can be equally rewarding, if not moreso. That's because they point out the nature of the current investment environment,...
READ MORE