MEMBERS ONLY

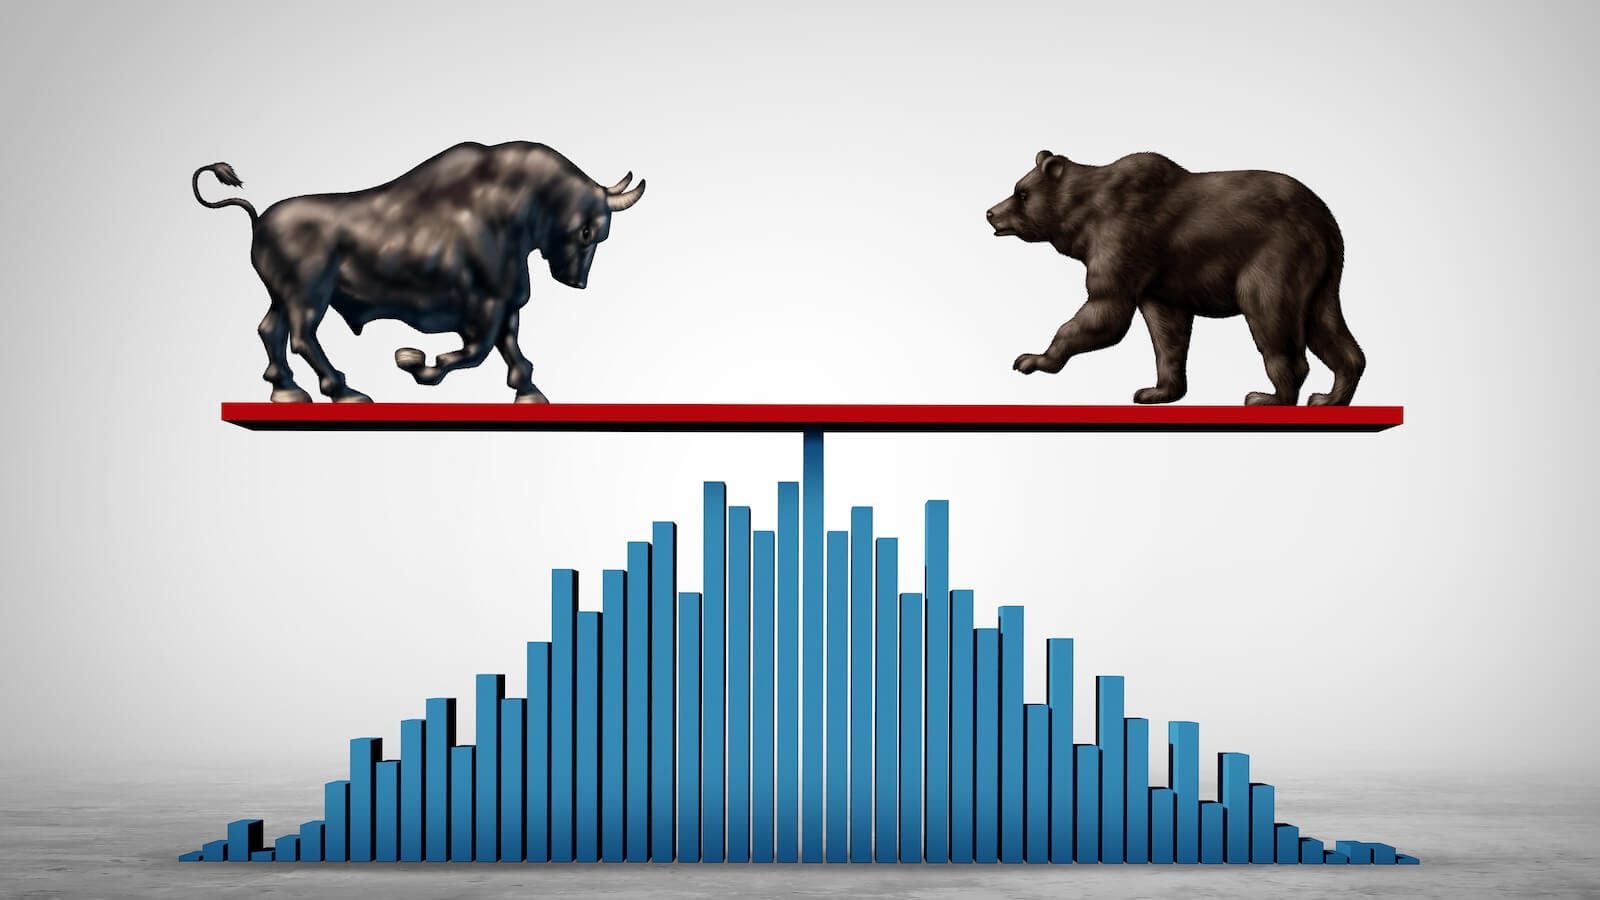
To Be Invested or Not to be Invested? That is the Question

by Arthur Hill,
Chief Technical Strategist, TrendInvestorPro.com
These three indicators will filter out the noise and identify whether the stock market is bullish or bearish. This, in turn, will help you determine whether you should remain invested or not. Explore these indicators and find out which key levels to watch....
READ MORE
MEMBERS ONLY
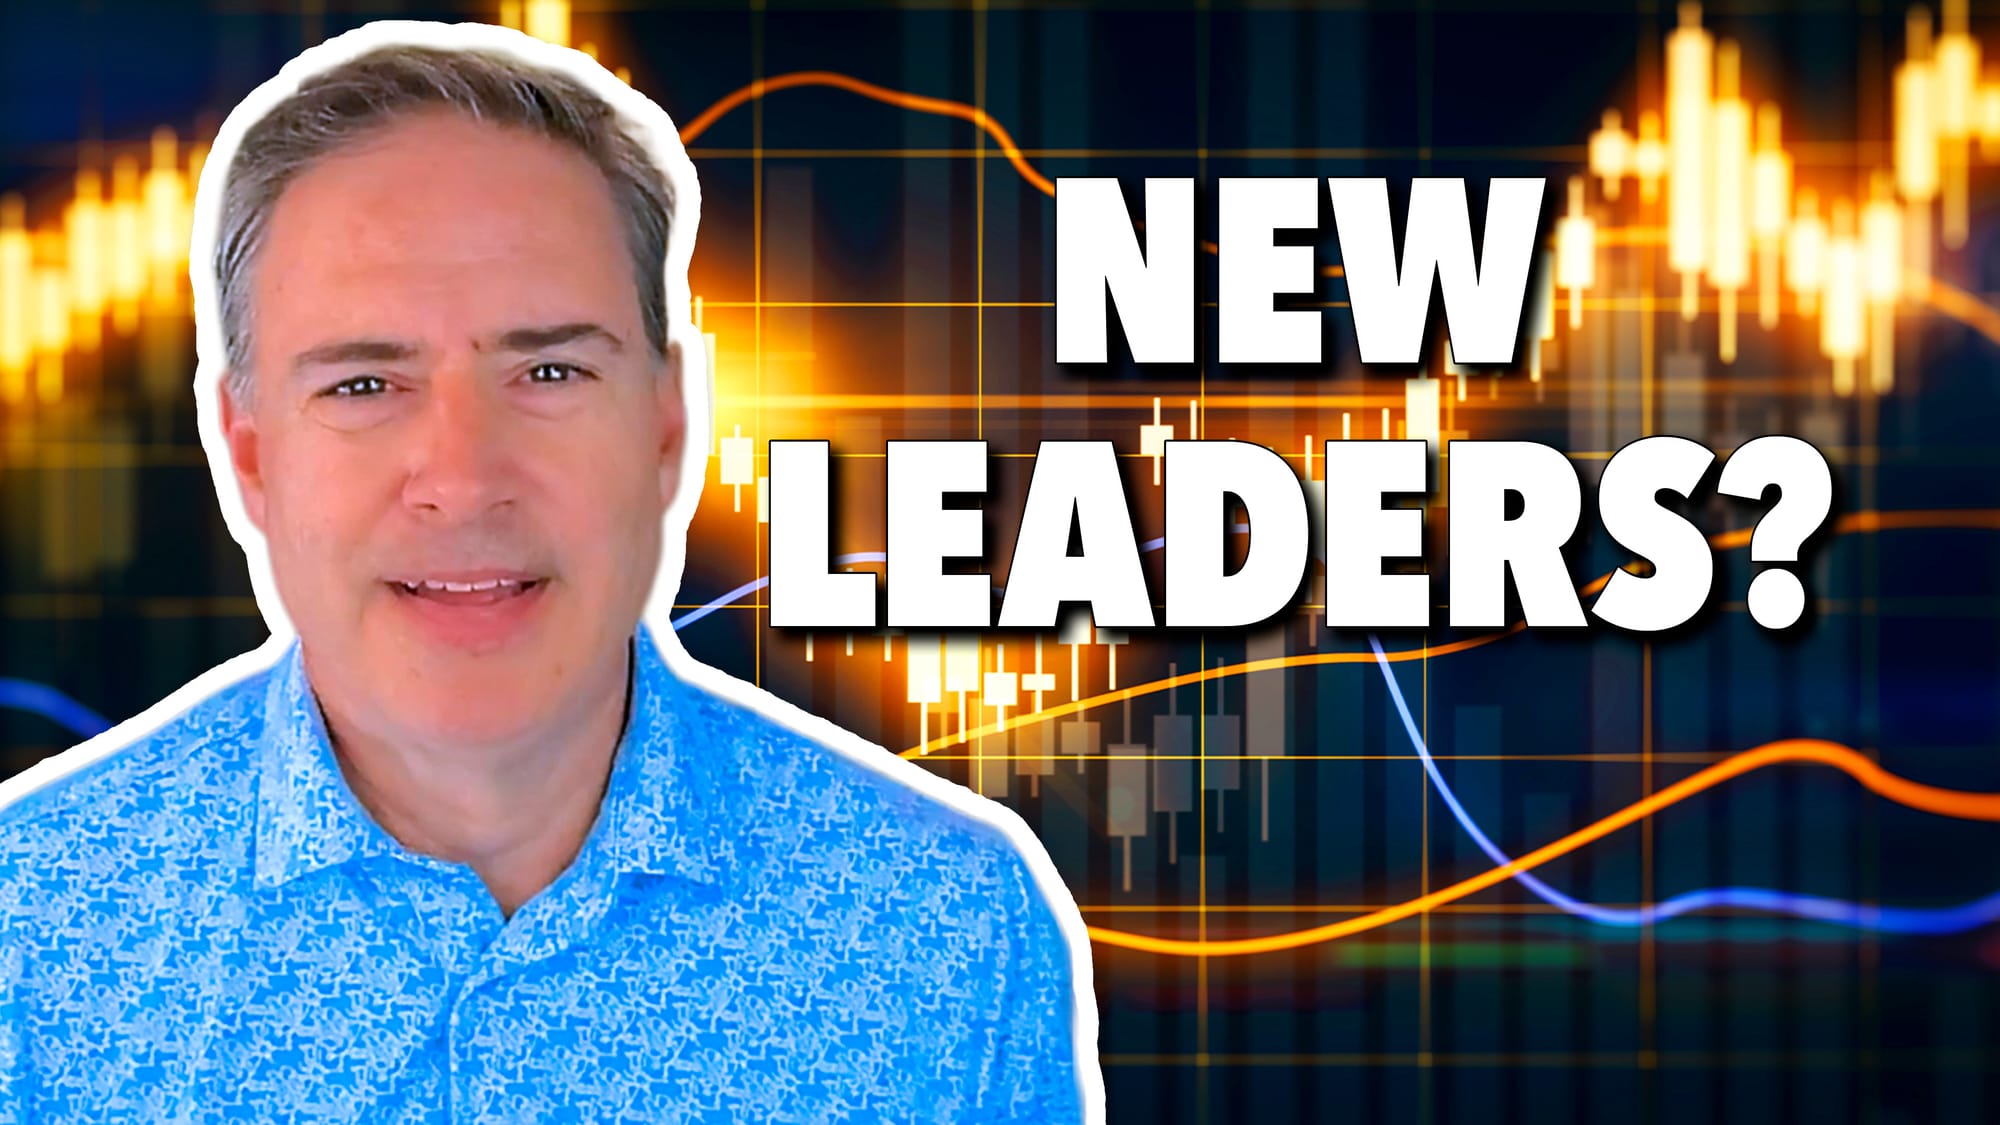
Stocks Showing Early Market Rotation Using Relative Strength

by Joe Rabil,
President, Rabil Stock Research
Joe Rabil of Rabil Stock Research looks at stocks rotating after a long bearish, discusses the prospects of a Santa Claus rally, and breaks down viewer-requested stocks....
READ MORE
MEMBERS ONLY

Calm Markets, Crude Chaos: Why Oil Is the Odd One Out This Holiday Season
While equities have remained relatively calm during this holiday season, oil prices have been under pressure. Even as energy stocks are performing better than crude, the overall trend remains bearish....
READ MORE
MEMBERS ONLY

Two Markets That Could Be Influenced by a Peace Settlement in Ukraine

by Martin Pring,
President, Pring Research
Martin Pring analyzes the two areas that could see a significant upside move if a peace settlement in the conflict in Ukraine is reached....
READ MORE
MEMBERS ONLY

Change of Character: Spotting the Shift From Downtrend to Uptrend

by David Keller,
President and Chief Strategist, Sierra Alpha Research
David Keller explains how to spot when a stock transitions from distribution to accumulation, and how you can use scanning, alerts, and scheduled scans to find the next breakout....
READ MORE
MEMBERS ONLY
If Value Is Really Back, These Two Stocks Will Tell Us First
Value stocks are showing signs of strength, but it will take strength from sectors such as Energy and Financials to push this asset group higher. Learn about which charts could provide clues on the value vs. growth trade. ...
READ MORE
MEMBERS ONLY

Critical Week Ahead: Can Nifty Push Past Resistance?

by Milan Vaishnav,
Founder and Technical Analyst, EquityResearch.asia and ChartWizard.ae
The broader structure of the Nifty remains bullish, but the index is navigating a key inflection zone. Will the next week extend the trend?...
READ MORE
MEMBERS ONLY

Is the S&P 500 Stuck in Neutral? A Traffic Light Approach to Trend Changes
by David Keller,
President and Chief Strategist, Sierra Alpha Research
Since the April low, the S&P 500 has shifted from a strong uptrend into a clear consolidation. Dave Keller, CMT, introduces a “traffic light” charting technique to define key support and resistance levels—and spot when sideways markets finally break into accumulation or distribution....
READ MORE
MEMBERS ONLY

Will Semiconductors Be A Problem in 2026?

by Tom Bowley,
Chief Market Strategist, EarningsBeats.com
Are semiconductors due for a correction? Tom Bowley analyzes the longer-term chart of the Dow Jones US Semiconductors Index. Find out what his analysis reveals....
READ MORE
MEMBERS ONLY
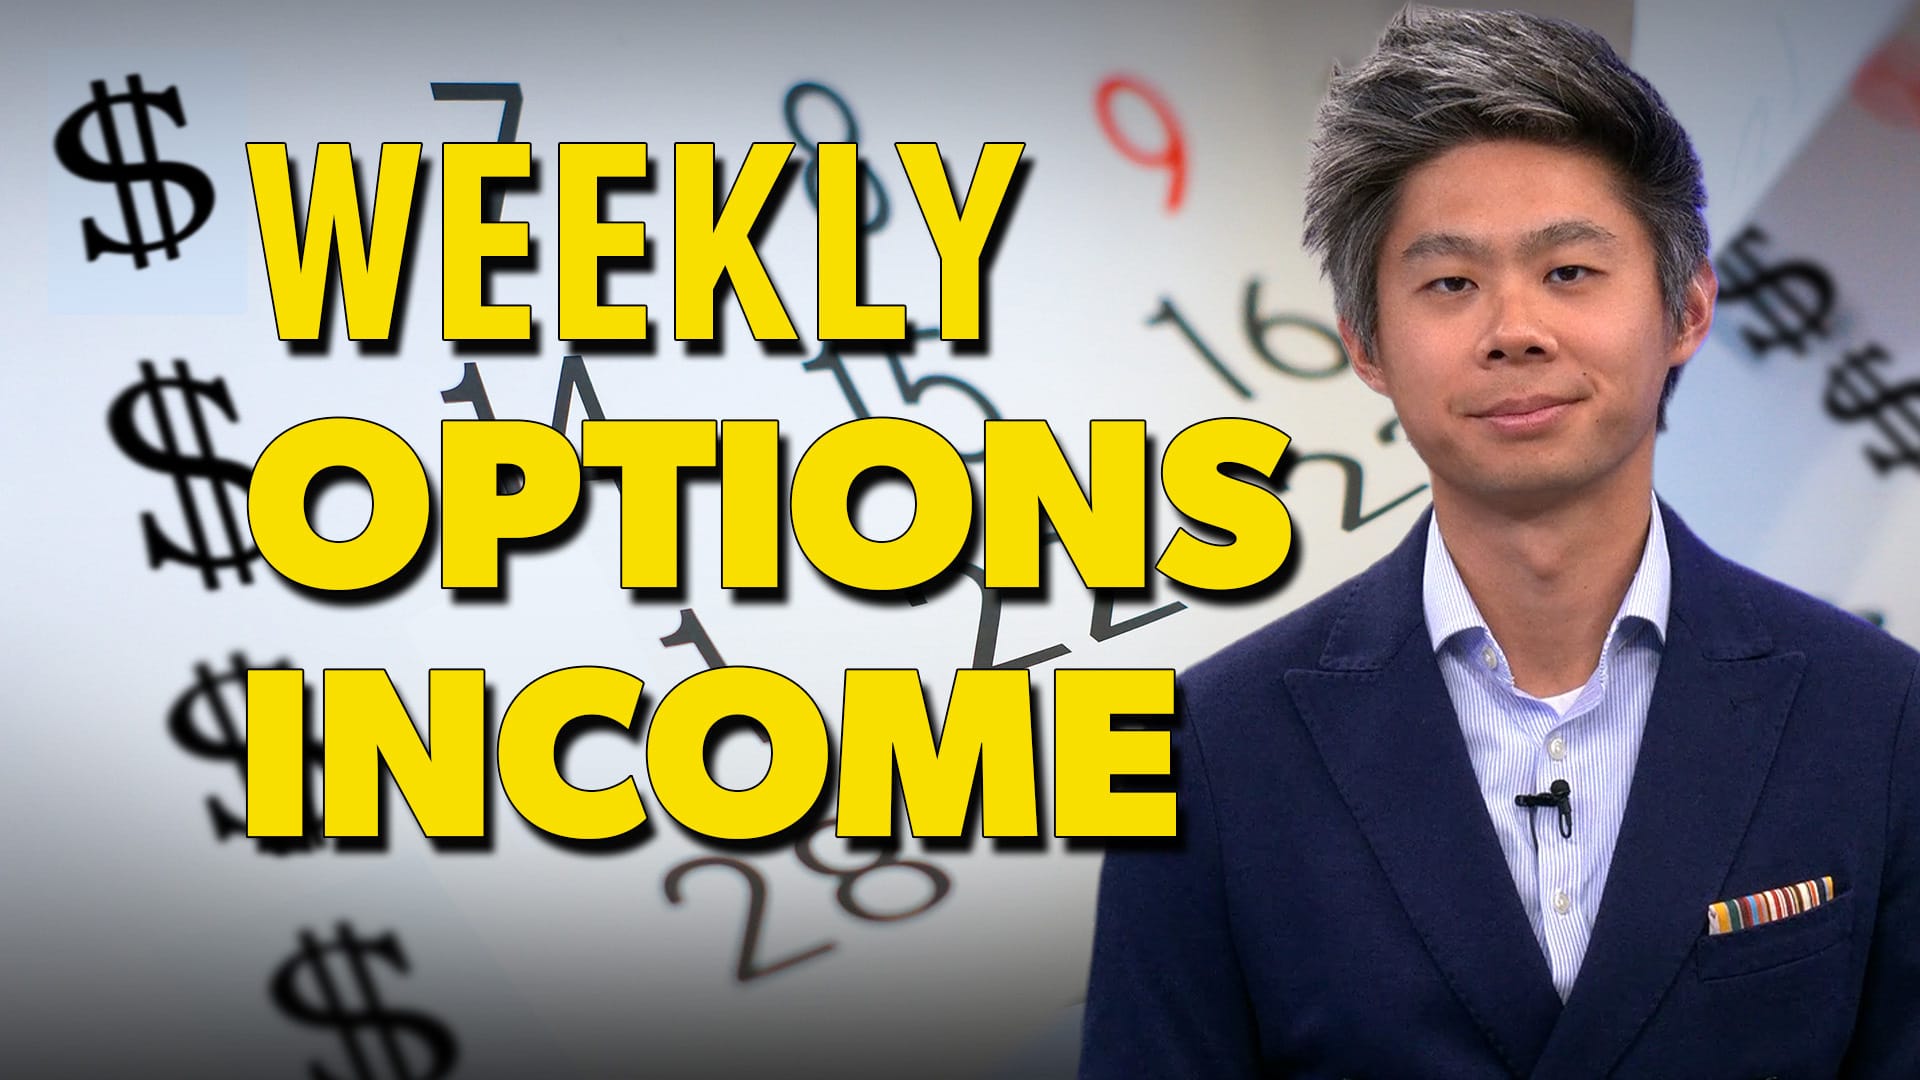
How to Generate Weekly Income with Options — Fast and Smart!

by Tony Zhang,
Chief Strategist, OptionsPlay
Tony Zhang reveals how to generate consistent weekly income with smart options strategies. Learn how to scan for the highest-yielding cover calls, cash-secured puts, and spreads using StockCharts’ OptionsPlay Strategy Center....
READ MORE
MEMBERS ONLY
Using Trend Signals and Oversold Conditions to Get a Jump on the Breakout
by Arthur Hill,
Chief Technical Strategist, TrendInvestorPro.com
If you're looking to get in early on a breakout, first identify the uptrend and then find oversold setups. Arthur Hill walks you through how to look for the ideal setups....
READ MORE
MEMBERS ONLY

A Stock Market Rally With a Twist: What's Strengthening and What's Cracking?

by Jayanthi Gopalakrishnan,
Director of Site Content, StockCharts.com
The Fed cut sparked new life in the stock market. See which sectors broke out, where weakness remains, and what it means for investors....
READ MORE
MEMBERS ONLY

Hedge Funds AND Mutual Funds Picked These 6 Stocks — Should You?
by David Keller,
President and Chief Strategist, Sierra Alpha Research
Dave Keller, CMT reviews six stocks that appeared on both hedge fund and mutual fund “shared favorites” lists in a recent Goldman Sachs study. He evaluates each using StockCharts tools, revealing which setups still show strength and which may be flashing warning signs....
READ MORE
MEMBERS ONLY

Is It Finally Time for Small Caps to Outperform?
by Martin Pring,
President, Pring Research
Small caps have made very little upside movement since 2021, but that could be changing. Martin Pring analyzes small-cap stocks and makes his case for a potential rally in this asset group....
READ MORE
MEMBERS ONLY

AI’s Reality Check: Oracle and Broadcom Earnings Take Center Stage
Oracle and Broadcom report earnings this week. Investors' reaction to the stocks will indicate whether software or semiconductors are leading the AI arms race....
READ MORE
MEMBERS ONLY

Nifty Stays Cautious Near Highs Amid Soft Breadth
by Milan Vaishnav,
Founder and Technical Analyst, EquityResearch.asia and ChartWizard.ae
The Nifty ended the week flat to mildly negative. The lack of participation from the broader market and weakening market breadth indicate that investors should be cautious. Here's a deep dive into the analytics....
READ MORE
MEMBERS ONLY

Bull or Bear? Dave Keller’s Four Scenarios for the Nasdaq’s Next Move
by David Keller,
President and Chief Strategist, Sierra Alpha Research
The Nasdaq 100 sits near record highs, but where does it go from here? Dave Keller, CMT, lays out four scenarios—ranging from a Santa Claus rally to a deeper correction—and assigns probabilities to each to help investors prepare for early 2026’s next big move....
READ MORE
MEMBERS ONLY

The AI Revival: Why Investors Are Circling Back

by Mary Ellen McGonagle,
President, MEM Investment Research
Investors are rotating back into stocks that pulled back in between October and November. Here are stocks that saw renewed interest last week....
READ MORE
MEMBERS ONLY

As Technology Loses Its Luster, What Stocks Should You Consider?
by Tom Bowley,
Chief Market Strategist, EarningsBeats.com
Technology has lost its momentum. Until it shows more leadership, it makes sense to focus on other areas of the market for potential investment opportunities. ...
READ MORE
MEMBERS ONLY

Two Currencies May Be About to Go Bullish for Commodities
by Martin Pring,
President, Pring Research
The Australian dollar and Canadian dollar may be getting ready to strengthen against the US dollar. Martin Pring analyzes these two commodity-based currencies and discusses which direction the two are likely to move....
READ MORE
MEMBERS ONLY
The Stock Market Is Quiet… but Something Big Is Brewing Under the Surface
by Jayanthi Gopalakrishnan,
Director of Site Content, StockCharts.com
Market breadth is strengthening as small caps, transports, and banks show leadership. See what these trends mean for the next potential breakout. ...
READ MORE
MEMBERS ONLY

Top Charts for December: When the 200-Day Becomes the Deciding Factor
by David Keller,
President and Chief Strategist, Sierra Alpha Research
The 200-day moving average remains one of the most powerful tools in technical analysis. Dave Keller, CMT, spotlights three stocks—COO, COIN, and HBAN—where this long-term trendline is shaping potential bullish reversals, bearish setups, and breakout recoveries....
READ MORE
MEMBERS ONLY
David Keller's December Playbook: 10 Charts You Should See
by David Keller,
President and Chief Strategist, Sierra Alpha Research
If you're looking for a quick pulse of the stock market heading into the last month of the year, David Keller, CMT, just dropped a video breaking down the 10 charts he's watching, and there's a lot to unpack.
Some stocks are powering higher...
READ MORE
MEMBERS ONLY

The Santa Setup: What December Intermarket Price Action Might Look Like
Historical stock market patterns point to strength heading into Christmas. Keep an eye on the US dollar, Treasury yields, retail stocks, and volatility as we close out the year....
READ MORE
MEMBERS ONLY

Will Santa Keep on Giving? Or Will the Grinch Finally Come to Wall Street?
by Martin Pring,
President, Pring Research
The S&P and NYSE Composites have reached resistance. Can the push through, or will they back off?...
READ MORE
MEMBERS ONLY

Nifty Breaks Out, Breadth Lags: Cautious Optimism Ahead
by Milan Vaishnav,
Founder and Technical Analyst, EquityResearch.asia and ChartWizard.ae
Nifty is in an uptrend and continues to scale new heights, but the market remains somewhat narrow. Are we approaching a zone of resistance?...
READ MORE
MEMBERS ONLY
Market Strength Broadens — What’s Powering This Rally?
by Mary Ellen McGonagle,
President, MEM Investment Research
Mary Ellen McGonagle breaks down this week’s market pullback and the key chart signals emerging after the break below support. She highlights the areas still showing strength and where potential opportunities may be forming beneath the surface....
READ MORE
MEMBERS ONLY

The US Dollar Index Hits a Critical Crossroad: Will It Reverse or Rally?
by Martin Pring,
President, Pring Research
The US Dollar Index has reached a key resistance level. Will it break through it and rally higher? Martin Pring provides his expert insight into the dollar's potential to rally....
READ MORE
MEMBERS ONLY
Stocks Bounce Back: Is This the Start of Something Bigger?
by Jayanthi Gopalakrishnan,
Director of Site Content, StockCharts.com
Market breadth is turning bullish while sentiment lags. Get a clear breakdown of what's driving this week's market action....
READ MORE
MEMBERS ONLY

Apple Leads, Amazon Lags, Nvidia Wobbles: Sorting the Magnificent 7 by Trend Strength
by David Keller,
President and Chief Strategist, Sierra Alpha Research
The Magnificent 7 are showing clear divergence from each other in November. Apple continues its breakout, Nvidia struggles after earnings, and Amazon teeters on key support. Dave Keller, CMT, breaks down the technical setups that could shape December’s market trend....
READ MORE
MEMBERS ONLY

Nifty Near Highs as Sector Leadership Rotates on RRG
by Milan Vaishnav,
Founder and Technical Analyst, EquityResearch.asia and ChartWizard.ae
The Nifty is at a crucial inflection zone, trading just below its all-time high; could it see a breakout?...
READ MORE
MEMBERS ONLY

Breakdown or Opportunity? What the Charts Reveal Now
by Mary Ellen McGonagle,
President, MEM Investment Research
Mary Ellen McGonagle breaks down this week’s market pullback and the key chart signals emerging after the break below support. She highlights the areas still showing strength and where potential opportunities may be forming beneath the surface....
READ MORE
MEMBERS ONLY

Did The Strong Reversal on Friday Mark The Bottom?
by Tom Bowley,
Chief Market Strategist, EarningsBeats.com
There's a lot of noise in the market right now, but the longer-term perspective shows the major indexes testing key support levels. Investor sentiment may also be shifting. What could lie ahead? Take a look at these charts....
READ MORE
MEMBERS ONLY

StockCharts Insider: John Murphy’s Law #5 - Draw the Line (Trendlines)

by Karl Montevirgen,
The StockCharts Insider
Before We Dive In…
Every chart tells some kind of a story. Without structure, however, that story can feel like noise. Trendlines help you sense the rhythm underneath the often volatile surface, showing where buyers and sellers may draw their invisible battle lines and how long those lines can hold....
READ MORE
MEMBERS ONLY

A Rough Week for Stocks — But This Sector Just Hit a New High!
by Tom Bowley,
Chief Market Strategist, EarningsBeats.com
It was a tough week for equities as major indices broke below key levels and money rotated away from growth. Tom Bowley highlights where strength is emerging — especially in healthcare and energy — and highlights stocks showing strong accumulation and breakout potential....
READ MORE
MEMBERS ONLY

Is the Market About to Turn? Key Charts Every Investor Should Watch Now
by Jayanthi Gopalakrishnan,
Director of Site Content, StockCharts.com
Stocks have pulled back quickly. Explore what NVDA's earnings, breadth indicators, and sentiment data suggest for the market's next move....
READ MORE
MEMBERS ONLY

Bitcoin Takes One More Step to Signal a Primary Bear Market
by Martin Pring,
President, Pring Research
Martin Pring analyzes Bitcoin using charts of different time frames, highlighting key support levels and divergences. Keep an eye on these charts....
READ MORE
MEMBERS ONLY

Consumer Watch: A Costco Breakdown Could Be the Market’s Biggest Warning Yet
Consumer Discretionary and Consumer Staples are lagging the most in sector performance. Costco's chart could send an early warning signal in consumer sentiment....
READ MORE