MEMBERS ONLY

StockCharts Insider: John Murphy’s Law #3 — Find the Low and High of It (Support & Resistance)

by Karl Montevirgen,
The StockCharts Insider
Before We Dive In…
If you could spot where price is likely to bounce, stall, or reverse, you’d probably time entries and exits a lot better. That’s Law #3: find support and resistance—plus the polarity principle, where broken resistance often becomes support, and vice versa.
The Core...
READ MORE
MEMBERS ONLY
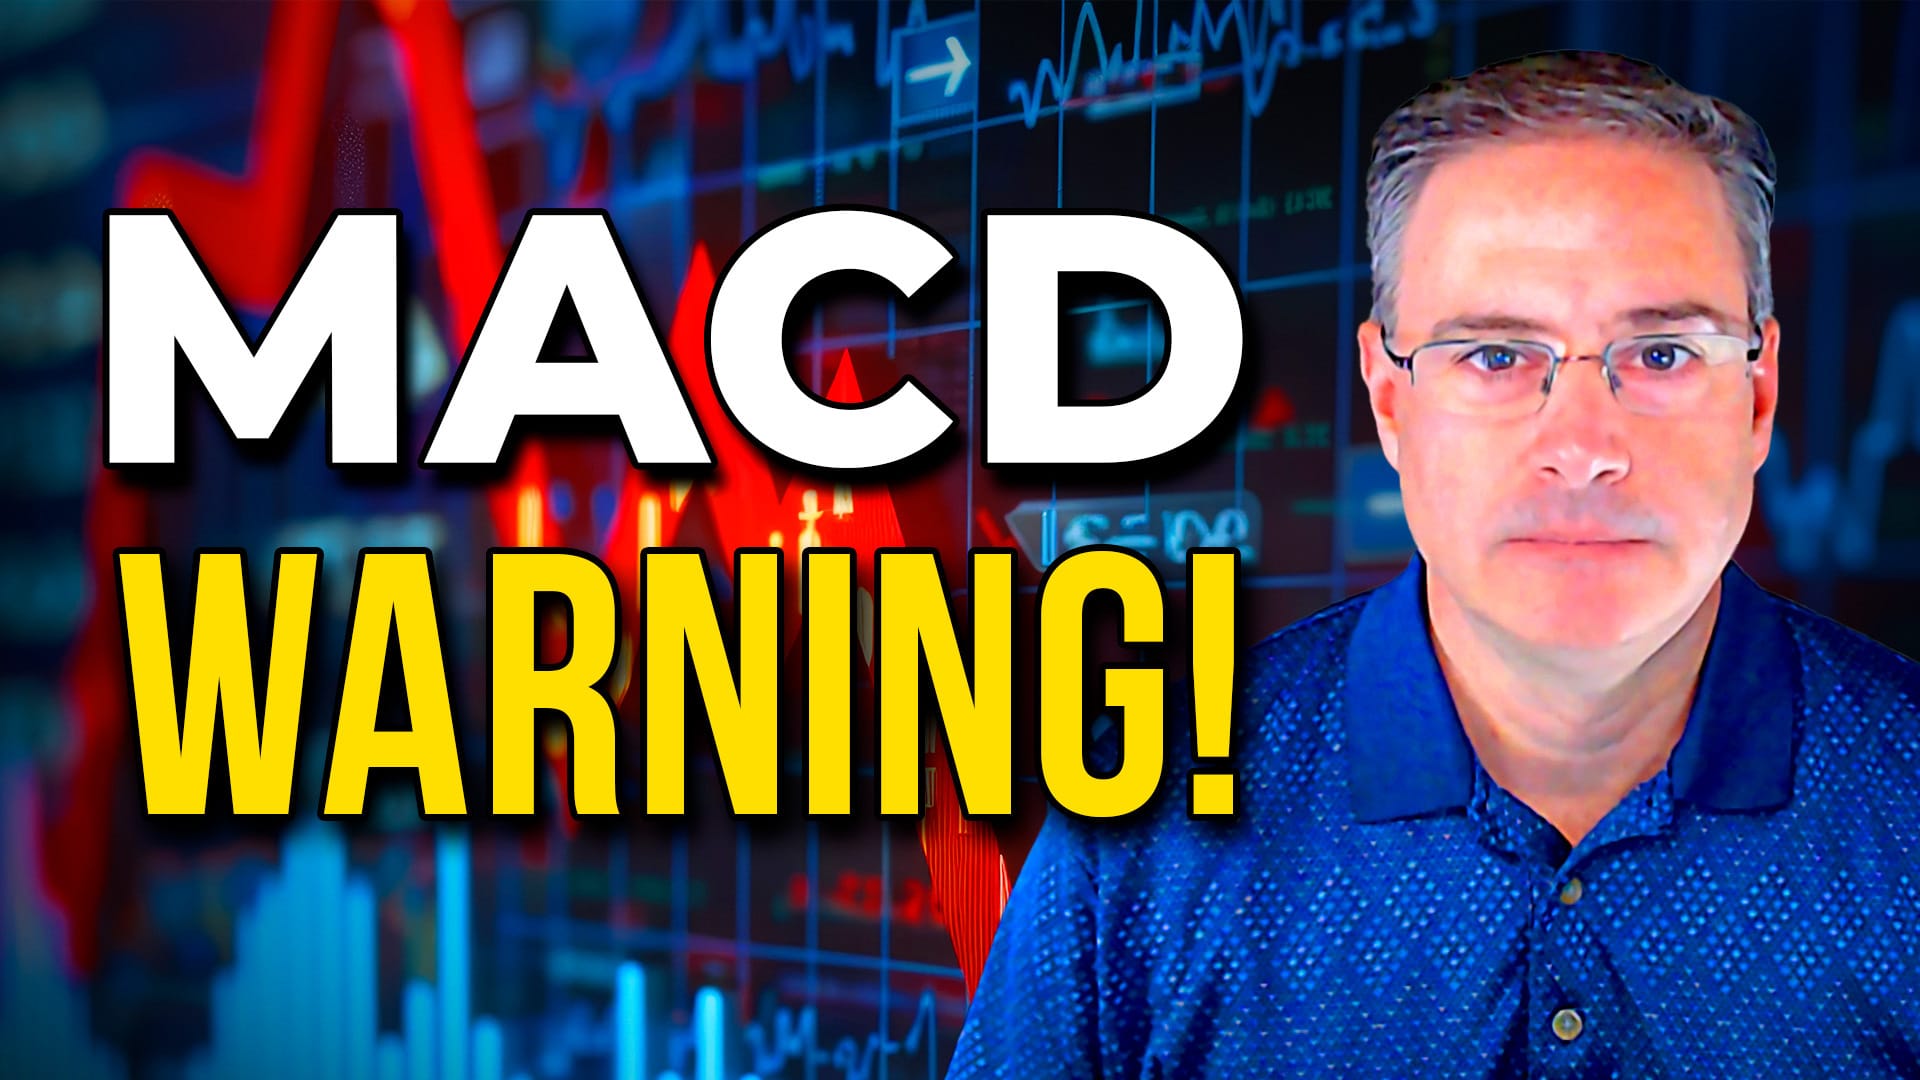
MACD Warning for S&P 500! Momentum Shift Underway

by Joe Rabil,
President, Rabil Stock Research
Joe Rabil breaks down the MACD warning and weakening momentum in the S&P 500 as the index tests support near its 18-week moving average. Additionally, he reviews Bitcoin’s reversal setup and highlights stocks with improving relative strength and trend structure....
READ MORE
MEMBERS ONLY
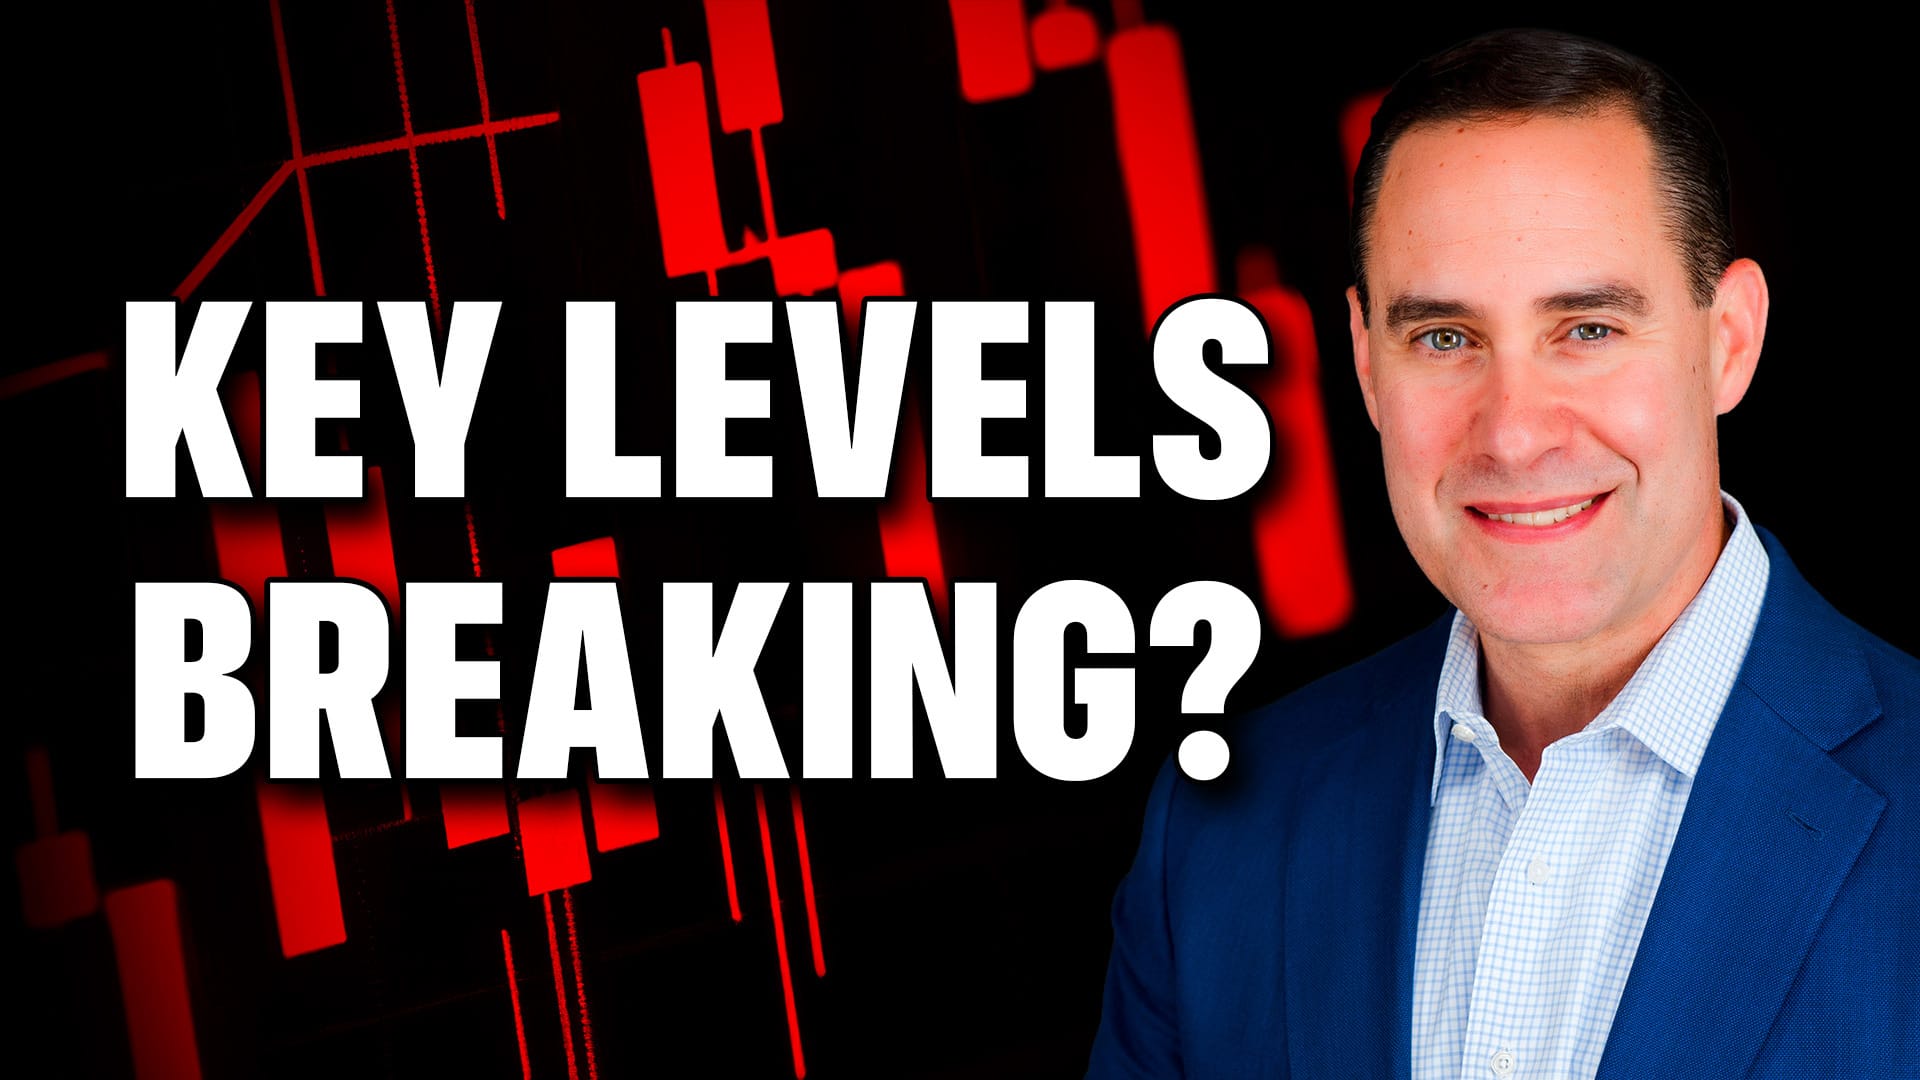
S&P 500 Shows Topping Signs! Financials and Semis at Key Levels

by Frank Cappelleri,
Founder & President, CappThesis, LLC
Frank Cappelleri breaks down a major market inflection point as the S&P 500 tests a topping pattern and several key levels. He also reviews financials and semiconductors where structure shifts and breakdown risks may determine the next move....
READ MORE
MEMBERS ONLY

StockCharts Insider: John Murphy’s Law #1 — Map the Trends
by Karl Montevirgen,
The StockCharts Insider
Before We Dive In…
While the tools and strategies we use to analyze markets have evolved, human behavior has remained consistent (more or less). That’s why John Murphy’s Ten Laws of Technical Trading is as relevant today as it was during the long course of history from which...
READ MORE
MEMBERS ONLY

Megaphone Pattern + Death Cross: Bitcoin’s Technicals Flash a Warning
Cryptocurrencies have been under pressure, and two key chart developments indicate further downside. Here's what you need to watch as the year-end approaches....
READ MORE
MEMBERS ONLY

Charting the Week Ahead: Where Is Nifty Headed Next?

by Milan Vaishnav,
Founder and Technical Analyst, EquityResearch.asia and ChartWizard.ae
Nifty's current technical setup reflects a strong market, steadily grinding higher. What does the coming week have in store?...
READ MORE
MEMBERS ONLY

The Market’s Stuck in Neutral: What Could Break the Standstill?

by Jayanthi Gopalakrishnan,
Director of Site Content, StockCharts.com
The stock market churned but went nowhere this week as breadth held steady and rate-cut odds shifted. Here's what investors should watch next week....
READ MORE
MEMBERS ONLY

Market Rotation: What’s Really Happening Beneath the Surface

by Mary Ellen McGonagle,
President, MEM Investment Research
While the stock market indexes are looking range-bound, there's a shift in what's driving the market's performance. Find out what's going on beneath the surface....
READ MORE
MEMBERS ONLY
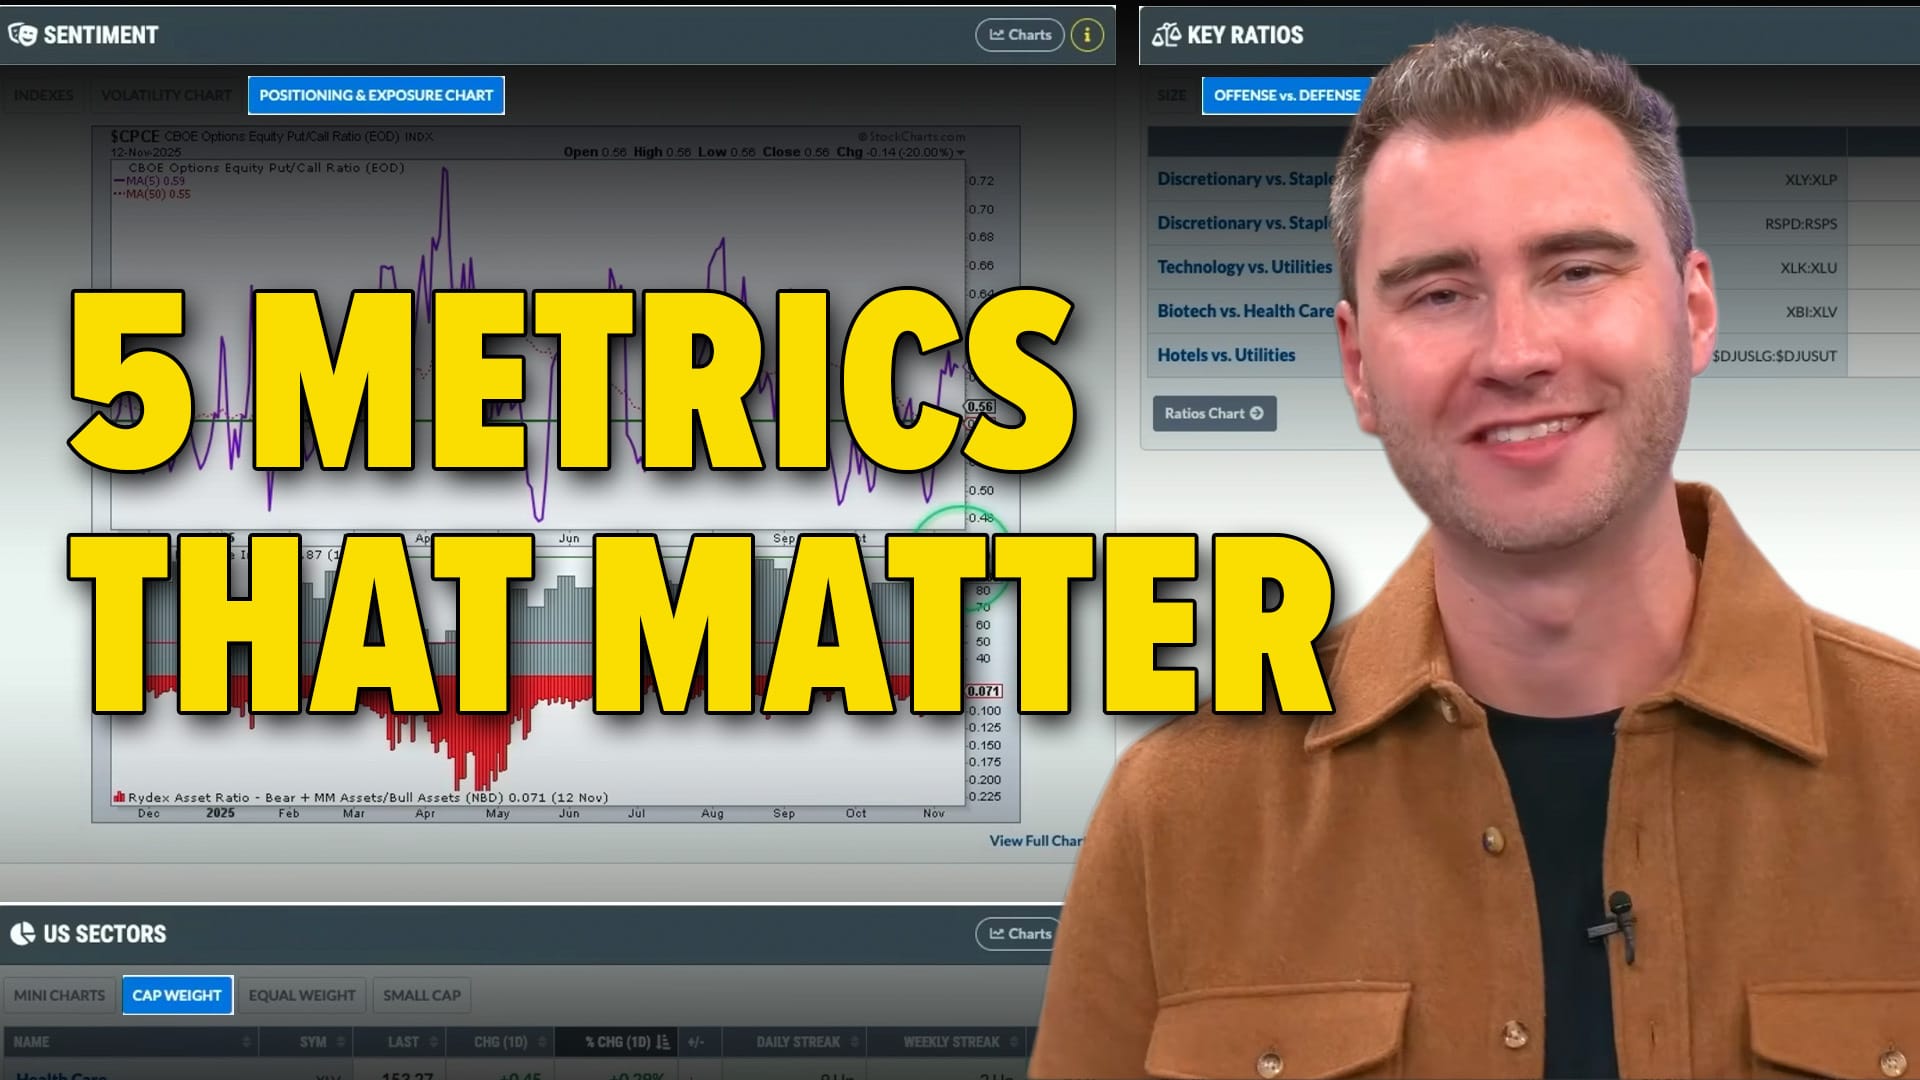
Market Top or Bullish Bounce? Watch These Top 5 Crucial Market Metrics to Decide!

by Grayson Roze,
Chief Strategist, StockCharts.com
With the market just a shout away from its all-time highs, Grayson Roze shares five market metrics every trader should watch using StockCharts’ Market Summary Dashboard. Learn how he tracks trends, breadth, sentiment, and sector strength to uncover what’s really driving the market....
READ MORE
MEMBERS ONLY

Small Caps Break Down, VIX Surges. What's Next?

by Tom Bowley,
Chief Market Strategist, EarningsBeats.com
Small-cap stocks have broken below a key support level. Volatility is also creeping higher. Tom Bowley shares his views by breaking down several charts....
READ MORE
MEMBERS ONLY

Cracks within Tech; Bonds Outperform, Bitcoin; Insurance Names Catch a Strong Bid

by Arthur Hill,
Chief Technical Strategist, TrendInvestorPro.com
When technology ETFs are breaking down, insurance stocks and bonds are showing strength, and Bitcoin is triggering a downtrend, it means the stock market is showing signs of risk aversion. Arthur Hill analyzes charts of these asset groups and identifies the signals they are sending....
READ MORE
MEMBERS ONLY

The Sneaky Bull Market Nobody’s Talking About: Commodities
Commodities are making a bullish run in a seasonally weak period. Keep an eye on this potentially leggy asset class and find out how you can take advantage of the commodity run....
READ MORE
MEMBERS ONLY

Three Stocks That Could Benefit Most from Tariff Relief — If the Charts Agree

by David Keller,
President and Chief Strategist, Sierra Alpha Research
With talk of tariffs being rolled back, stocks like Best Buy, Stanley Black & Decker, and Nike could benefit from renewed optimism. But, as Dave, explains, the charts tell the real story, revealing which names are technically ready to lead the next move higher....
READ MORE
MEMBERS ONLY

The Tariff Relief Playbook: 10 Stocks with Upside Potential
by David Keller,
President and Chief Strategist, Sierra Alpha Research
Which stocks could benefit the most if trade tariffs are rolled back? Dave highlights ten potential winners—including CAT, NKE, and more—and shows how to use StockCharts tools to uncover trend strength and opportunities....
READ MORE
MEMBERS ONLY
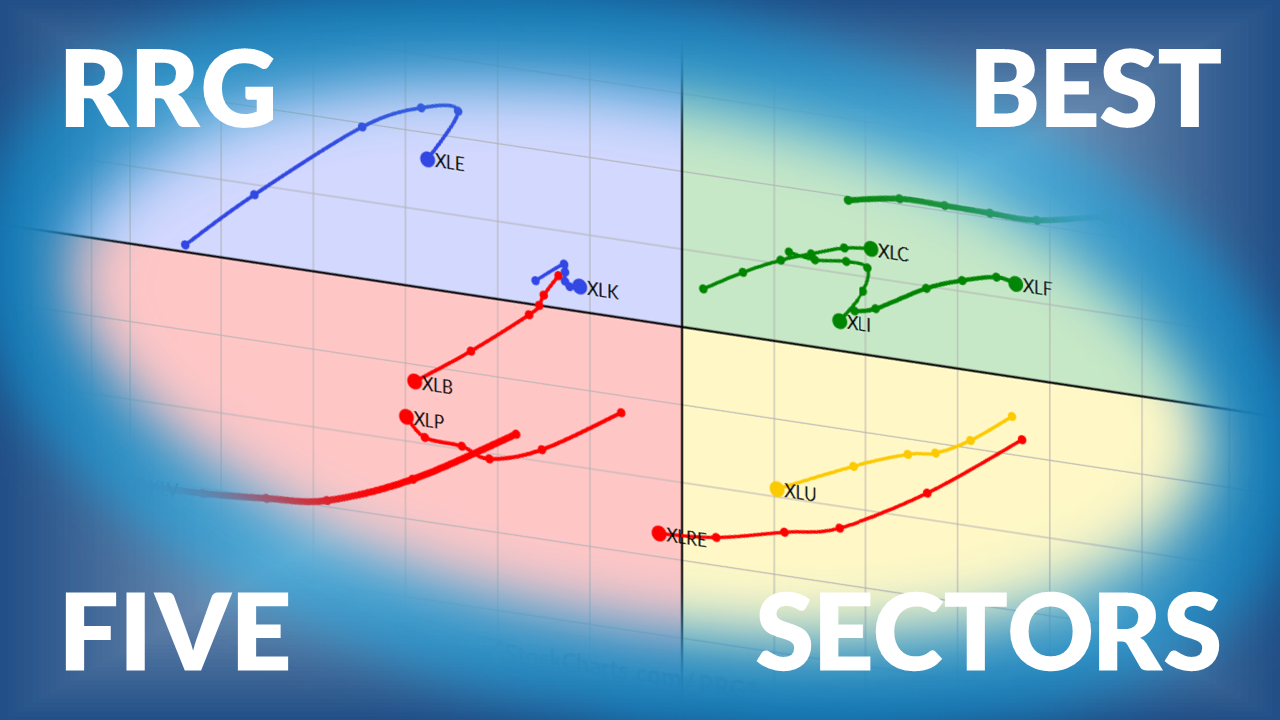
The Best Five Sectors This Week, #44

by Julius de Kempenaer,
Senior Technical Analyst, StockCharts.com
Julius presents his weekly update on US sector ranking based on Relative Rotation Graphs....
READ MORE
MEMBERS ONLY

What Lies Ahead for Nifty? A Look at the Week Ahead
by Milan Vaishnav,
Founder and Technical Analyst, EquityResearch.asia and ChartWizard.ae
The Nifty is in a state of flux, testing its symmetrical triangle pattern. Could an uptrend be on the horizon, or will we see incremental downside?...
READ MORE
MEMBERS ONLY

Is The Sharp Advance In Technology Stocks Over?
by Mary Ellen McGonagle,
President, MEM Investment Research
Has the rotation into Tech peaked? Or is this just a pause within a longer-term leadership trend? Mary Ellen explores with a look at the sector chart and an individual stock....
READ MORE
MEMBERS ONLY

Change of Character: Why the S&P 500’s Uptrend May Be Breaking Down
by David Keller,
President and Chief Strategist, Sierra Alpha Research
The S&P 500 has broken below its 21-day EMA and key trend channel support, testing its 50-day moving average as market breadth weakens. With tech leaders like NVDA and AVGO tumbling, investors should watch for a possible rotation toward defensive sectors....
READ MORE
MEMBERS ONLY

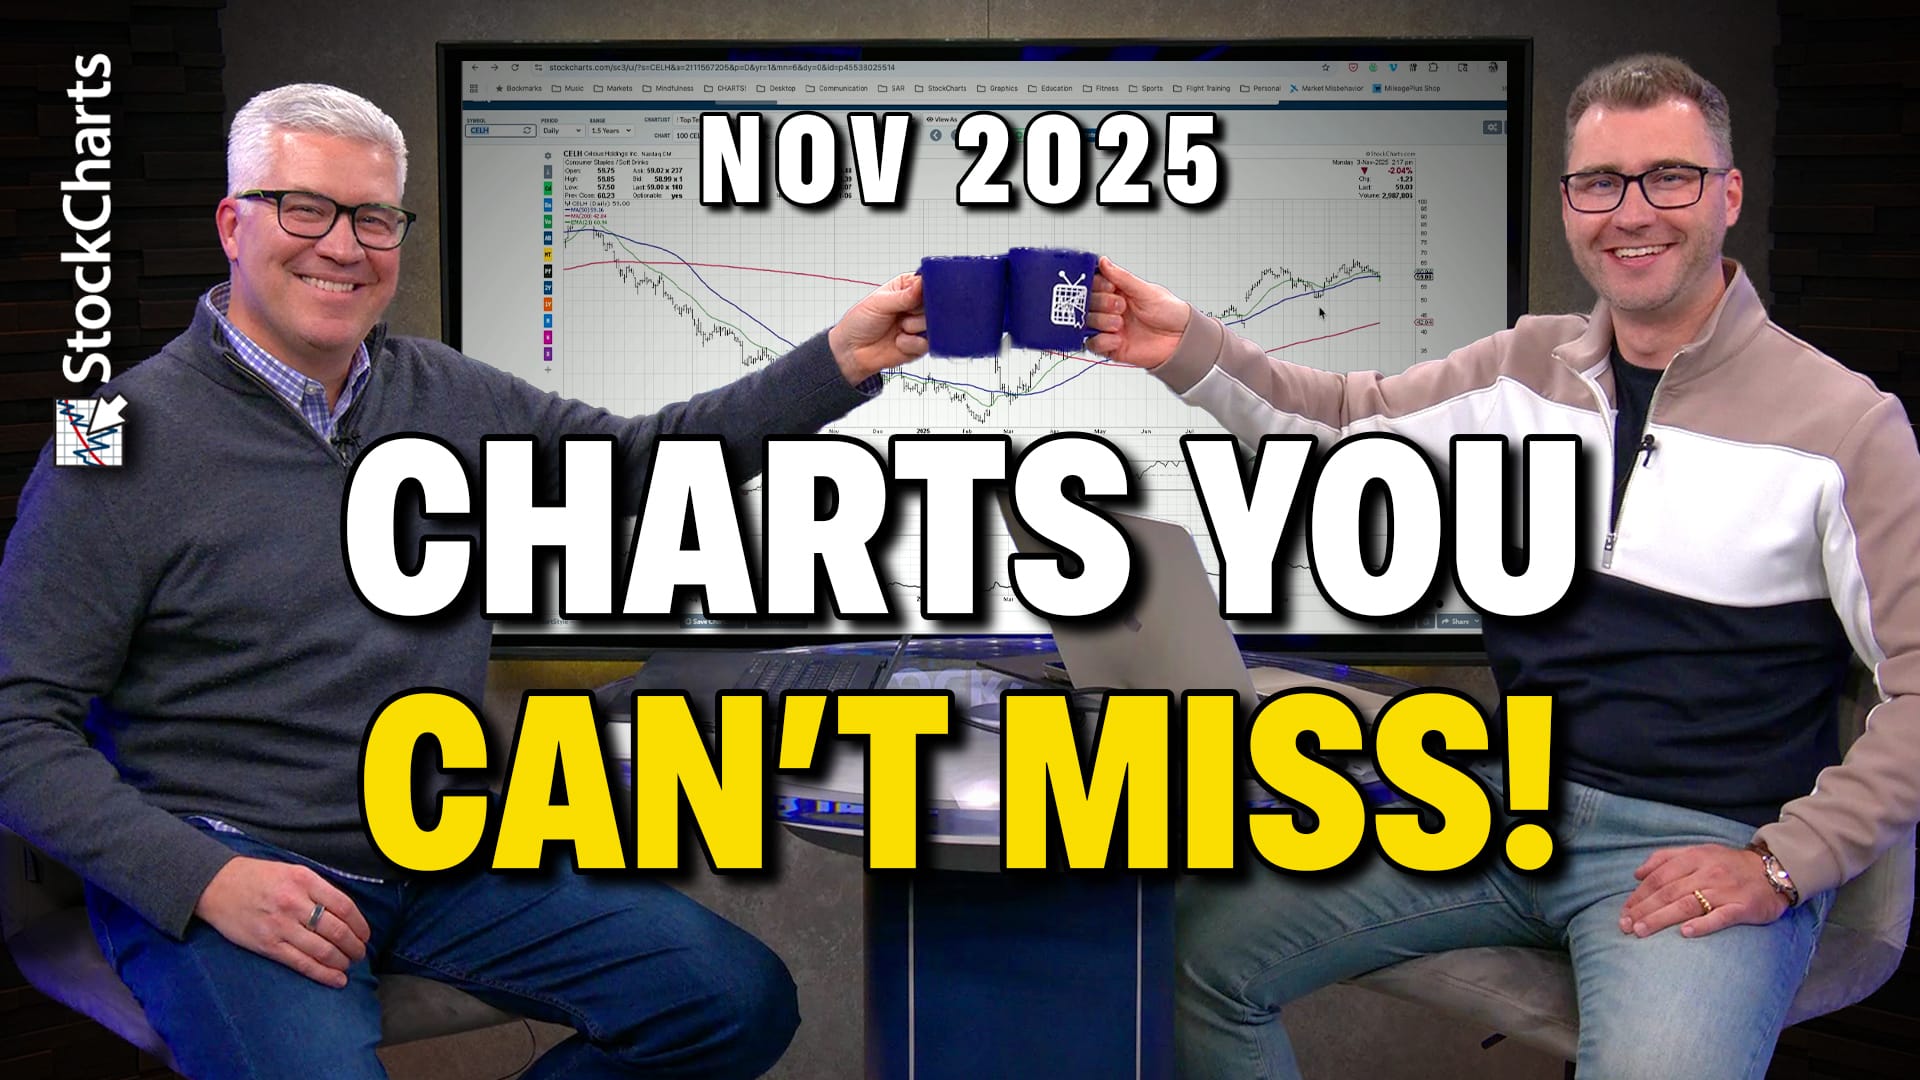
Will “Buy the Dips” Work Again in November 2025?
by David Keller,
President and Chief Strategist, Sierra Alpha Research
Identifying a true uptrend means watching for higher lows and key support levels. Charts of CELH, BAC, and CAT show how dip-buying and moving-average support reveal whether bullish momentum will continue or signal a shift toward a bearish phase....
READ MORE
MEMBERS ONLY
Breakouts, Pullbacks & Setups: 10 Must-Watch Charts for November
by Grayson Roze,
Chief Strategist, StockCharts.com
by David Keller,
President and Chief Strategist, Sierra Alpha Research
Grayson Roze and David Keller share ten charts to watch for November, including setups in Celsius, Regeneron, Caterpillar, Eli Lilly, and Shopify. Learn how they use StockCharts tools and trend analysis to locate strength and manage risk in a stretched bull market....
READ MORE
MEMBERS ONLY

Fed Chair Says, “It’s Cloudy”; These Benchmarks Could Blow the Clouds Away

by Martin Pring,
President, Pring Research
Martin Pring analyzes charts of US Treasury yields, which suggest there may be some disagreement between the market and the Fed....
READ MORE
MEMBERS ONLY

When Market Leaders Falter: What Recent Moves in the Magnificent 7 Mean for Investors
by David Keller,
President and Chief Strategist, Sierra Alpha Research
As the Magnificent 7 dictate the tone for the S&P 500, their charts reveal early signs of fatigue amid mixed earnings reactions. Technical discipline remains essential as investors assess whether these former leaders can sustain their uptrends into year-end....
READ MORE
MEMBERS ONLY

StockCharts Insider: How to Find a Seasonal Edge in Stocks by Cracking the Market’s Hidden Calendar
by Karl Montevirgen,
The StockCharts Insider
Before We Dive In…
For every story a chart tells, there are stories hidden from plain view. One story tends to repeat itself almost like clockwork, though it also comes with variations. That’s what seasonality is all about: odd months where stocks tend to shine, stumble, or stall. In...
READ MORE
MEMBERS ONLY

5 Stocks Showing Powerful ADX Signals
by Joe Rabil,
President, Rabil Stock Research
Joe Rabil explains how to use ADX to spot strength, trend, and breakout setups across different timeframes. He highlights five stocks with strong ADX patterns and reviews the latest S&P market conditions and stock requests to watch....
READ MORE
MEMBERS ONLY

Jensen > Jay: NVIDIA Takes the Spotlight from the Fed and Mag 7 Earnings
NVIDIA shares reached a record $5 trillion in market cap. Here's a deep dive into the stock's price action and what could keep it in the driver's seat....
READ MORE
MEMBERS ONLY

This Head and Shoulders Pattern Looked Perfect… Until It Failed!
by David Keller,
President and Chief Strategist, Sierra Alpha Research
Learn how to spot valid head and shoulders patterns and when to walk away. David Keller, CMT, shows how failed setups can signal strength and potential bullish reversals....
READ MORE
MEMBERS ONLY

The Week Ahead: Will Nifty Confirm a Trend Shift?
by Milan Vaishnav,
Founder and Technical Analyst, EquityResearch.asia and ChartWizard.ae
The Indian markets remained within a narrow range, but the NIFTY is making a breakout attempt. Can it move from consolidation to a trending phase?...
READ MORE
MEMBERS ONLY

3 Key Influences on Stock Performance; Bullish Continuation Patterns for Two Cybersecurity Stocks
by Arthur Hill,
Chief Technical Strategist, TrendInvestorPro.com
In a bullish market environment, with the technology sector leading the way and cybersecurity stocks in an uptrend, Arthur presents a couple of stocks that may be poised to break out....
READ MORE
MEMBERS ONLY

Three Charts That Prove the Power of Process Over Prediction
by David Keller,
President and Chief Strategist, Sierra Alpha Research
Technical analysis is about having a consistent process of evaluating the evidence. Dave revisits three charts he highlighted at the end of September, reviews how the technical picture has changed, and updates his thesis using price and momentum techniques....
READ MORE
MEMBERS ONLY

StockCharts Insider: GMMA—Your Market X-Ray
by Karl Montevirgen,
The StockCharts Insider
Before We Dive In…
You’re about to learn something unique: how to gauge trend strength and seize market opportunities using two sets of eyes. The GMMA splits price action into short-term and long-term views, giving you two perspectives on the same market. With one eye on fast-...
READ MORE
MEMBERS ONLY

Will These Broken Charts Overcome Bearish Divergences?
by David Keller,
President and Chief Strategist, Sierra Alpha Research
Bearish momentum divergences can help provide a game plan for confirming potential price breakdowns. We review three charts to see how they have evolved since a bearish rotation, and focus on identifying potential entry points for the next rally phase....
READ MORE