MEMBERS ONLY

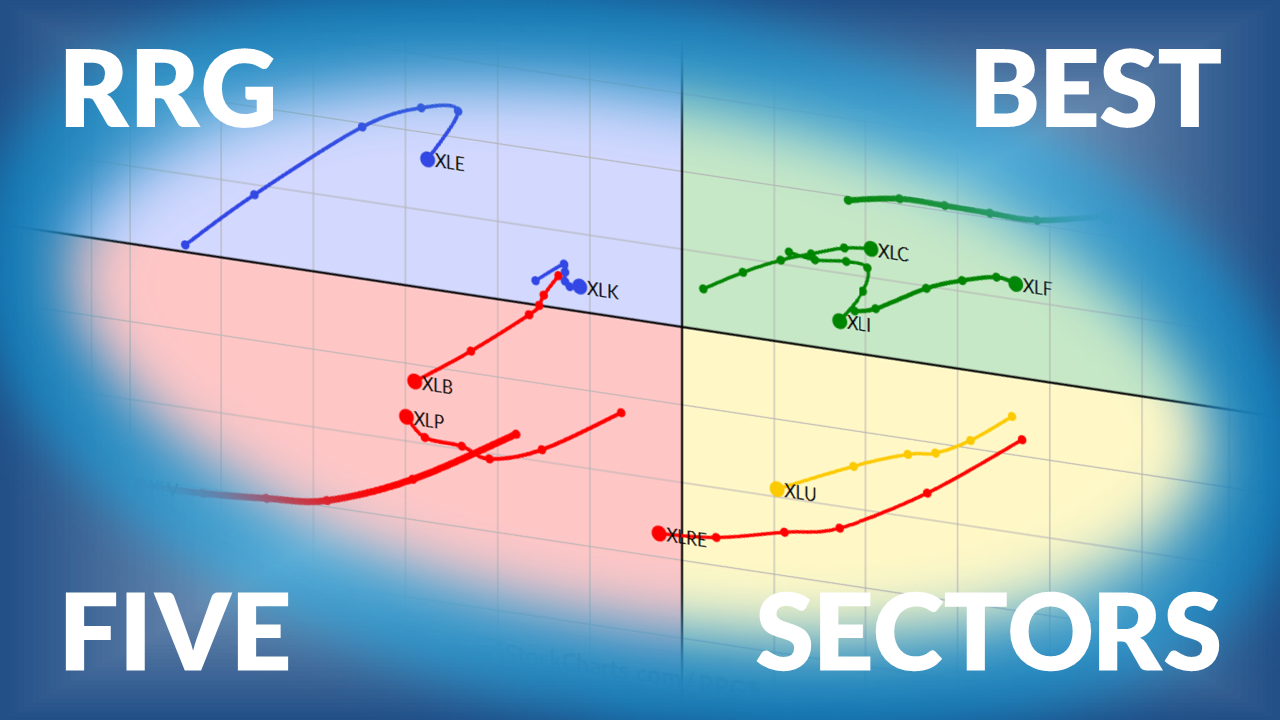
The Best Five Sectors This Week #58

Julius de Kempenaer presents his weekly update on US sector rotation using Relative Rotation Graphs.... READ MORE
Julius de Kempenaer presents his weekly update on US sector rotation using Relative Rotation Graphs.... READ MORE


Sentiment has turned more bearish, but is it bearish enough to signal a market low? Join Dave Keller as he reviews the VIX, AAII survey, NAAIM exposure, and put/call ratios to show why conditions may not be extreme just yet.... READ MORE


Before We Dive In… You’re looking at two stocks. Both seem promising. Both are starting to move. But which one do you trade? Spend five minutes on social media forums and you’ll see this question pop up everywhere. Many traders choose based on the story, the brand, or... READ MORE


With equities and other asset classes falling hard and bond yields rising, traders and investors are looking for a bottom to get back in. Mike Zaccardi analyzes the S&P 500 as well as gold and oil to uncover the signals of a market bottom.... READ MORE


How long will oil prices stay elevated? Mary Ellen McGonagle analyzes the industry against the backdrop of the broader market.... READ MORE
Oil reaching above $110 is driving inflation fears and pushing interest rates higher, increasing pressure on stocks. Mary Ellen McGonagle highlights the S&P 500 breaking support, rising volatility, and which sectors are holding up vs. breaking down.... READ MORE


With volatility rising and key support nearing, a breakdown in the S&P 500 could trigger increased selling pressure. Tom Bowley analyzes the warning signs.... READ MORE


Breadth in the SPY, QQQ, and IWM are getting close to their 200-day moving averages. Arthur Hill looks beneath the surface and uncovers the price structure in the ETFs and analyzes the BBB spread.... READ MORE

Before We Dive In… Last time, I showed how an index can keep climbing even as fewer stocks do the work; rallies that look strong but may already be weakening underneath. The Bullish Percent Index (BPI) measures how many stocks in an index are flashing Point & Figure buy signals.... READ MORE


Are you struggling to make sense of a headline-driven stock market? Learn how a simple ChartList can help you stay focused, reduce uncertainty, and spot key market reversals.... READ MORE

Hot inflation data and Fed uncertainty triggered a sharp late-day selloff in stocks and bonds. Tom Bowley breaks down weakening breadth, rising volatility, and why the S&P 500’s key support level could determine what happens next.... READ MORE

A market pullback with improving sentiment may be setting up the next move higher. Follow along as Joe Rabil highlights key signals and stocks showing constructive setups.... READ MORE

Investor pessimism is spiking. Discover what the critical sentiment signals say now and bookmark these charts to catch the moment the market reverses toward optimism.... READ MORE

Before We Dive In… When the S&P 500 makes a 1% move up, it feels like the market is exhibiting strength. But is it? Sometimes an index will rise because a handful of mega-caps are doing the heavy lifting. What you don’t see are the other stocks... READ MORE
Why hasn’t the market broken down, even amid weakening breadth? Dave Keller shows how a small group of mega-cap stocks may be holding the indexes together, and the key levels that could decide the next market move.... READ MORE


With the Indian market ending the week in the negative and volatility elevated, Milan Vaishnav digs into what the coming days hold for the Nifty.... READ MORE
Oil volatility is creating a chain reaction across markets as rising prices, fuel inflation fears, and push interest rates higher. Follow along as Mary Ellen McGonagle highlights the sectors weakening, the areas holding up, and the key levels investors should be watching.... READ MORE

Despite geopolitical tensions, the S&P 500 has held up well and is relatively close to its recent highs. When does the pullback turn into a long-term downtrend? Arthur Hill analyzes the market environment and highlights what investors should monitor.... READ MORE
The S&P 500 may look stable, but market breadth is quietly deteriorating. Dave Keller breaks down key breadth indicators and explains why weakening participation could signal trouble ahead.... READ MORE

Fear is rising across markets as volatility spikes and headlines pile up. In this video, Tom Bowley explains why key accumulation signals and improving growth leadership suggest buyers are still supporting this market.... READ MORE

The stock market is sending mixed signals. See what the charts reveal about current trends and why semiconductors may lead the next move.... READ MORE

Joe Rabil highlights several tech stocks forming constructive pullbacks that could soon trigger upside breakouts. He also reviews S&P 500 market conditions, key support levels, and how relative strength helps confirm emerging setups.... READ MORE

S&P 500 pullbacks keep attracting buyers, even as momentum signals weaken. Join Frank Cappelleri as he explains why dip-buying continues to support the market in spite of rising volatility and mixed technical signals.... READ MORE
Julius presents his weekly sector rotation update based on Relative Rotation Graphs.... READ MORE

Nifty has slipped back and closed exactly at its 100-week moving average, which has historically been a support level. Is it at risk for more downside?... READ MORE

Rising oil prices are increasing investor fear. We're seeing a broad risk-off shift across institutional portfolios. Here's what you can expect, going forward. ... READ MORE

The stock market turned volatile as oil prices surged. Here's what the charts are telling investors about the market's next move.... READ MORE
The stock market has been rattled by geopolitical headlines, which have driven up crude oil prices. In this video, Tom Bowley shares his observations on what's happening beneath the surface.... READ MORE


Faced with an extended range-bound structure for QQQ, Bruce Fraser presents a PnF case study as he considers the progress of the bull market uptrend.... READ MORE

With Nifty hovering about its 50-week moving average but trading below the 20-week, price action suggests a loss of upside momentum. What could it take to open the door for an up move?... READ MORE
In spite of strong Nvidia earnings, the broader AI trade showed fatigue. Mary Ellen McGonagle highlights rotation into healthcare leaders and selective consumer discretionary stocks, but highlights where this market demands careful positioning going forward.... READ MORE

The stock market is consolidating, not collapsing. Here's what sector rotation, moving averages, and the VIX reveal about what may come next.... READ MORE
A major Supreme Court tariff ruling has left the S&P 500 pinned, but the bigger story may be where money is moving. Tom Bowley breaks down the rotation into utilities, energy, and materials as Treasury yields fall, explaining why that shift matters.... READ MORE


There has been a shift in market leadership, suggesting that we may be in the later stages of a business cycle. Martin Pring's analysis of these rotations uncovers the scenarios we can expect during this stage.... READ MORE
With NVIDIA earnings having the potential to trigger a major move, Dave Keller takes a close look at it’s chart across multiple timeframes. From long-term PPO signals to key support and resistance, he explains the critical features that could confirm a breakout or breakdown.... READ MORE

The Nifty continues to consolidate just below a crucial resistance band while maintaining a broader uptrend. What would be needed to for it break out?... READ MORE
Mary Ellen McGonagle analyzes how flat index performance is masking expanding sector rotation beneath the surface. She highlights confirmed strength in industrials, metals, and select reversal setups as software, retail, and parts of financials continue to lag.... READ MORE

The S&P 500 remains locked in a multi-month consolidation as leadership rotates from growth into value. Dave Keller, CMT, updates key support and resistance levels and explains how momentum signals, especially RSI, could confirm the S&P 500's next breakout or breakdown.... READ MORE
Markets whipsawed again this week as the S&P 500 continues testing critical support at 6797. Tom Bowley reviews the major indices, highlights stocks that have crushed the S&P 500 over the past three months, and launches his new “Stock Wars” segment.... READ MORE

The stock market is clearly in defensive mode but QQQ is still holding up, and its long-term breadth still hasn't turned bearish. Arthur Hill's analysis identifies the key levels to watch.... READ MORE