MEMBERS ONLY

Week Ahead: NIFTY Stays Poised in the Coming Truncated Week

by Milan Vaishnav,
Founder and Technical Analyst, EquityResearch.asia and ChartWizard.ae
The Nifty 50 is range-bound, hovering below a key resistance zone. Milan Vaishnav analyzes the chart of the Nifty and suggests when investors should consider adding positions. He also analyzes the performance of the various sectors in the Indian stock market. ...
READ MORE
MEMBERS ONLY

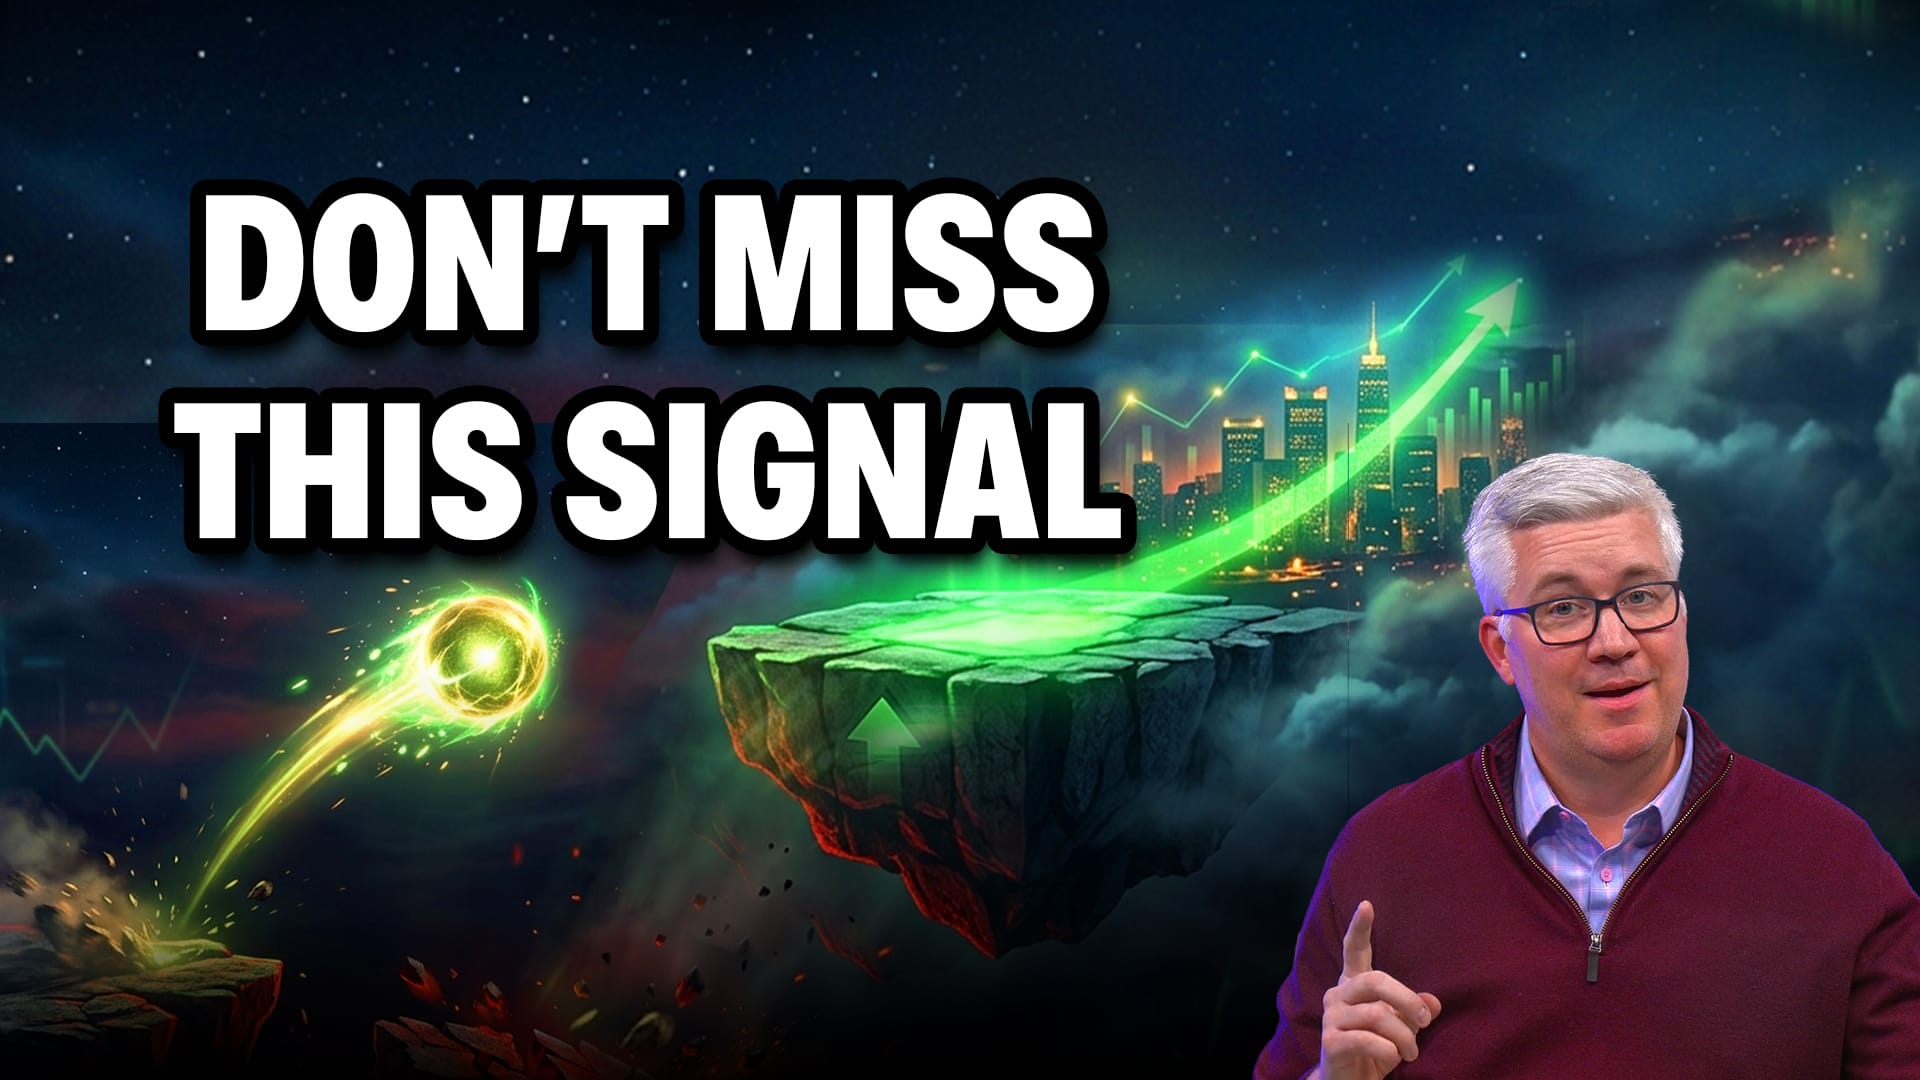
These New Areas are Driving the Market Higher

by Mary Ellen McGonagle,
President, MEM Investment Research
Stock market leadership is broadening as falling yields and lower volatility bring new groups into this rally. Mary Ellen McGonagle shares where strength is emerging beyond AI and semiconductor stocks, and why healthcare, banks, retail, and other economically sensitive areas are starting to improve....
READ MORE
MEMBERS ONLY

The Stock Market Is Broadening Out: Three Charts Make the Case
by Mary Ellen McGonagle,
President, MEM Investment Research
Stock market breadth is expanding. Mary Ellen McGonagle looks at three market breadth indicators, which are showing a healthy expansion....
READ MORE
MEMBERS ONLY
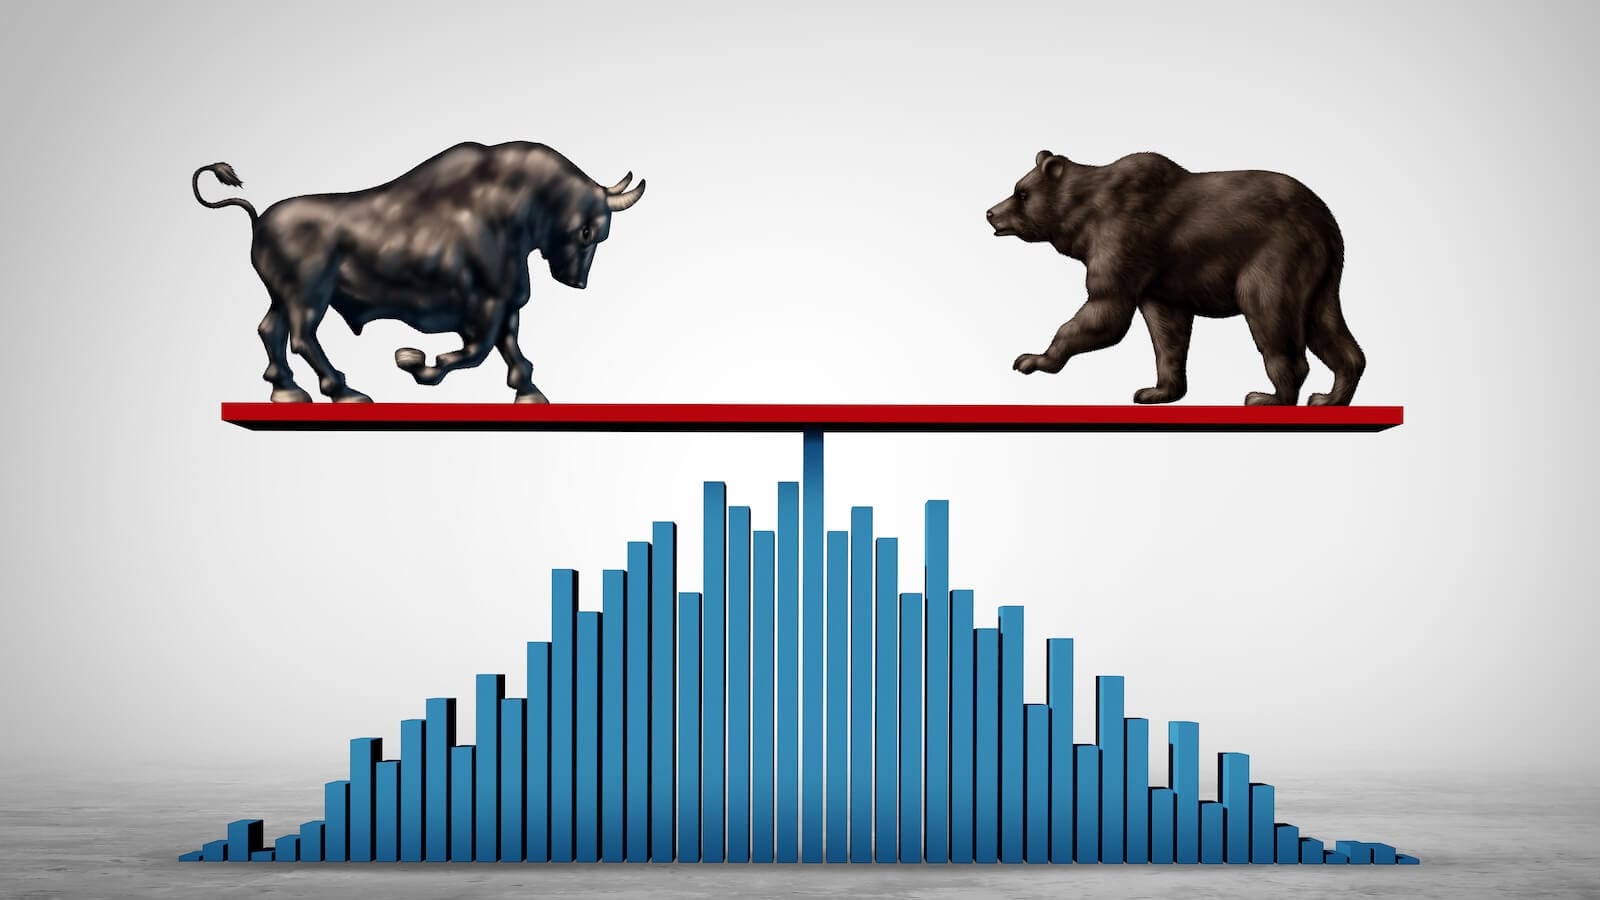
Breadth Deteriorates: Is This a Threat or an Opportunity?

by Arthur Hill,
Chief Technical Strategist, TrendInvestorPro.com
Breadth in the S&P 500 and SPY is bullish, which means bullish outcomes are more likely than bearish ones. Arthur Hill analyzes market breadth in SPY and RSP and shows that the overall tone is bullish....
READ MORE
MEMBERS ONLY

The Market Just Pulled Back — Here’s Why

by Tom Bowley,
Chief Market Strategist, EarningsBeats.com
After weeks of relentless gains, the market finally pulled back—but Tom Bowley says it wasn’t random. He explains how options expiration, market maker positioning, and sentiment extremes helped trigger the reversal....
READ MORE
MEMBERS ONLY
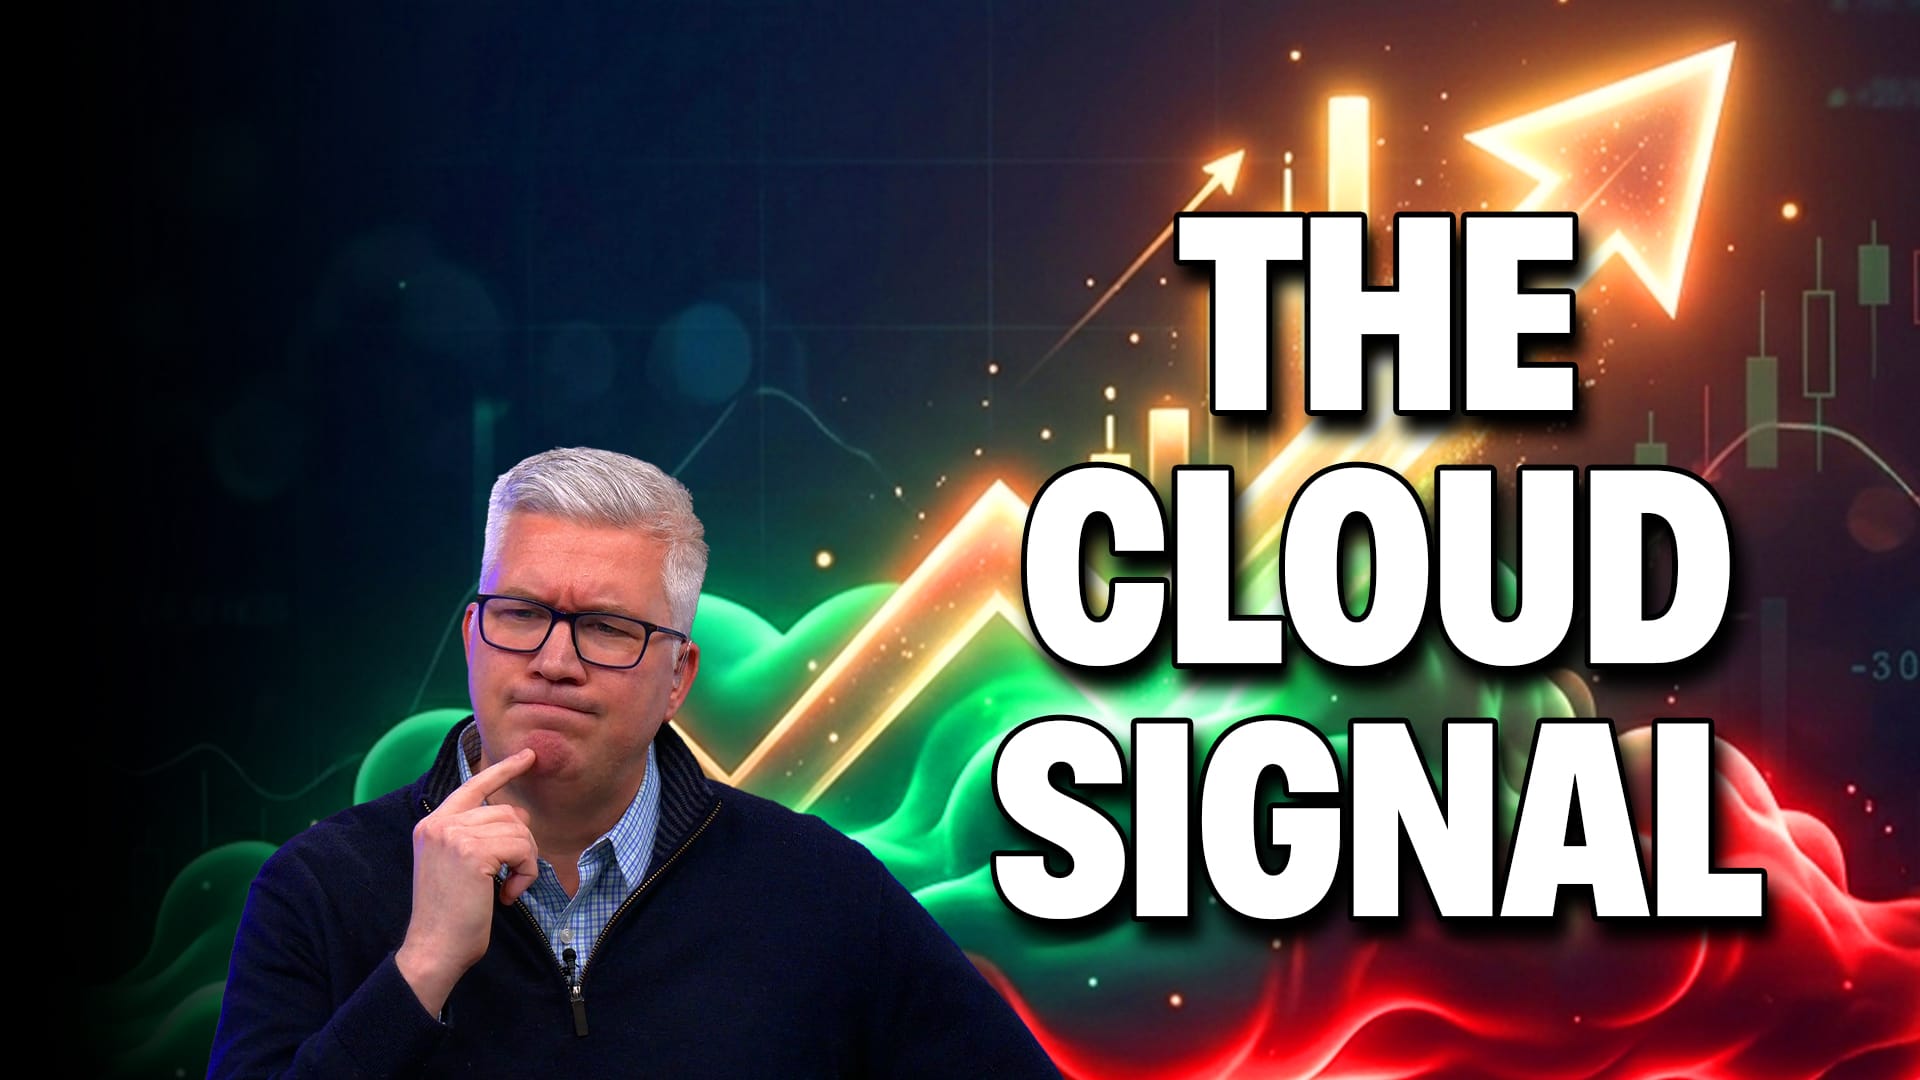
Ichimoku Cloud Charts Explained: Trend Signals Most Traders Miss

by David Keller,
President and Chief Strategist, Sierra Alpha Research
Dave Keller explains how Ichimoku Cloud charts help traders identify bullish and bearish trend shifts using real examples from Ford, CrowdStrike, and the S&P 500. Learn how the cloud can act as dynamic support and resistance during major market moves....
READ MORE
MEMBERS ONLY
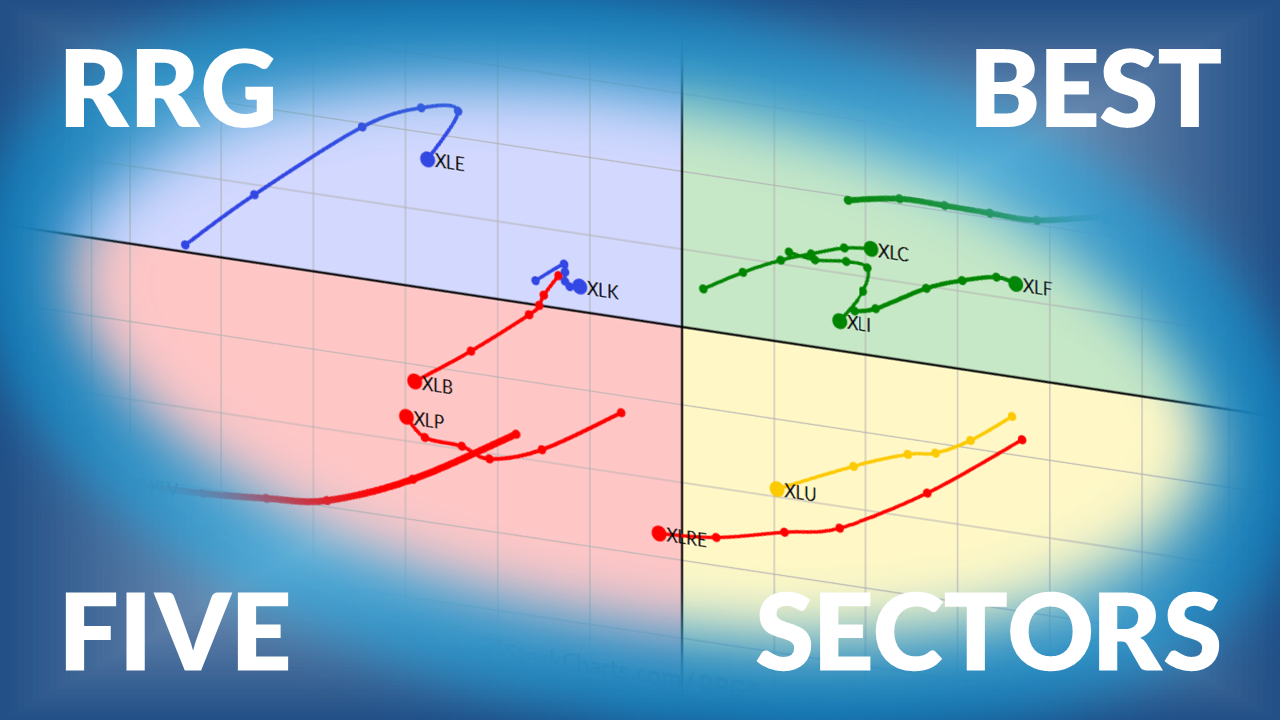
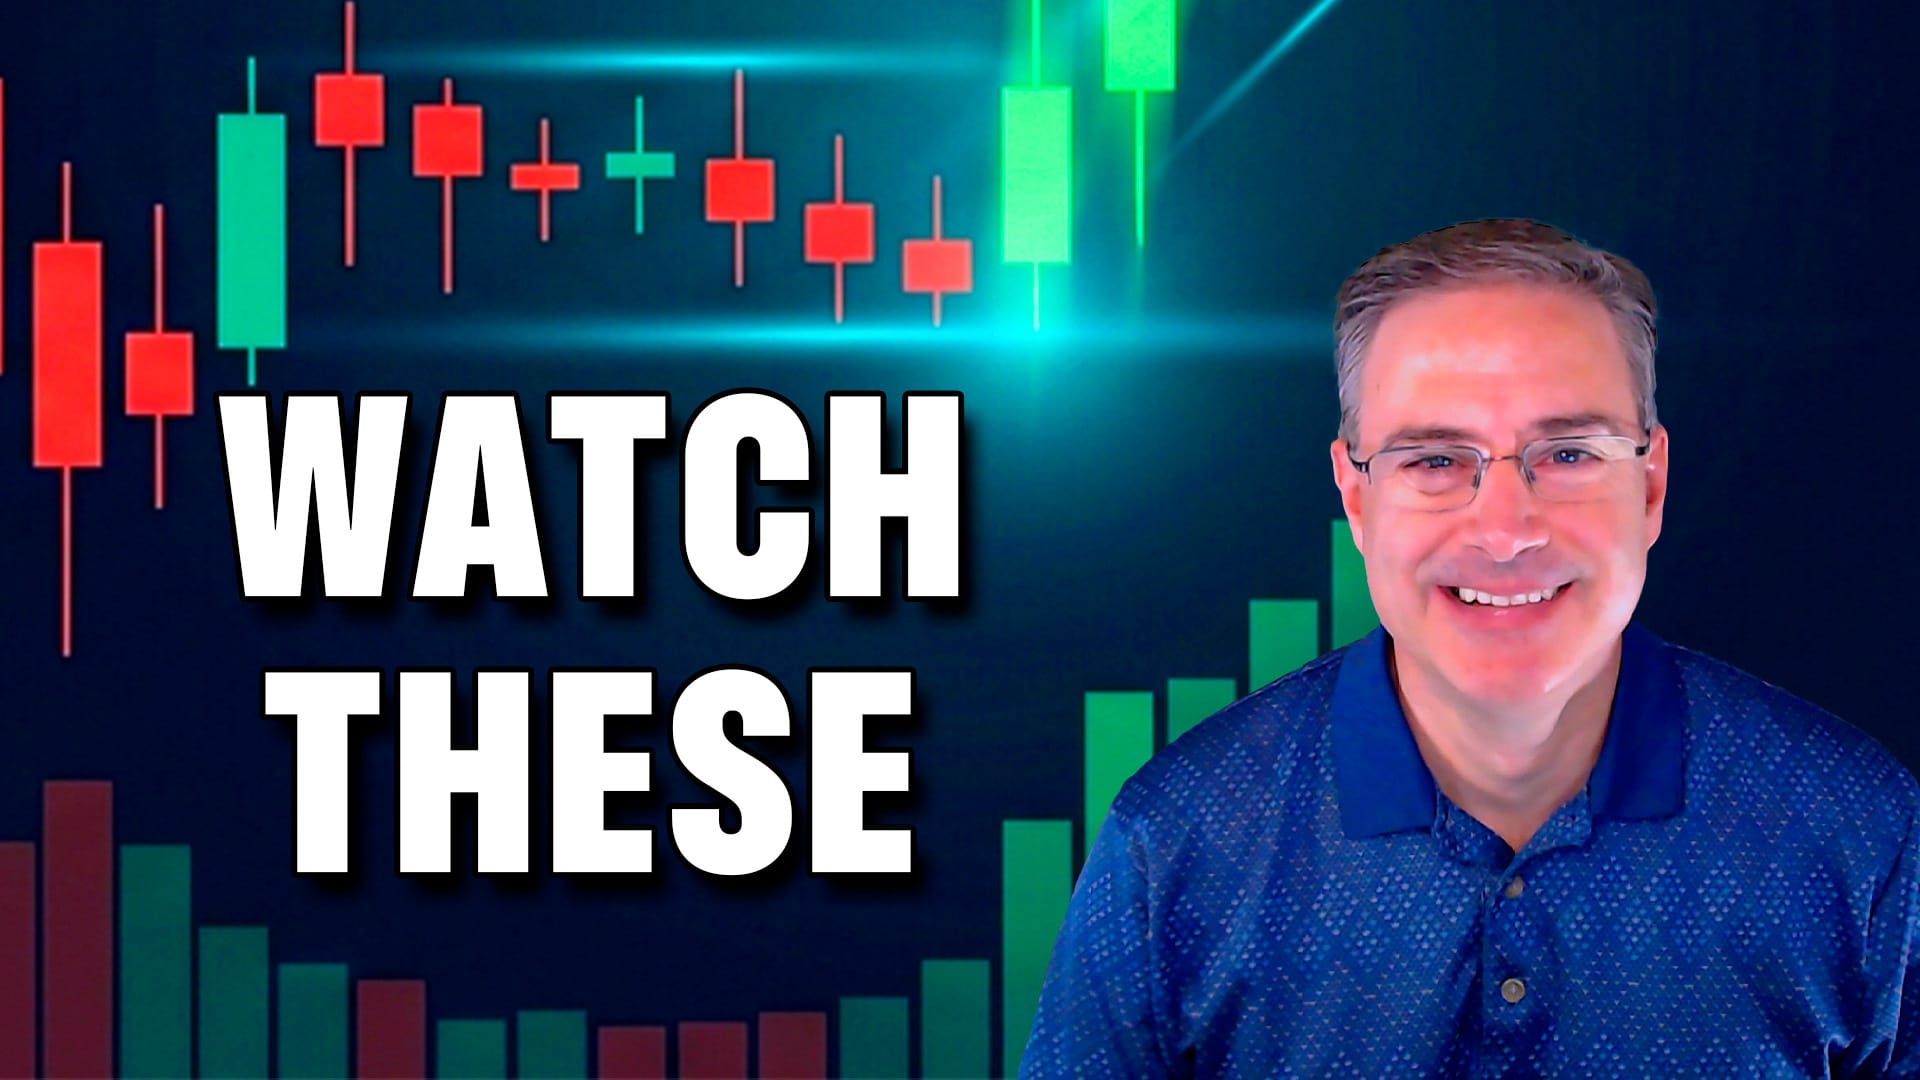
The Best Five Sectors This Week #66

by Julius de Kempenaer,
Senior Technical Analyst, StockCharts.com
Julius de Kempenaer, creator of Relative Rotation Graphs, presents his weekly update on US sector rotation using RRG....
READ MORE
MEMBERS ONLY

Stocks Shrugged Off Oil. Why They May Not Ignore Bonds
With Treasury yields rising, stocks getting wobbly, and commodities generally moving higher, now is a good time for investors to focus on intermarket analysis. These charts will help you get started....
READ MORE
MEMBERS ONLY

Week Ahead: Nifty Remains Under Pressure; Key Support Zone Put to Test
by Milan Vaishnav,
Founder and Technical Analyst, EquityResearch.asia and ChartWizard.ae
The Nifty is still under pressure, with the 23,200–23,000 area an important support level and 24,300–24,500 a key resistance level. Milan shows how traders should approach the market this upcoming week....
READ MORE
MEMBERS ONLY
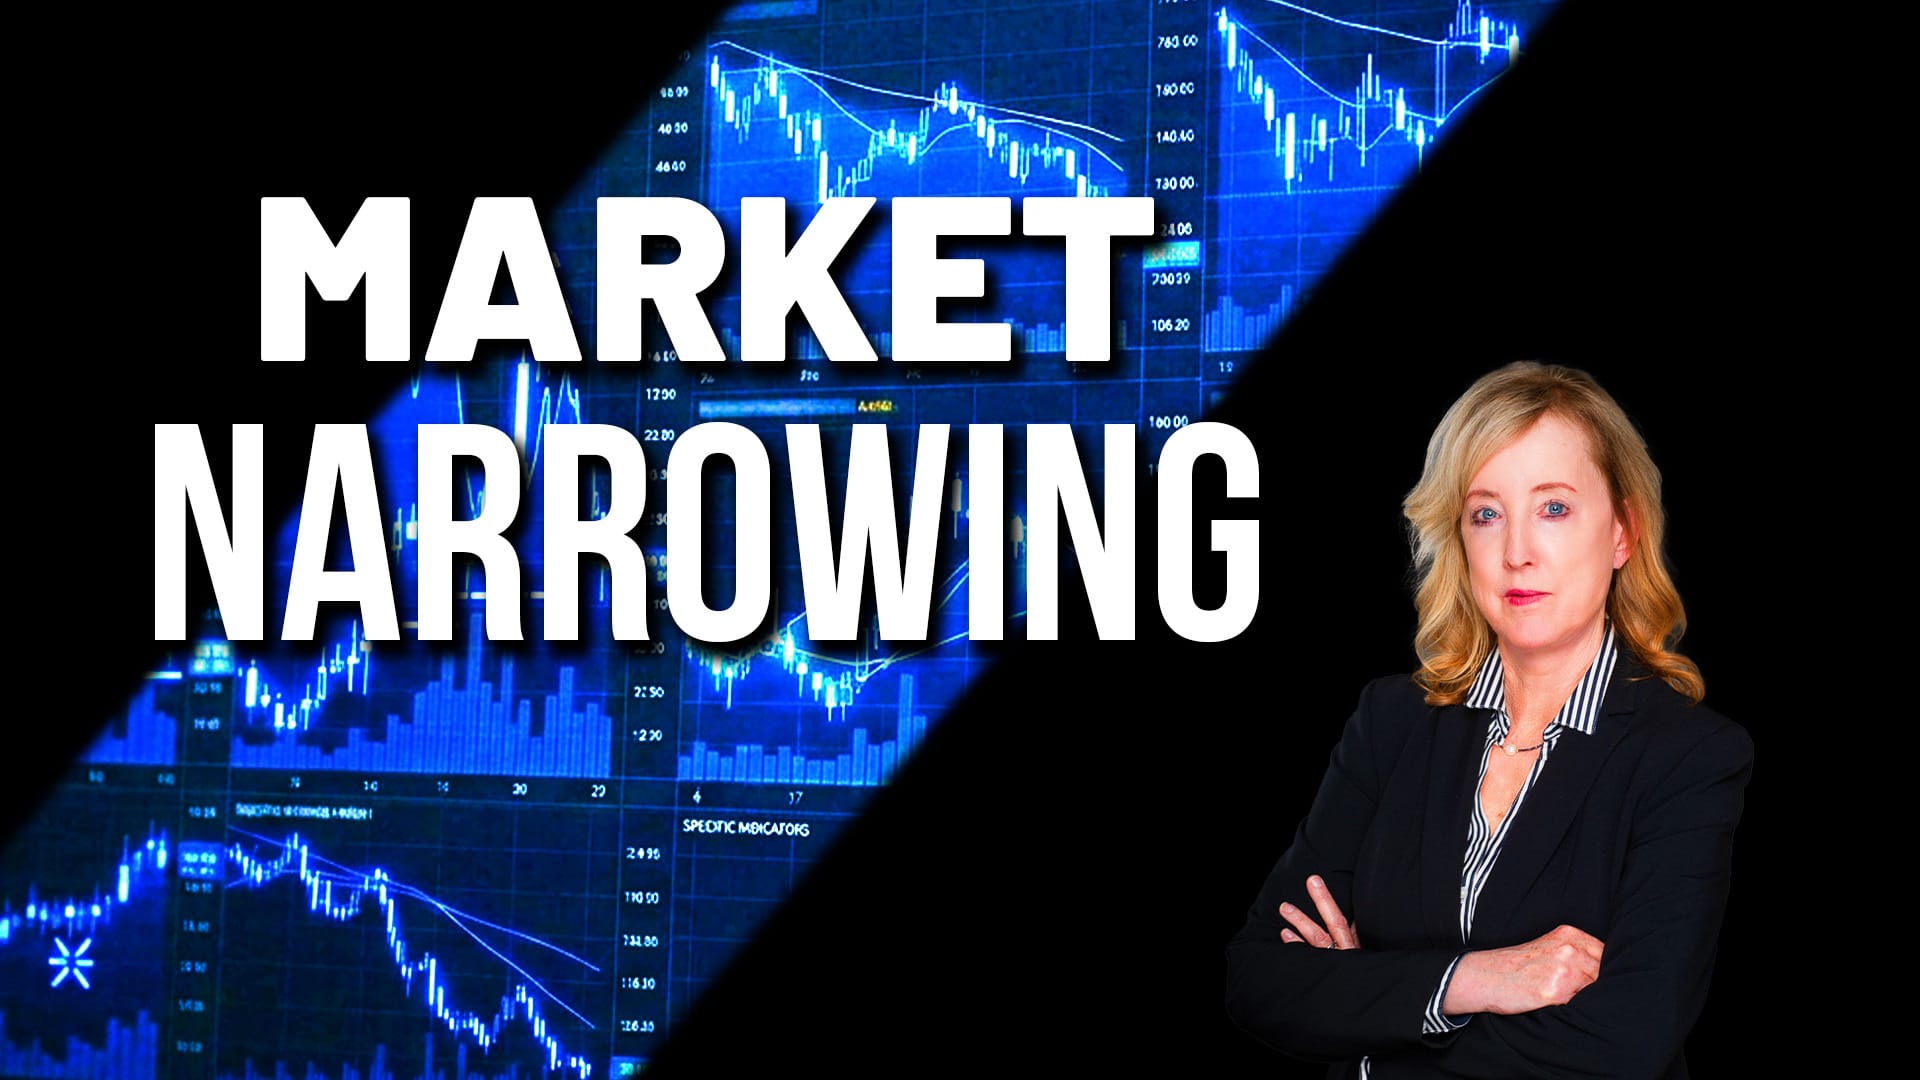
This Market Rally Is Starting to Narrow
by Mary Ellen McGonagle,
President, MEM Investment Research
Mary Ellen McGonagle shares why this market rally is becoming more selective as inflation and rising yields pressure parts of the market. See which areas are still leading and what may matter most going forward....
READ MORE
MEMBERS ONLY

There's One Common Ingredient In Every Successful Portfolio
by Tom Bowley,
Chief Market Strategist, EarningsBeats.com
Diversifying your portfolio is important and necessary. But it has to be done thoughtfully. Tom Bowley of EarningsBeats shows why it's important to regularly select leading stocks. ...
READ MORE
MEMBERS ONLY

AI Stocks Are Still in Charge. Here’s What Could Stop the Rally

by Jayanthi Gopalakrishnan,
Director of Site Content, StockCharts.com
AI stocks are driving the stock market higher, but rising yields, food prices, and weak market breadth could signal trouble beneath the surface of this bull rally....
READ MORE
MEMBERS ONLY

Retail Stocks Are Crashing Relative to the S&P 500. Here’s Why It Matters
Retail stocks are underperforming the S&P 500. Will this change when major retailers start reporting earnings next week? These charts will paint the full picture....
READ MORE
MEMBERS ONLY
Price Gap Analysis 101: Bullish vs. Bearish Gap Signals
by David Keller,
President and Chief Strategist, Sierra Alpha Research
Join David Keller as he explains how traders analyze price gaps....
READ MORE
MEMBERS ONLY

The Best Five Sectors This Week #65
by Julius de Kempenaer,
Senior Technical Analyst, StockCharts.com
Julius de Kempenaer, creator of Relative Rotation Graphs, presents his weekly update on sector rotation using RRGs....
READ MORE
MEMBERS ONLY

The CPI Threshold That Has Often Ended Equity Rallies

by Martin Pring,
President, Pring Research
With rising oil prices, a higher CPI is likely in the pipeline. If this is the case, how far can the CPI rise? Martin Pring studies the relationship between commodity prices and the CPI and discusses the likely outcome....
READ MORE
MEMBERS ONLY

Market Breadth Fears Are Everywhere, But Data Tells a More Nuanced Story
Is the S&P 500's 8.1% year-to-date gain entering the week on shaky footing? This analysis of the S&P 500's performance relative to other asset groups suggests that some sub-indexes and global equities are strengthening....
READ MORE
MEMBERS ONLY

What You Need to Know About Current Market Rotation
by Tom Bowley,
Chief Market Strategist, EarningsBeats.com
Which industry groups are likely to take the lead when semiconductors take a breather? Tom Bowley looks more closely at the software industry and shows why it has potential....
READ MORE
MEMBERS ONLY

New Leaders are Emerging in This Market Rally
by Mary Ellen McGonagle,
President, MEM Investment Research
Stock market rally leaders are shifting as semiconductor stocks, tech stocks, software stocks, and AI stocks continue to drive market gains. Mary Ellen McGonagle breaks down where leadership is emerging, what’s working now, and how earnings are shaping this market rally....
READ MORE
MEMBERS ONLY

Looking Beyond the AI Trade To Diversify Holdings
by Mary Ellen McGonagle,
President, MEM Investment Research
Investors are looking beyond AI and mega-cap tech as select retail and consumer stocks show strength. Here's where earnings momentum is broadening....
READ MORE
MEMBERS ONLY
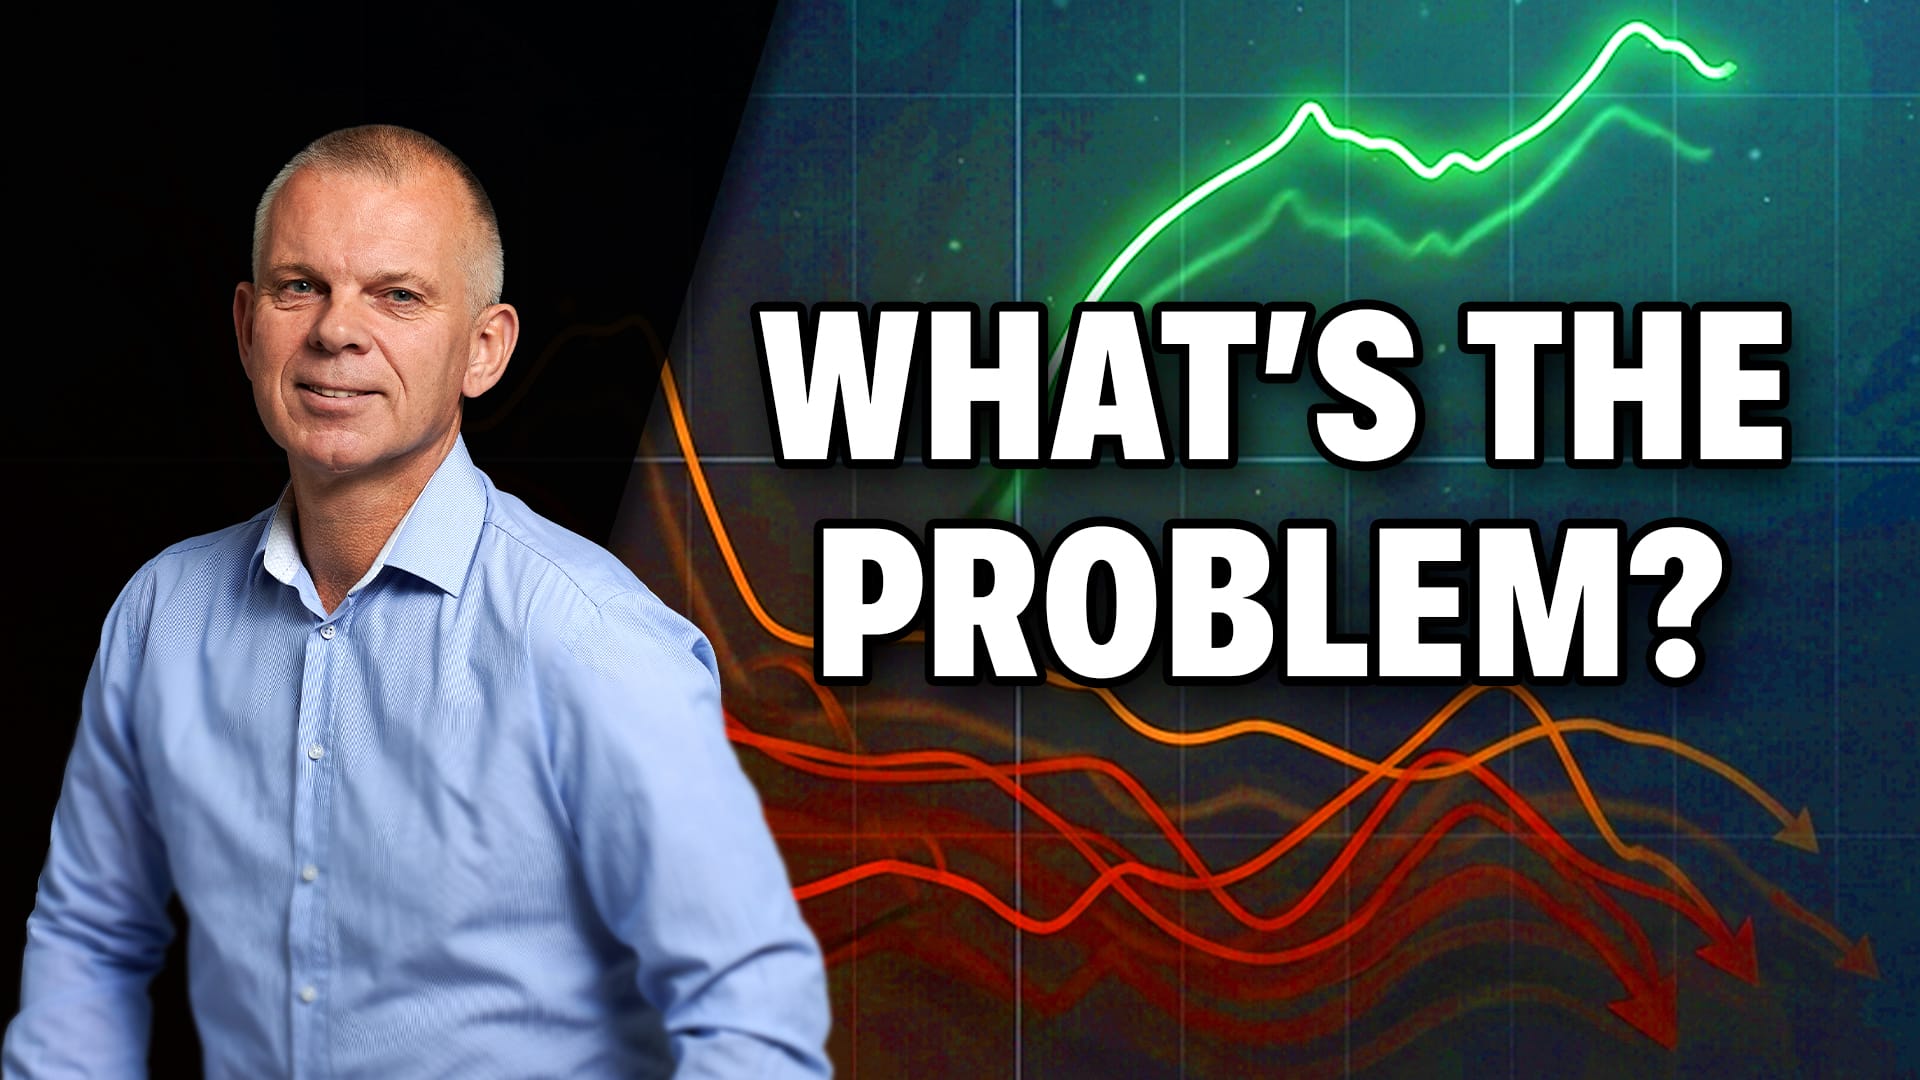
This Rally Has a Big Problem — And It’s Getting Worse
by Julius de Kempenaer,
Senior Technical Analyst, StockCharts.com
The stock market rally is becoming increasingly dependent on the technology sector. Follow along as Julius de Kempenaer uses Relative Rotation Graphs to break down weakening market breadth, sector rotation, and why this rally may be less healthy than it appears....
READ MORE
MEMBERS ONLY
High-Low Line Turns, RSP Forms Bullish Pattern, Cybersecurity and Cloud ETFs Reverse
by Arthur Hill,
Chief Technical Strategist, TrendInvestorPro.com
Stocks continue to surge with SPY, QQQ, and the Technology sector leading the market higher. Arthur Hill analyzes new highs in the S&P 500, bullish continuation pattern in RSP, and reversals in cybersecurity and cloud ETFs....
READ MORE
MEMBERS ONLY

The Stock Market Still Looks Bullish, But These Economic Charts Deserve Attention
by Jayanthi Gopalakrishnan,
Director of Site Content, StockCharts.com
Despite Thursday's selloff, stocks remain bullish. Consumer sentiment, oil prices, and Friday's jobs report will test the market's risk-on momentum....
READ MORE
MEMBERS ONLY

Here’s the Next Move After Semiconductors
by Tom Bowley,
Chief Market Strategist, EarningsBeats.com
With many semiconductor names extended, Tom Bowley breaks down where money is rotating next and the key areas showing fresh strength right now....
READ MORE
MEMBERS ONLY
New Relative Strength in These Stocks!

by Joe Rabil,
President, Rabil Stock Research
Joe Rabil explains how to identify stocks showing new relative strength as they shift from weak to strong. He highlights key setups and reviews market conditions, including sentiment, volatility, and trend....
READ MORE
MEMBERS ONLY

Market Rotation: Where’s the Money Moving Now?

by Frank Cappelleri,
Founder & President, CappThesis, LLC
Large-cap tech continues to drive the S&P 500 higher, but, beneath the surface, market leadership is narrowing. Frank Cappelleri breaks down where money may be rotating next and which sectors are starting to set up....
READ MORE
MEMBERS ONLY

The Next Leg Higher May Not Be in the U.S. Here’s Where to Look
European stocks are showing signs of improving technicals. A price gap, possible bull flag, rising 200-day moving average, and an RSI that's holding ground all point to potential bullish action....
READ MORE
MEMBERS ONLY

Nasdaq, S&P 500 Hit Record Highs as Chip Stocks Surge
by Jayanthi Gopalakrishnan,
Director of Site Content, StockCharts.com
The Nasdaq and S&P 500 posted record closes as chip stocks surged. See why broadening market strength and Bitcoin's rally point to bullish momentum....
READ MORE
MEMBERS ONLY

Top 10 Charts for May 2026 - New Highs and Strong Trends
by David Keller,
President and Chief Strategist, Sierra Alpha Research
Dave highlights 10 charts showing new highs and strong trends heading into May 2026, including leaders like CRWD, WDC, and JBL, along with early breakouts and sector strength to watch....
READ MORE
MEMBERS ONLY

Jobs Week Playbook: Reading the Market’s Inflation Signals
With inflationary pressures still in play, how should investors position their portfolios heading into mid-year? Keep an eye on this key market-based barometer and sector. ...
READ MORE
MEMBERS ONLY

Week Ahead: NIFTY Set for Positive Start, But These Levels Define a Broader Range
by Milan Vaishnav,
Founder and Technical Analyst, EquityResearch.asia and ChartWizard.ae
Milan Vaishnav examines the state of the Indian markets and what the next week holds, presenting his advice on how to approach the market and what the charts are saying....
READ MORE
MEMBERS ONLY

Gap Patterns in Focus: What GOOGL, AAPL, and the S&P 500 Are Telling Us
by David Keller,
President and Chief Strategist, Sierra Alpha Research
The S&P 500 and key stocks gapped to new highs, but follow-through will determine the trend. Dave Keller, CMT, explains “gap and run” versus “gap and fail” patterns, using recent moves in Oracle, Alphabet, and Apple to assess whether bullish momentum can continue....
READ MORE
MEMBERS ONLY

The AI Trade Is Confirmed—Are You Positioned to Take Advantage?
by Mary Ellen McGonagle,
President, MEM Investment Research
Five of the Mag 7 stocks reported earnings and sent the broader market higher. One stock among the five stood out. Mary Ellen analyzes the stock and shows why it has potential to move higher....
READ MORE
MEMBERS ONLY

How to Use PPO for Trend and Aroon for Post-Correction Breakouts
by Arthur Hill,
Chief Technical Strategist, TrendInvestorPro.com
Arthur Hill presents a simple strategy for identifying long-term uptrends and short-term breakouts after corrections, using two important indicators....
READ MORE
MEMBERS ONLY

Strong Momentum, Strong Trend: Reading RSI at New Highs
by David Keller,
President and Chief Strategist, Sierra Alpha Research
The S&P 500 is pushing to new highs with RSI near 70, signaling strong momentum. Dave Keller, CMT, explains why overbought conditions can confirm an uptrend, how divergences warn of weakness, and what signals would indicate the current bullish phase is ending....
READ MORE
MEMBERS ONLY
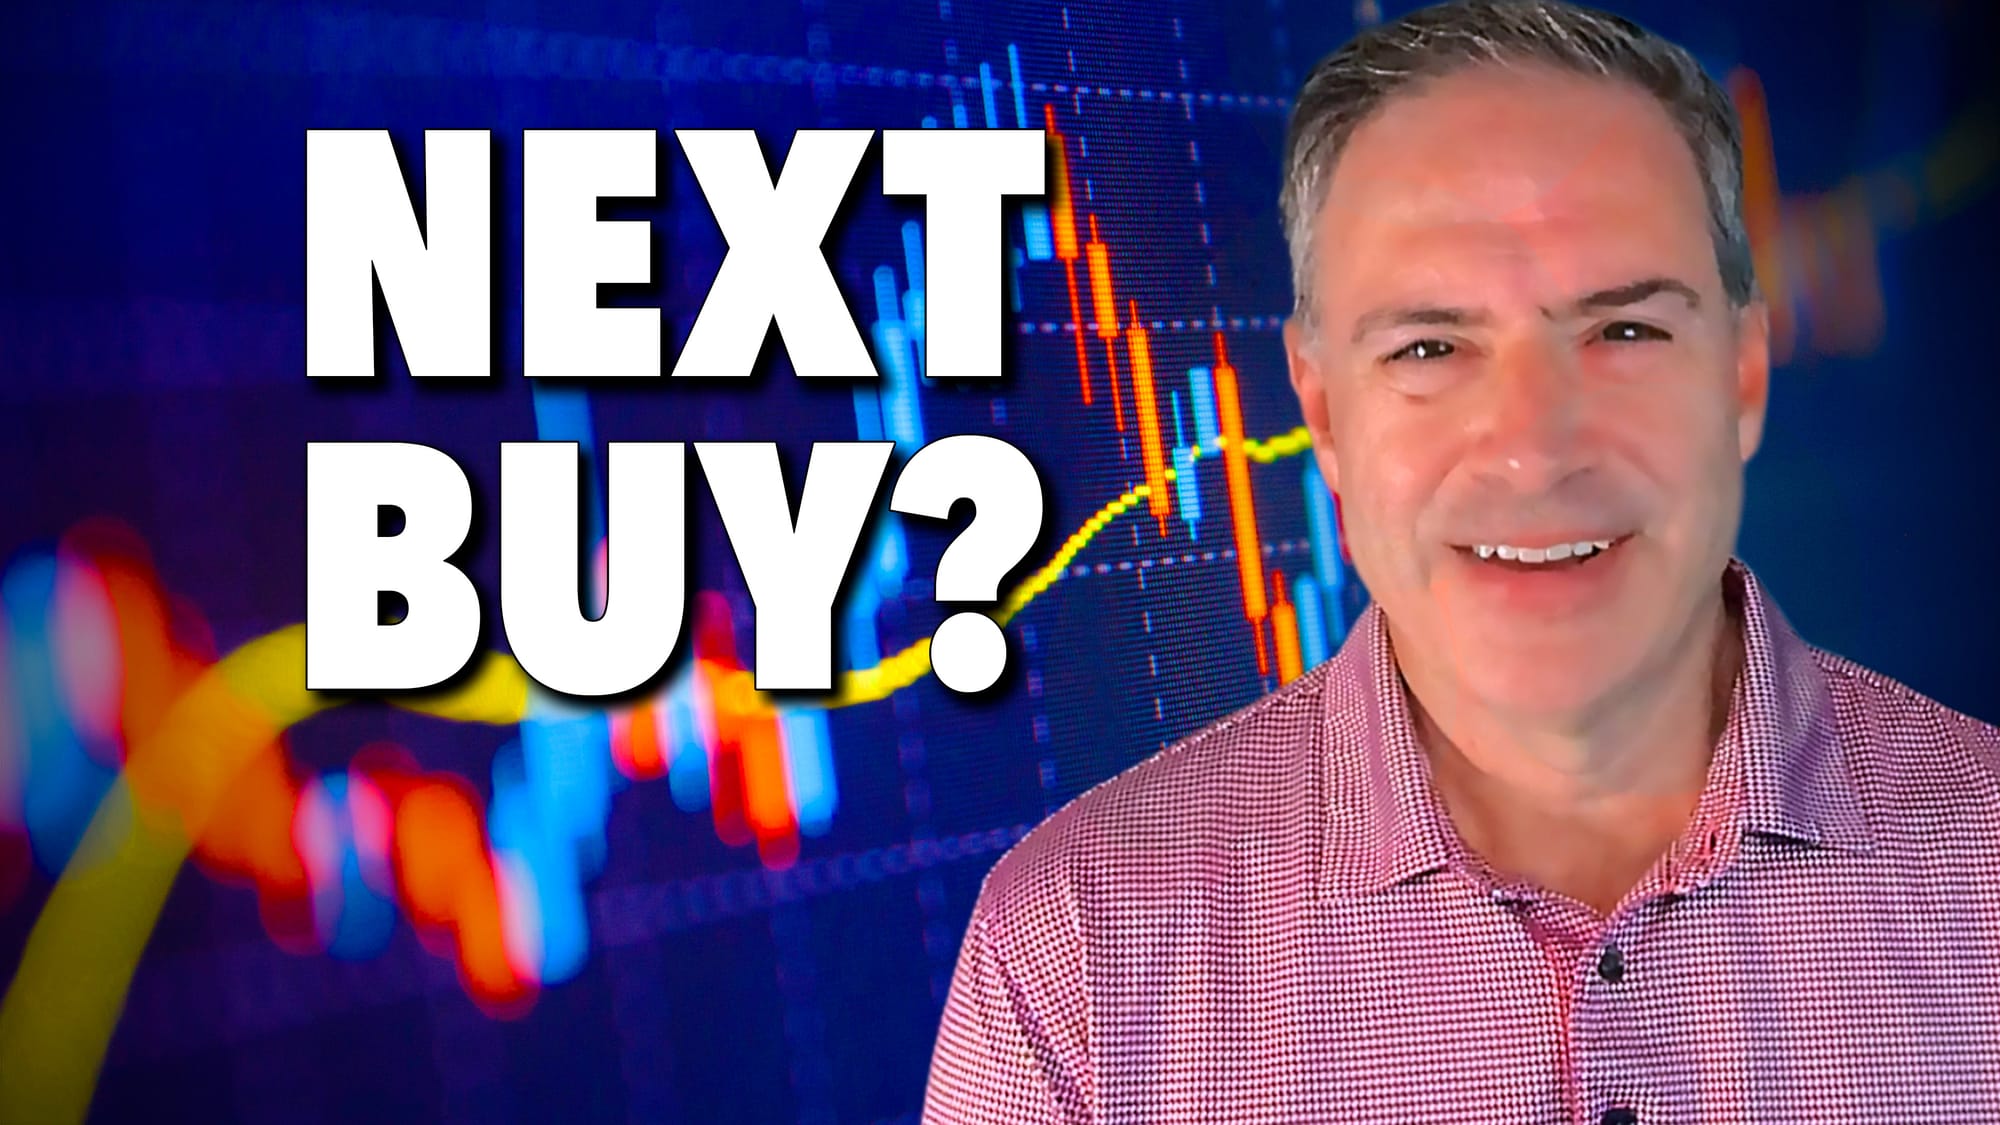
ADX and RSI Combo Show Next Buy for SPX
by Joe Rabil,
President, Rabil Stock Research
Joe Rabil explains how he measures the strength in SPX, digs into volatility, and examines some viewer-requested symbols....
READ MORE
MEMBERS ONLY

What RSI Is Telling Us Now About the S&P 500 Rally
by David Keller,
President and Chief Strategist, Sierra Alpha Research
Follow along as David Keller breaks down one of his favorite technical indicators, the RSI. Dave explains what overbought and oversold really mean and how to best understand what RSI readings mean....
READ MORE
MEMBERS ONLY

Semiconductors Explode Higher: Is This the Peak of the Chip Stock Supercycle?
Semiconductors are at extreme overbought levels. However, there may be macro risks lurking beneath the surface. Mike Zaccardi explains what to know before you chase this industry group....
READ MORE
MEMBERS ONLY

Choose Your Own Adventure: Mapping the S&P 500’s Next Move
by David Keller,
President and Chief Strategist, Sierra Alpha Research
After surging above 7000, the S&P 500 has stalled, leaving investors to question the next move. Dave Keller, CMT, outlines four bullish and bearish scenarios through mid-June, helping investors weigh risks, opportunities, and key market signals ahead....
READ MORE