MEMBERS ONLY

Mastering Stock Market Turbulence: Essential Insights for Investors

by Jayanthi Gopalakrishnan,
Director of Site Content, StockCharts.com
KEY TAKEAWAYS
* The stock market indexes bounced back with the largest one-day gains.
* Technology and Consumer Discretionary stocks were the best-performing S&P sectors.
* Bonds had the most interesting price in Wednesday's trading.
Tariff turmoil continues sending the stock market into a turbulent spin. Tariffs went into...
READ MORE
MEMBERS ONLY

Are the Tariffs Bullish or Bearish for the US Dollar?

by Martin Pring,
President, Pring Research
Tariffs have been front and center of market attention, but one asset class that has been relatively subdued in its response has been the US Dollar Index. It has declined in recent weeks, but a review of the technical picture suggests that the sell-off is part of an overall corrective...
READ MORE
MEMBERS ONLY
Key Levels for the S&P 500: Has It Bottomed?

by Joe Rabil,
President, Rabil Stock Research
Is the stock market on the verge of crashing or has it bottomed?
In this video, Joe Rabil uses moving averages and Fibonacci retracement levels on a longer-term chart of the S&P 500 to identify support levels that could serve as potential bottoms for the current market correction....
READ MORE
MEMBERS ONLY

DP Trading Room: Key Support Levels for the SPY

by Erin Swenlin,
Vice President, DecisionPoint.com
The market is in a tailspin as tariffs add volatility to the market. Carl and Erin believe the SPY is in a bear market given key indexes like the Nasdaq are already in bear markets. It's time to consider where the key support levels are.
Carl addressed his...
READ MORE
MEMBERS ONLY

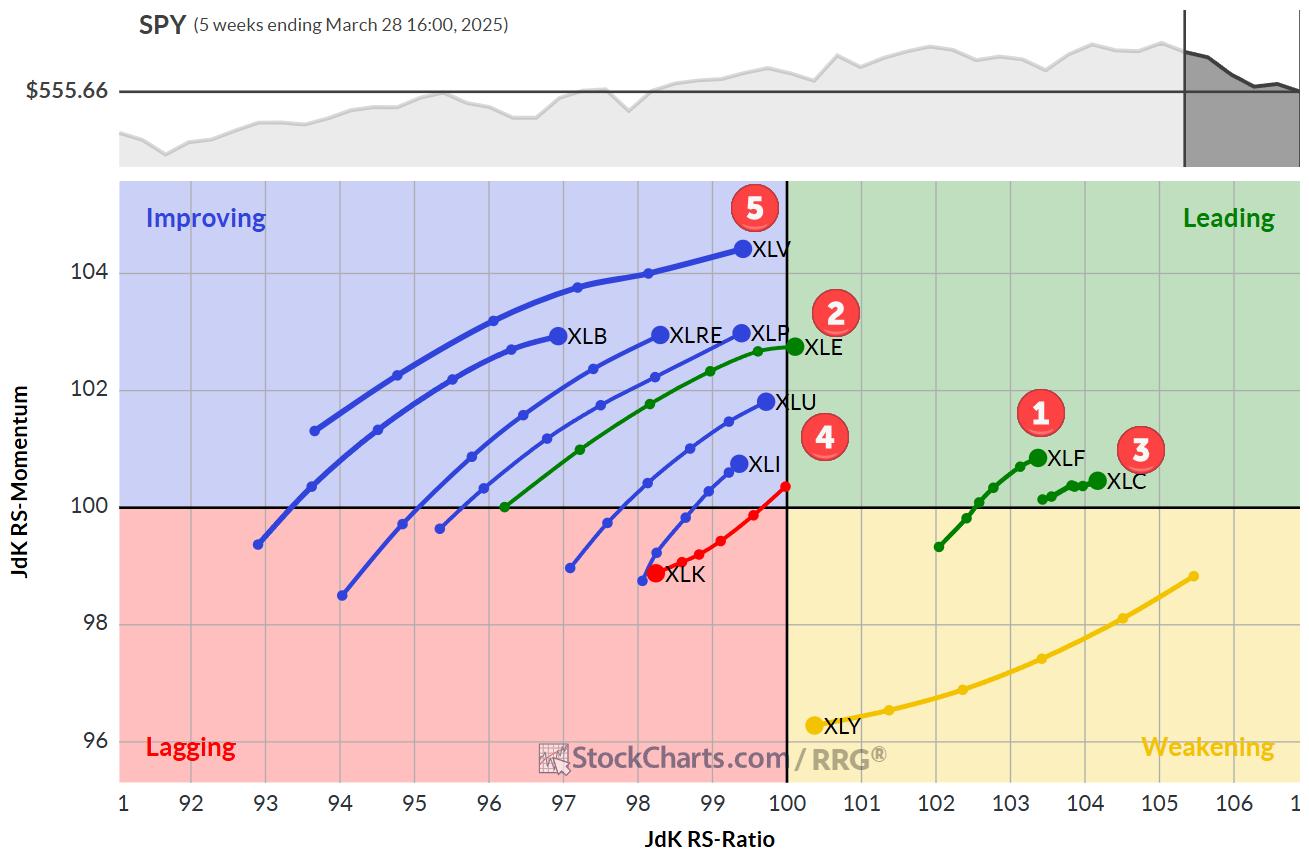
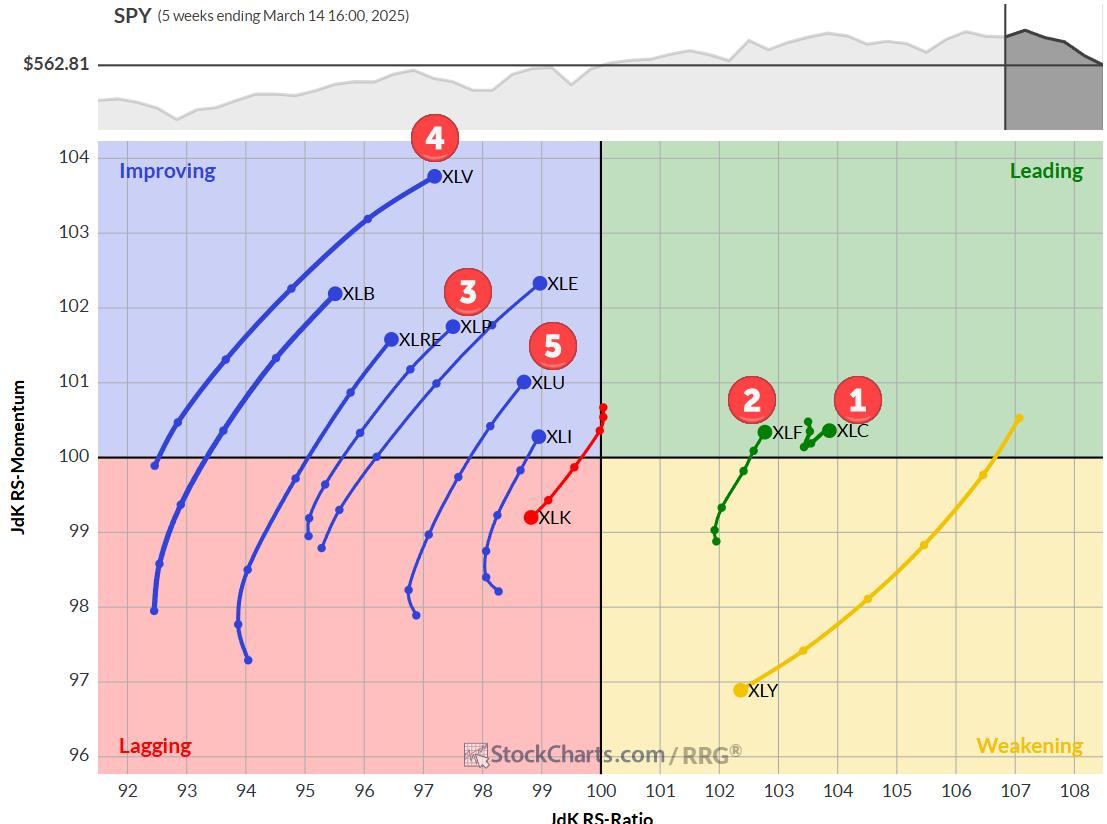
The Best Five Sectors, #14

by Julius de Kempenaer,
Senior Technical Analyst, StockCharts.com
KEY TAKEAWAYS
* Consumer Staples replaces Healthcare in top 5
* More defensive rotation underway
* RRG portfolio remains in line with market performance
This article was first posted on 4/4/2025 and contained only rankings and charts. Then updated with comments 4/7/2025
I am attending and speaking at the...
READ MORE
MEMBERS ONLY

Market Drop Compared to 2020: What You Need to Know Now

by Mary Ellen McGonagle,
President, MEM Investment Research
How low can the S&P and the Nasdaq fall? More importantly, how can an investor navigate this volatile environment?
In this eye-opening video, Mary Ellen McGonagle delves into the stock market's fall, identifies key support levels, and compares them to past bear markets. She also discusses...
READ MORE
MEMBERS ONLY
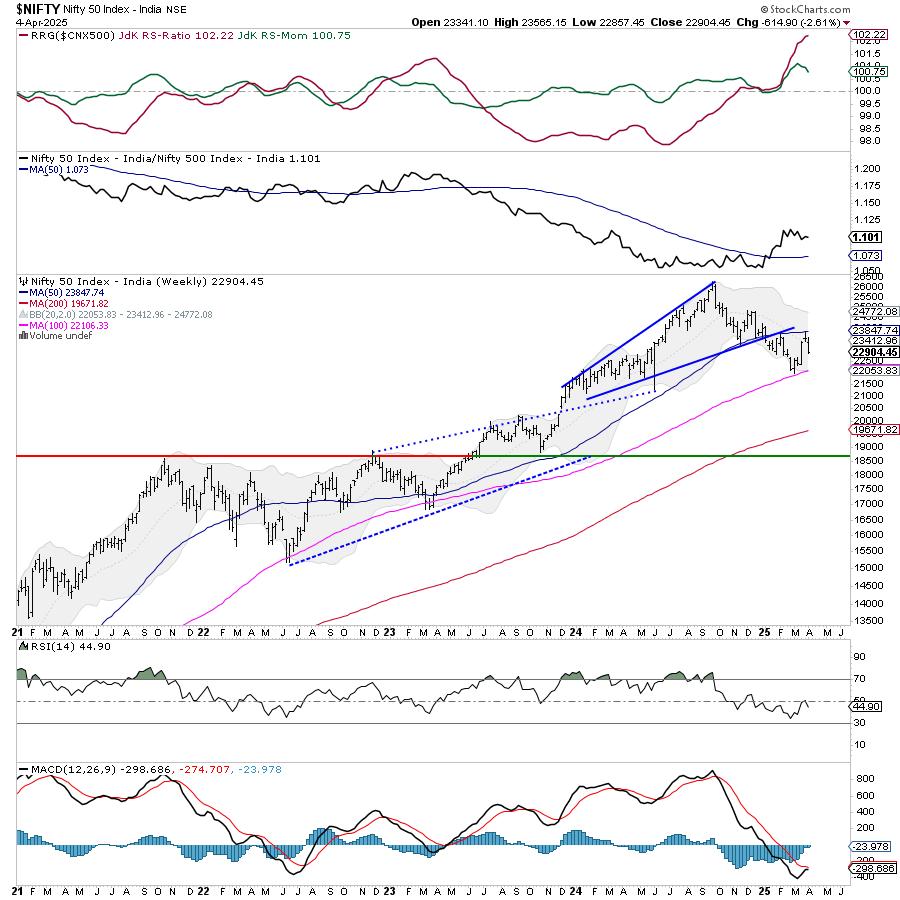
Week Ahead: NIFTY Set To Open Lower; Relative Outperformance Against Peers Expected To Continue

by Milan Vaishnav,
Founder and Technical Analyst, EquityResearch.asia and ChartWizard.ae
The previous week was short; the Indian markets traded for four days owing to one trading holiday on account of Ramadan Id. However, while staying largely bearish, the markets weathered the storm inflicted by the US announcing reciprocal tariffs on almost everyone and kicking off a serious trade war. The...
READ MORE
MEMBERS ONLY

Demystifying Tariff Impact: Essential Insights for Every Investor
by Jayanthi Gopalakrishnan,
Director of Site Content, StockCharts.com
KEY TAKEAWAYS
* The broader stock market indexes are all trading below their 100-week moving averages.
* The Bullish Percent Index (BPI) indicates sellers are dominant.
* The AAII Sentiment Survey reveals extreme bearishness among investors.
The stock market hoped for curtailment of tariffs on Wednesday, but that didn't happen. Even...
READ MORE
MEMBERS ONLY
Trend-Following Stocks: How a Low ADX Can Signal Huge Breakouts!
by Joe Rabil,
President, Rabil Stock Research
In this exclusive StockCharts video, Joe Rabil shows you how to use the ADX on monthly and weekly charts to find stocks with massive breakout potential. Joe walks you through several examples of stocks and ETFs that broke out of an extended period of trading sideways. He also discusses the...
READ MORE
MEMBERS ONLY

Sentiment Is Near-Perfect for a Rally: One Thing Could Stand In the Way
by Martin Pring,
President, Pring Research
KEY TAKEAWAYS
* Several sentiment indicators have reached levels that usually fuel a worthwhile rally or jump-started a new bull market.
* Sentiment indicators could be at levels that are ripe for a rally but keep an eye on them.
* The absence of a rally could increase the odds of a bull...
READ MORE
MEMBERS ONLY

DP Trading Room: Magnificent Seven Stocks in Bear Markets
by Erin Swenlin,
Vice President, DecisionPoint.com
You may not know it, but all of the Magnificent Seven stocks are in bear markets. Given they are such an integral part of the major indexes, we have to believe that the market will follow suit and continue lower in its own bear market. The SP500 is in correction...
READ MORE
MEMBERS ONLY

Volatility Ahead: What Investors Need to Know Right Now
by Jayanthi Gopalakrishnan,
Director of Site Content, StockCharts.com
KEY TAKEAWAYS
* The broader stock market indexes are showing weakness as more tariff news looms.
* The automobile sector continues to get hammered.
* Bond and precious metals prices are rising, indicating risk-off investor sentiment.
It was an ugly close to another roller-coaster trading week as the stock market struggled with several...
READ MORE
MEMBERS ONLY
The Best Five Sectors, #13
by Julius de Kempenaer,
Senior Technical Analyst, StockCharts.com
KEY TAKEAWAYS
* Financials jump to #1 spot in S&P 500 sector rankings.
* Three sectors now in leading quadrant on weekly RRG
* Only Tech and Consumer Discretionary showing negative RRG headings
* RRG portfolio outperforming S&P 500 YTD by 10 basis points
Financials take the lead.
No changes...
READ MORE
MEMBERS ONLY
These High-Yield Stocks are Still Winning Despite Market Chaos!
by Mary Ellen McGonagle,
President, MEM Investment Research
Is a new market uptrend on the horizon? In this video, Mary Ellen breaks down the latest stock market outlook, revealing key signals that could confirm a trend reversal. She dives into sector rotation, explains why defensive stocks are losing ground, and shares actionable short-term trading strategies for oversold stocks....
READ MORE
MEMBERS ONLY

S&P & Tech Stocks: Will Seasonality Lead to More Pain?
by Julius de Kempenaer,
Senior Technical Analyst, StockCharts.com
Sector rotation is shaping the S&P 500's next big move! In this exclusive StockCharts video,Julius analyzes SPY support levels, key sector trends, and the latest seasonal patterns—which indicate further downside for Technology stocks. He breaks down two critical support areas that could signal the...
READ MORE
MEMBERS ONLY

Silver Cross Index Tops Beneath Signal Line on SPY
by Erin Swenlin,
Vice President, DecisionPoint.com
One of the indicators that Carl Swenlin developed is the Silver Cross Index. It is one of the best participation indicators out there! Here's how it works:
We consider a positive 20/50-day EMA crossover a "Silver Cross". If a stock has a Silver Cross it...
READ MORE
MEMBERS ONLY

Bear Flag Alert - Downside S&P 500 Target Update

by David Keller,
President and Chief Strategist, Sierra Alpha Research
KEY TAKEAWAYS
* A confirmed bear flag pattern would imply a minimum downside objective around $SPX 5200.
Friday's overheated inflation data appears to have initiated a new downward leg for the major equity averages. This could mean a confirmed bear flag pattern for the S&P 500, and...
READ MORE
MEMBERS ONLY

Unveiling Market Trends: What's Triggering a Midweek Bearish Shift?
by Jayanthi Gopalakrishnan,
Director of Site Content, StockCharts.com
KEY TAKEAWAYS
* Tariff concerns were elevated once again on Wednesday after President Trump said he would be making a statement later in the day.
* Technology stocks and automobile stocks were hit hard in Wednesday's trading.
* President Trump's tariff announcement after Wednesday's market close could...
READ MORE
MEMBERS ONLY

Is It Time to Buy Tesla?
by Martin Pring,
President, Pring Research
Recently, there have been horror stories about individual Tesla owners being harassed and dealers being vandalized, all because people have decided they don't like Elon Musk or his recent DOGE actions. In Europe, sales are reported down 49% in the first two months of the year, and, to...
READ MORE
MEMBERS ONLY

Master Multi-Timeframe Analysis to Find Winning Trades!
by Joe Rabil,
President, Rabil Stock Research
In this exclusive StockCharts video, Joe shares how to use multi-timeframe analysis — Monthly, Weekly, and Daily charts — to find the best stock market opportunities. See how Joe uses StockCharts tools to create confluence across timeframes and spot key levels. Joe then identifies strength in commodities, QQQ, and finishes up by...
READ MORE
MEMBERS ONLY

Stock Market Momentum Slows Down: What This Means for Investors
by Jayanthi Gopalakrishnan,
Director of Site Content, StockCharts.com
KEY TAKEAWAYS
* Tuesday's stock market action was lackluster with not much movement in either direction.
* Lack of followthrough from the previous trading day's upside action shows uncertainty is still in the air.
* Keep an eye on the health of the overall U.S. economy by monitoring...
READ MORE
MEMBERS ONLY
DP Trading Room: Tariffs Narrowing, Sparks Market Rally
by Erin Swenlin,
Vice President, DecisionPoint.com
Over the weekend it was announced that tariffs will be narrowing and possibly not as widespread as initially thought. Negotiations are continuing in the background and this seems to be allaying market participants' fears. The market rallied strongly on the news.
Carl and Erin gave you their opinions of...
READ MORE
MEMBERS ONLY
The Best Five Sectors, #12
by Julius de Kempenaer,
Senior Technical Analyst, StockCharts.com
KEY TAKEAWAYS
* Energy sector jumps to position #2 in top 5
* Consumer Staples drops out of portfolio
* Communication Services remains at #1 spot
* Modest pick up of relative momentum for XLK and XLY not enough yet
Energy Jumps to #2
A big move for the energy sector last week as...
READ MORE
MEMBERS ONLY

Uncover the Week's Key Stock Market Movements
by Jayanthi Gopalakrishnan,
Director of Site Content, StockCharts.com
KEY TAKEAWAYS
* Price action was sideways this week, with a lot of up and down movement.
* FedEx's weak guidance sent the stock price sliding 6.45%.
* Precious metals rally with gold prices hitting an all time high this week.
If one word could characterize this week's...
READ MORE
MEMBERS ONLY

American Association of Individual Investors (AAII) Breaks Record
by Erin Swenlin,
Vice President, DecisionPoint.com
We wrote about the American Association of Individual Investors (AAII) poll results a few weeks ago. Since then, the bearish activity on the chart has broken a record for the poll. Going back to the poll's inception in 1987, we have never seen four weeks in a row...
READ MORE
MEMBERS ONLY
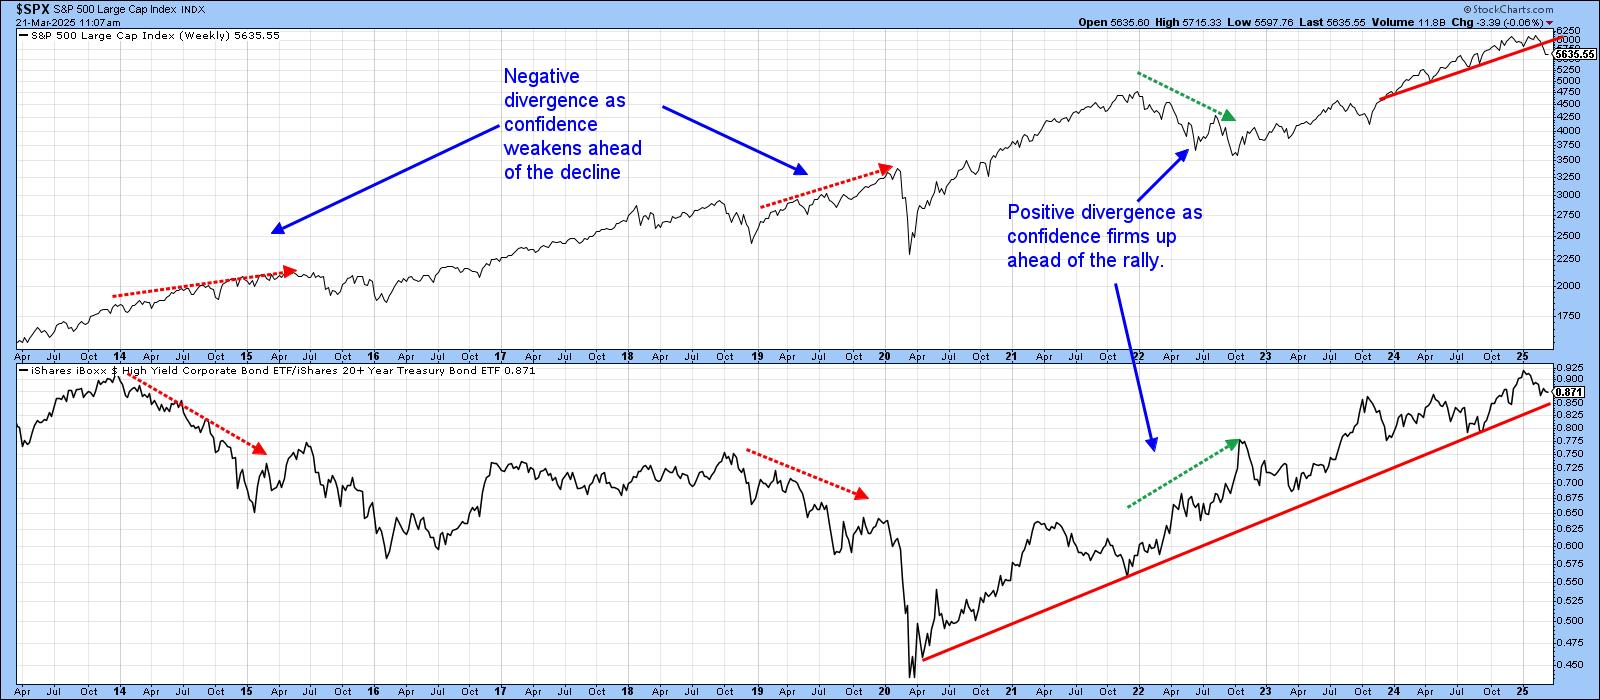
Confidence Ratios are in an Uptrend, But Looking Vulnerable
by Martin Pring,
President, Pring Research
At this week's news conference, Jerome Powell mentioned that the Fed is cautious about making significant changes to interest rates due to unclear economic conditions, citing factors like trade policies and inflation, which have contributed to this uncertainty. If the "experts" don't know, it&...
READ MORE
MEMBERS ONLY

Two Ways to Use the Zweig Breadth Thrust - Plus an Added Twist

by Arthur Hill,
Chief Technical Strategist, TrendInvestorPro.com
KEY TAKEAWAYS
* The Zweig Breadth Thrust is best known for its bullish reversal signals.
* Traders can also use the "setup" period to identify oversold conditions.
* Nasdaq stocks were left out of the original, but there is solution.
The Zweig Breadth Thrust is best known for its bullish reversal...
READ MORE
MEMBERS ONLY

Will QQQ Retest All-Time Highs By End of April?
by David Keller,
President and Chief Strategist, Sierra Alpha Research
After reaching an all-time around $540 in mid-February, the Nasdaq 100 ETF (QQQ) dropped almost 14% to make a new swing low around $467. With the S&P 500 and Nasdaq bouncing nicely this week, investors are struggling to differentiate between a bearish dead-cat bounce and a bullish full...
READ MORE
MEMBERS ONLY

New SPX Correction Signal! How Long Will It Last?
by Joe Rabil,
President, Rabil Stock Research
In this exclusive StockCharts video, Joe breaks down a new SPX correction signal using the monthly Directional Lines (DI), showing why this pullback could take time to play out. He explains how DI lines influence the ADX slope and how this impacts shorter-term patterns. Joe also reveals a strong area...
READ MORE
MEMBERS ONLY

Stock Market Shifts Gears: Indexes Plunge After Climb
by Jayanthi Gopalakrishnan,
Director of Site Content, StockCharts.com
KEY TAKEAWAYS
* The broader stock market indexes break their two day winning streak.
* Gold prices hit a new all-time high.
* European stocks are in a solid uptrend.
Tuesday's stock market action marked a reversal in investor sentiment, with the broader indexes closing lower. The S&P 500...
READ MORE
MEMBERS ONLY

Riding the Wave: What the Stock Market Rebound Means for Your Investments
by Jayanthi Gopalakrishnan,
Director of Site Content, StockCharts.com
KEY TAKEAWAYS
* The stock market indexes rebounded with Real Estate, Energy, and Consumer Staples leading.
* Retail sales data for February were slightly below expectations but better than January's data.
* Investors are looking forward to Wednesday's FOMC meeting to hear what the committees thoughts are on economic...
READ MORE
MEMBERS ONLY
4 Scenarios for Nasdaq 100: Bullish Surge or Bearish Collapse?
by David Keller,
President and Chief Strategist, Sierra Alpha Research
Can the Nasdaq 100 rally to all-time highs or break down below key support? In this video, Dave uses probabilistic analysis to explore 4 possible scenarios for the QQQ over the next 6 weeks — from a super bullish surge to a bearish breakdown below the August 2024 low. Discover the...
READ MORE
MEMBERS ONLY

DP Trading Room: Upside Initiation Climax?
by Erin Swenlin,
Vice President, DecisionPoint.com
On Friday DP indicators logged an Upside Initiation Climax. This exhaustion events often mark the beginning of new rallies and could indicate that the market is indeed ready to rebound. However, we do question its veracity given lukewarm trading to begin Monday's trading.
Carl started us off by...
READ MORE
MEMBERS ONLY
The Best Five Sectors, #11
by Julius de Kempenaer,
Senior Technical Analyst, StockCharts.com
KEY TAKEAWAYS
* At the moment, we're seeing a big shakeup in sector rankings.
* Healthcare has entered the top five.
* Technology is dropping to last position.
* All defensive sectors are now in the top five.
Big Moves in Sector Ranking
The ranking of US sectors continues to shift. At...
READ MORE
MEMBERS ONLY

Why the Market is Ready to Rally!

by Larry Williams,
Veteran Investor and Author
In this exclusive video, legendary trader Larry Williams breaks down why the stock market is primed for a rally, using technical analysis, fundamental signals, and seasonal trends. He explains how tariffs, crude oil, and cyclical patterns could fuel the next big market surge, plus stocks to watch during this potential...
READ MORE
MEMBERS ONLY

Three Reasons to Consider Gold
by David Keller,
President and Chief Strategist, Sierra Alpha Research
KEY TAKEAWAYS
* Gold has dramatically outperformed the S&P 500 and Nasdaq in 2025.
* Gold prices remain in a primary uptrend, with our Market Trend Model reading bullish on all time frames.
* Gold stocks are outperforming physical gold, and could represent a "catch up" trade going into...
READ MORE
MEMBERS ONLY
Is a New Market Uptrend Starting? Key Signals & Trading Strategies
by Mary Ellen McGonagle,
President, MEM Investment Research
Is a new market uptrend on the horizon? In this video, Mary Ellen breaks down the latest stock market outlook, revealing key signals that could confirm a trend reversal. She dives into sector rotation, explains why defensive stocks are losing ground, and shares actionable short-term trading strategies for oversold stocks....
READ MORE
MEMBERS ONLY
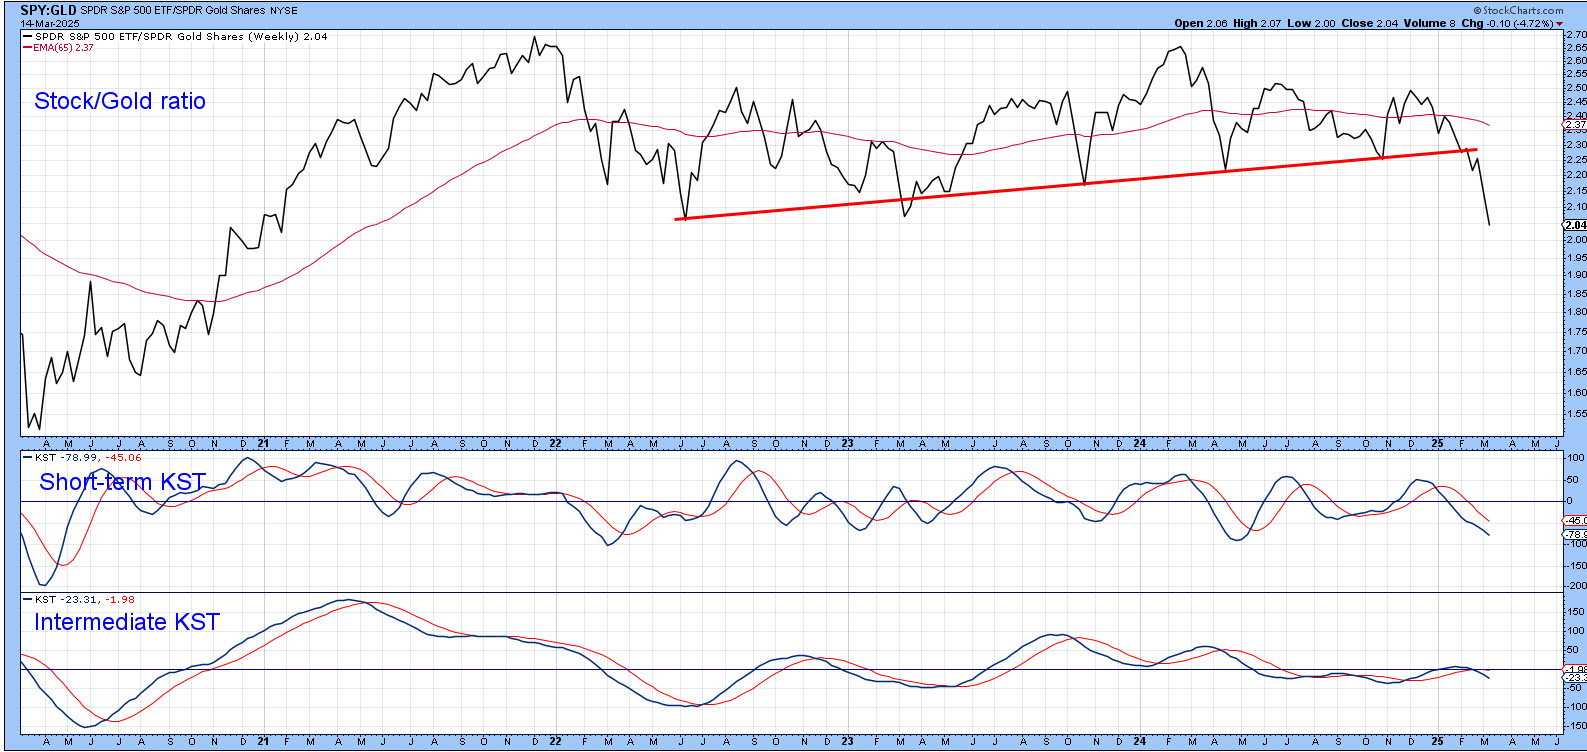
Stocks May No Longer Be the Preferred Asset Class
by Martin Pring,
President, Pring Research
A couple of weeks ago, I wrote that stocks were beginning to slip against the gold price. Chart 1 shows that the ratio has now decisively broken below an important uptrend line, marking the lower region of a three-year top. The short-term KST is currently oversold, so some kind of...
READ MORE
MEMBERS ONLY

SPY Reverses Long-term Uptrend with Outsized Move - Now What?
by Arthur Hill,
Chief Technical Strategist, TrendInvestorPro.com
KEY TAKEAWAYS
* SPY reverses uptrend with sharpest decline in over two years.
* Large-caps underperform the average S&P 500 stock.
* Broken support and 40-week SMA turn resistance.
The weight of the evidence shifted to the bears over the last few weeks. First, the major index ETFs reversed their long-term...
READ MORE
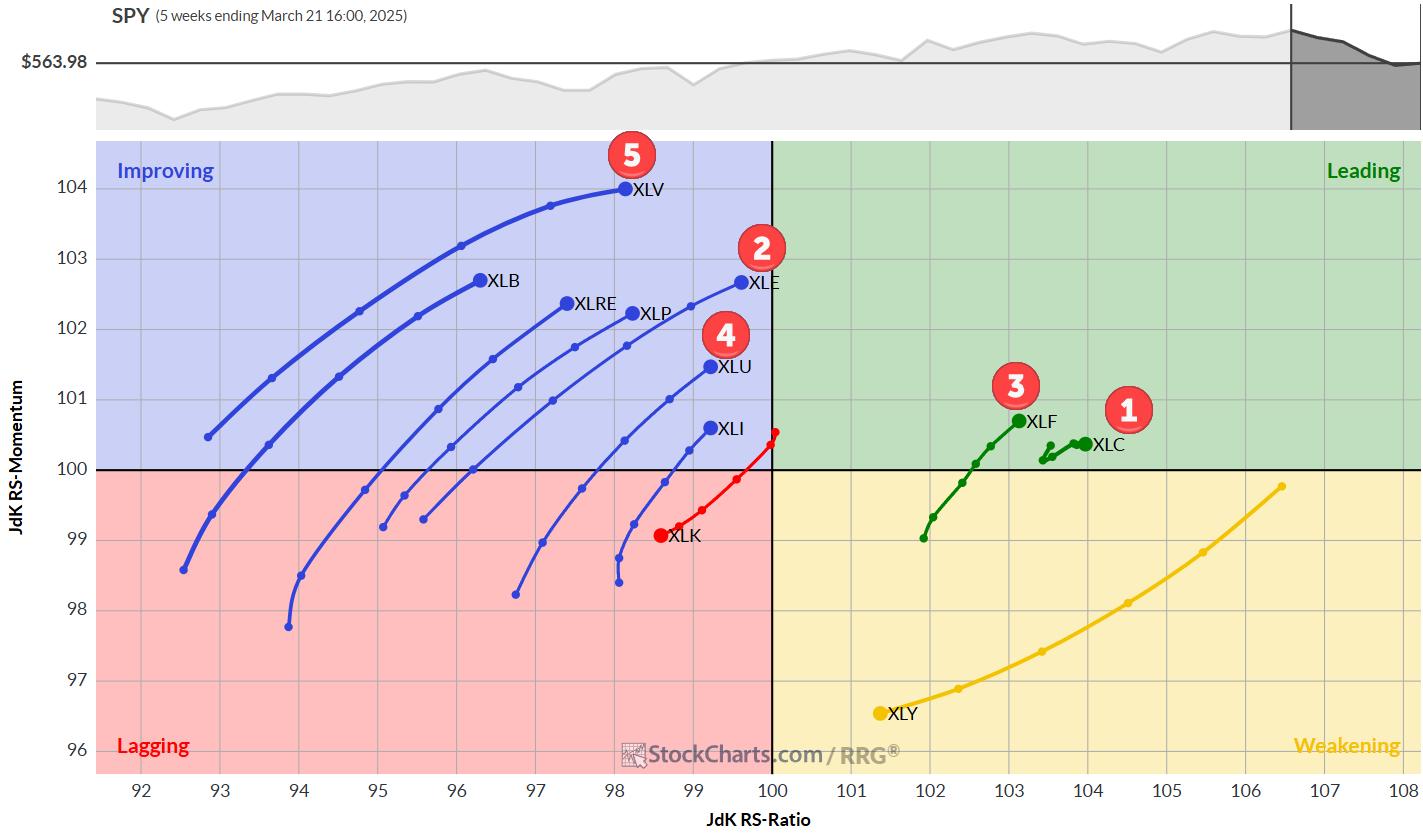
MEMBERS ONLY

Sector Rotation Breakdown: Spotting Market Leaders Now
by Julius de Kempenaer,
Senior Technical Analyst, StockCharts.com
In this exclusive StockCharts video,Julius analyzes US sector rotation using Relative Rotation Graphs (RRG), starting with the 11 S&P sectors and breaking them into Offensive, Defensive, and Sensitive sectors to uncover unusual market rotations. He then dives into the Financials sector, identifying top stocks with potential for...
READ MORE