MEMBERS ONLY

Is This Still a Bull Market? | Larry's "Family Gathering" October 18, 2024 Recording

by Larry Williams,
Veteran Investor and Author
Are we still in a bull market? That's a key question Larry considers in his final "Family Gathering" video, examining all the information available and what kind of conclusions about the state of the market we can draw from it.
Larry begins with a careful market...
READ MORE
MEMBERS ONLY
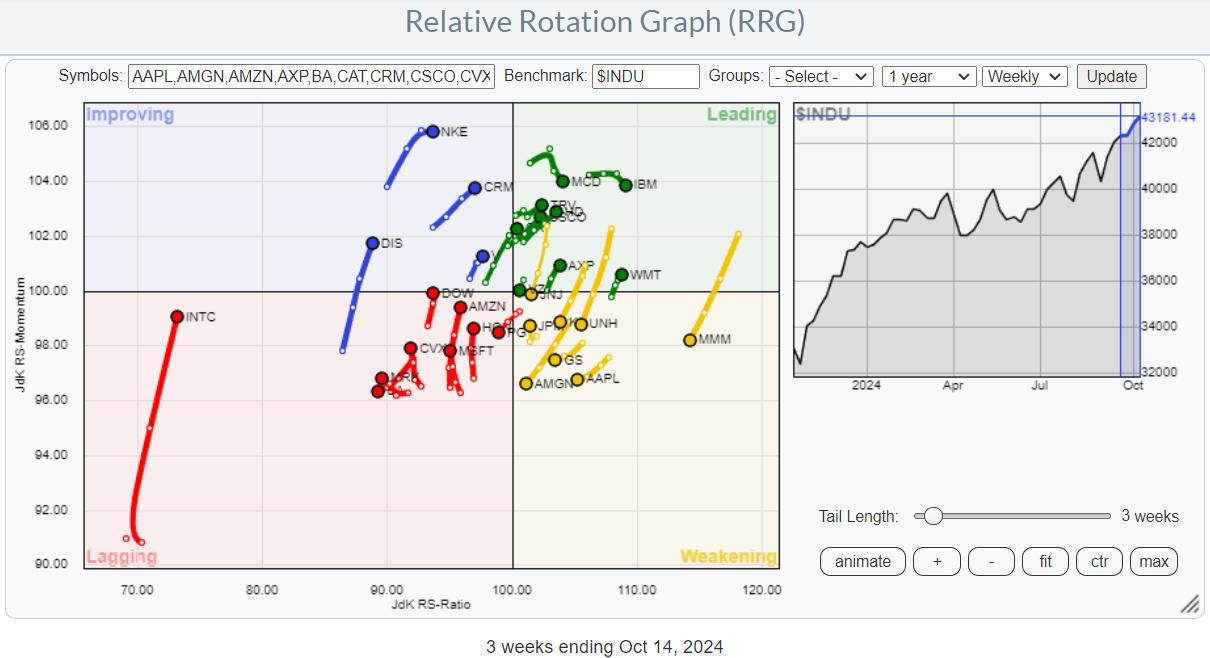
Using RRG To Find Best Three Stocks inside the DJ Industrials Index

by Julius de Kempenaer,
Senior Technical Analyst, StockCharts.com
KEY TAKEAWAYS
* Sector Rotation Model and current sector rotation are not supporting broad market strength.
* Plotting the members of $INDU on a Relative Rotation Graph helps find the best names in that universe.
* TRV, WMT, and AXP are still strong, but now have too much risk for new positions.
* CAT,...
READ MORE
MEMBERS ONLY

Final "Family Gathering" Meeting Today at 2 PM Eastern
Today, Larry Williams will be hosting his final "Family Gathering" meeting at 2pm Eastern Daylight Time (11am Pacific). Sign-in in begins 5 minutes prior. The show, which will include both a presentation from Larry and a viewer Q&A session, will be recorded and posted online for...
READ MORE
MEMBERS ONLY

Why the MACD Crossover Signal is SO Important

by Joe Rabil,
President, Rabil Stock Research
In this exclusive StockCharts TV video, Joe shares the MACD downside crossover signal and explains the different ways it can play out when it takes place above the MACD zero line. These downside crossovers can lead to opportunities depending on other criteria, including the ADX action. He then shows how...
READ MORE
MEMBERS ONLY

Sector Rotation is Giving Conflicting Stories!
by Julius de Kempenaer,
Senior Technical Analyst, StockCharts.com
In this video from StockCharts TV,Julius dives in to the sector rotation model, trying to find any alignment between theoretical and real-life rotations of sectors in combination with the economic cycle. The positions of the various sectors and the economic indicators that are part of this model are not...
READ MORE
MEMBERS ONLY

The Master Sentiment Chart You Need to Follow

by David Keller,
President and Chief Strategist, Sierra Alpha Research
KEY TAKEAWAYS
* The put/call ratio measures volumes in the options market to compare bullish vs. bearish positioning.
* The AAII Survey is close to the 50% bullish level, which often coincides with major market tops.
* The NAAIM Exposure Index, currently just above 90%, tells us that money managers are not...
READ MORE
MEMBERS ONLY

Larry's Final LIVE "Family Gathering" Webinar Airs THIS WEEK - Friday, October 18 at 2 PM EDT!
Larry is going LIVE! Don't miss the upcoming final "Family Gathering" webinar with Larry Williams, airing live through Zoom on Friday, October 18 at 2:00pm Eastern Daylight Time.
In this must-see event, Larry will be presenting his current opinions on a broad variety of current...
READ MORE
MEMBERS ONLY

The Next Big Move in Yields May Be Different Than You Think

by Martin Pring,
President, Pring Research
Below, Chart 1 shows a weekly plot for the 30-year yield, where we can see a perfectly formed top whose completion was followed by a negative 65-week EMA crossover. At the time of the breakdown, there were few grounds for suspecting a false break. However, in the last couple of...
READ MORE
MEMBERS ONLY
Stay Ahead: Key Sentiment Indicators to Track in October 2024!
by David Keller,
President and Chief Strategist, Sierra Alpha Research
Which market sentiment indicators should we follow to validate the current bull market phase and anticipate a potential market top? David Keller, CMT breaks down three sentiment indicators he's watching in October 2024, explains their calculations and methodology, reviews their signals during previous bull market cycles, and describes...
READ MORE
MEMBERS ONLY

MarketCarpets: The Fastest Way to Scan for Hidden Market Opportunities

by Karl Montevirgen,
The StockCharts Insider
KEY TAKEAWAYS
* Use the StockCharts MarketCarpets to get a fast snapshot of market trends without sifting through endless news.
* Toggle between performance and technical rankings like SCTR to find hidden opportunities.
* Make MarketCarpets part of your daily routine to catch opportunities faster than traditional methods.
When Wall Street rings its...
READ MORE
MEMBERS ONLY

DP Trading Room: NVDA Lifts Semiconductors Higher

by Erin Swenlin,
Vice President, DecisionPoint.com
It's time to put Semiconductors in the spotlight. NVDA is starting to trade at all-time highs again and that is likely to bring the Semiconductor industry group up to its own all-time highs. Erin discusses Semiconductors "under the hood" and highlights the NVDA chart.
Carl brings...
READ MORE
MEMBERS ONLY
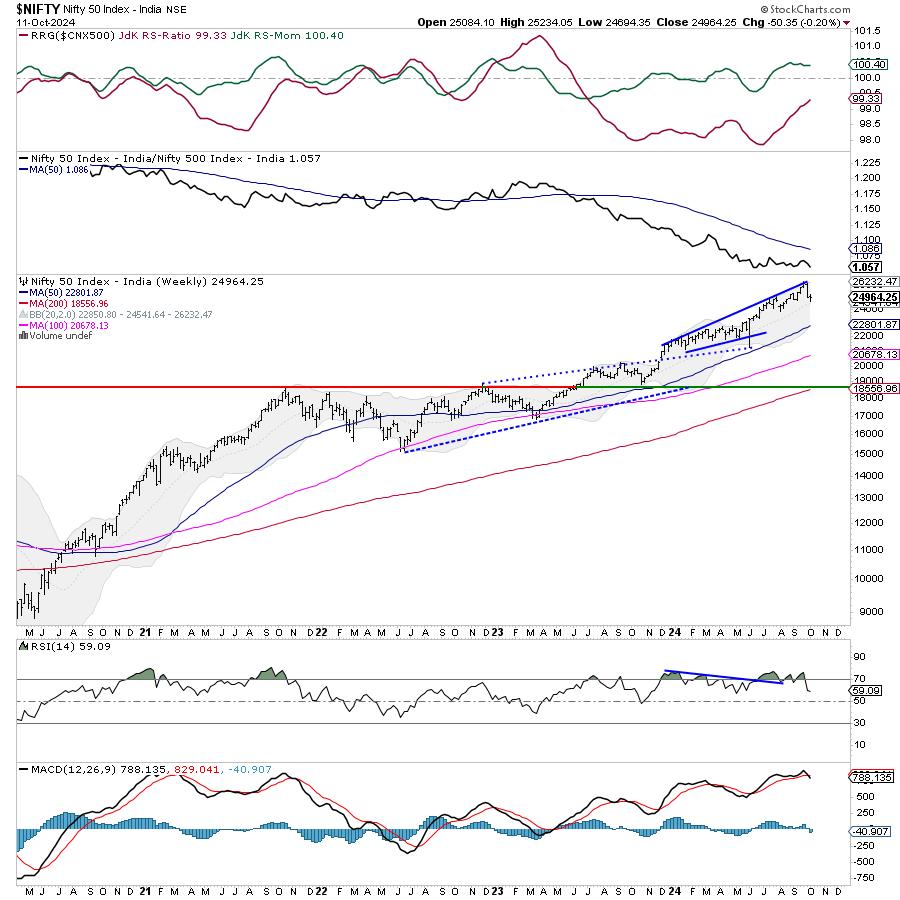
Week Ahead: While Nifty Consolidates, Keeping Above These Levels Crucial

by Milan Vaishnav,
Founder and Technical Analyst, EquityResearch.asia and ChartWizard.ae
The week that went by was in complete contrast to the week before, as the markets heavily consolidated in a tight range. In the previous week, the Nifty had seen a significant retracement of over 1167 points; however, over the past five trading days, the index stayed totally devoid of...
READ MORE
MEMBERS ONLY

The One Volume Indicator You Should Follow
by David Keller,
President and Chief Strategist, Sierra Alpha Research
KEY TAKEAWAYS
* While the daily volume reading can give us limited insight on the balance of buyers and sellers, Chaikin Money Flow gives a much clearer picture of trends in volume.
* Major tops in the last 12-18 months have been marked with a particular pattern in the S&P...
READ MORE
MEMBERS ONLY

Last Week's Pullback is a Buying Opportunity!

by Mary Ellen McGonagle,
President, MEM Investment Research
In this StockCharts TV video, Mary Ellen highlights what's driving these markets higher despite a rise in interest rates. She also focuses on the leadership area in Technology and shares several stocks from this group. Last up, she reviews how to quickly uncover top stock candidates when a...
READ MORE
MEMBERS ONLY

Small-Caps Get on Board!
by Erin Swenlin,
Vice President, DecisionPoint.com
Yesterday, we posted a short video about the lack of participation within the mid-and small-cap universes. Here, we had a rally to new all-time highs, yet we weren't seeing much of anything out of the broad market. Today was a reversal of fortune for these indexes, which rallied...
READ MORE
MEMBERS ONLY
It's Large-Cap Growth Stocks (Mag 7) Once Again
by Julius de Kempenaer,
Senior Technical Analyst, StockCharts.com
KEY TAKEAWAYS
* SPY is starting to resolve its negative divergence with RSI.
* Large-cap growth is coming back into favor.
* Magnificent 7 stocks provided 2.9% of the S&P 50's 6.8% performance over the past five weeks.
Where is the Recent Performance in the S&...
READ MORE
MEMBERS ONLY

Alert: Small-Caps Not Participating in New All-Time Highs
by Erin Swenlin,
Vice President, DecisionPoint.com
DecisionPoint has started posting short video alerts on our YouTube Channel. These videos are less than four minutes and give you the scoop on news you need to know about the market right now. Subscribe to the DecisionPoint.com YouTube Channel HERE so you'll be notified when these...
READ MORE
MEMBERS ONLY
Tech vs Semiconductors: Which One Should You Be Trading?
by Karl Montevirgen,
The StockCharts Insider
KEY TAKEAWAYS
* Doing a top-down sector-to-industry analysis can be an effective way to find tradable opportunities.
* It makes sense to compare charts to see which ones are outperforming and which are underperforming.
* Get a bigger picture, drill down using relative performance indicators, and then examine specific key levels of each...
READ MORE
MEMBERS ONLY

What's Wrong With This SPX Breakout?
by Joe Rabil,
President, Rabil Stock Research
In this exclusive StockCharts TV video, Joe presents the price pattern to follow the recent breakout in the S&P 500. He discusses narrow range bars, wide range bars and when they are important. Joe then explains what needs to take place now to either confirm a breakout or...
READ MORE
MEMBERS ONLY

Three Thoughts on Risk Management for October 2024
by David Keller,
President and Chief Strategist, Sierra Alpha Research
KEY TAKEAWAYS
* Watch the S&P 500's "line in the sand" for a signs of a breakdown in the major averages.
* Market breadth indicators could provide an early warning of a potential breakdown for the benchmarks.
* By being thoughtful about your position sizing for each...
READ MORE
MEMBERS ONLY

Why This S&P Support Level is SO IMPORTANT
by Julius de Kempenaer,
Senior Technical Analyst, StockCharts.com
In this video from StockCharts TV,Julius presents a few conflicting rotations and signals that continue to warrant caution while the S&P 500 keeps hovering just above support. With the negative divergences between price and MACD/RSI remaining intact, SPY should not break 565. Julius looks at rotations...
READ MORE
MEMBERS ONLY

Market Top in October? 2007 vs. 2024
by David Keller,
President and Chief Strategist, Sierra Alpha Research
Will we see a major market top during the month of October? Dave breaks down three market breadth indicators and compares their current configuration to what we observed at the 2007 market top. He then goes through the charts and reviews market topping conditions from a breadth perspective using the...
READ MORE
MEMBERS ONLY

Did We Just See a False Breakdown in Crude Oil?
by Martin Pring,
President, Pring Research
Using West Texas Crude, Chart 1 features one of my favorite techniques for identifying changes in long-term trends, which is simply a PPO using the 6- and 15-month parameters. When it is above zero, it's bullish, and when below, bearish. The pink shading indicates bearish periods, and the...
READ MORE
MEMBERS ONLY

DP Trading Room: A Case for a Market Top
by Erin Swenlin,
Vice President, DecisionPoint.com
During today's market analysis Carl laid out his reasons why we believe we are at a market top. He discusses the current market price action combined with exclusive DecisionPoint indicators to substantiate his position. Don't miss his analysis.
Carl also goes though the Magnificent Seven by...
READ MORE
MEMBERS ONLY

Week Ahead: Putting Market Moves in Perspective; Watch Nifty From This Angle
by Milan Vaishnav,
Founder and Technical Analyst, EquityResearch.asia and ChartWizard.ae
On the back of one of the major FII selloffs seen in recent times, the markets succumbed to strong corrective pressure through the week and ended on a very weak note. The Nifty 50 remained under selling pressure; at no point in time did it show any intention to stage...
READ MORE
MEMBERS ONLY

Stealth AI Stocks Are Taking Off in a Flat Market
by Mary Ellen McGonagle,
President, MEM Investment Research
In this StockCharts TV video, Mary Ellen highlights the continuation rally in AI-related stocks while also reviewing broader market conditions. The move higher in yields as well as volatility were discussed heading into next week's FOMC notes and inflation data.
This video originally premiered October 4, 2024. You...
READ MORE
MEMBERS ONLY

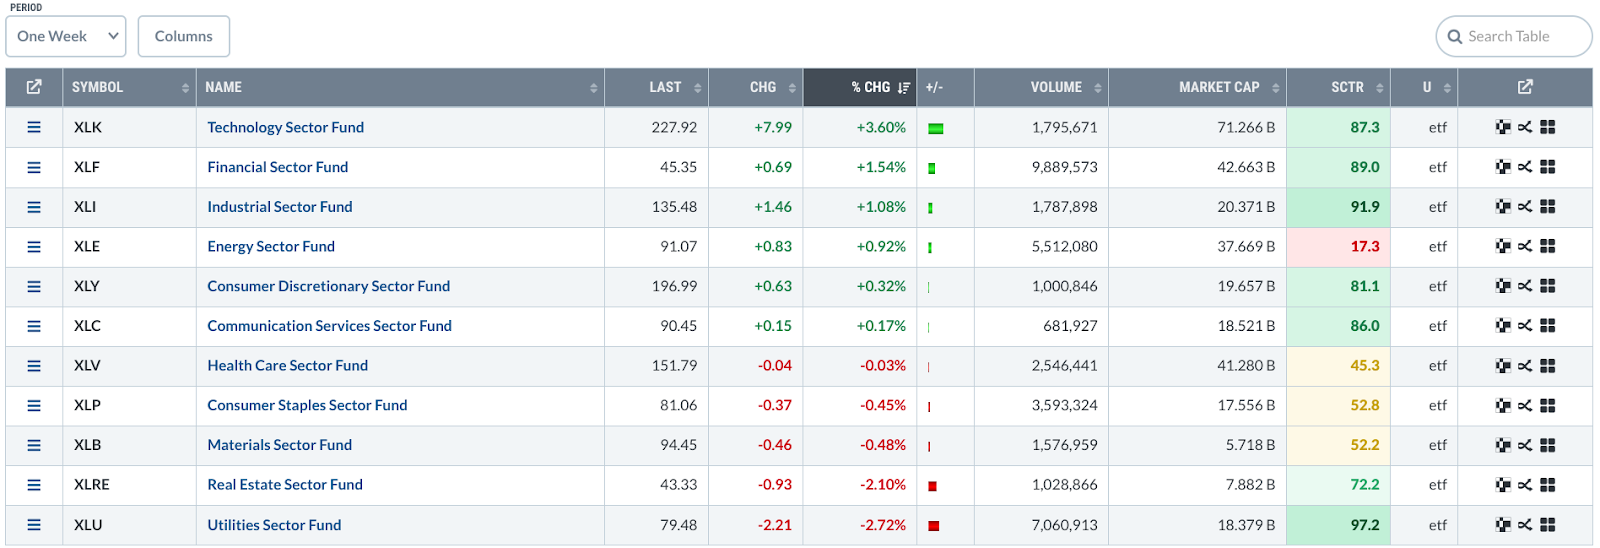
Stocks Soar, Energy Prices Spike: Are Geopolitical Tensions to Blame?

by Jayanthi Gopalakrishnan,
Director of Site Content, StockCharts.com
KEY TAKEAWAYS
* The macro picture of the US economy remains strong with the broader equity indexes in an uptrend.
* There has been some rotation in the sectors with Energy taking the lead as a result of rising crude oil prices.
* Use the StockCharts MarketCarpet to select stocks for your ChartLists....
READ MORE
MEMBERS ONLY
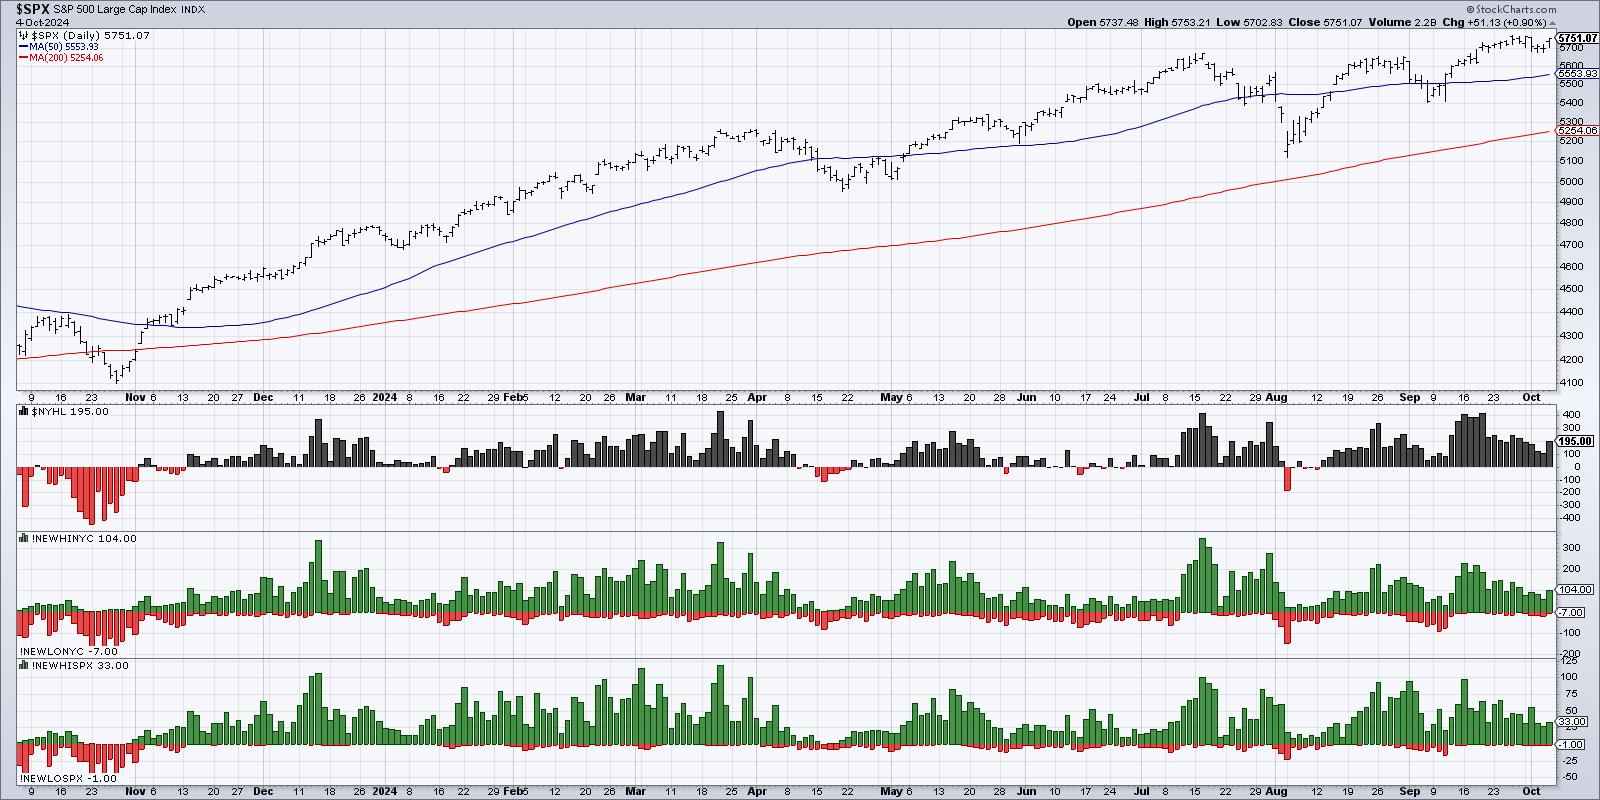
Does the Market Have Bad Breadth?
by David Keller,
President and Chief Strategist, Sierra Alpha Research
KEY TAKEAWAYS
* There have been less new 52-week highs since mid-September, suggesting leaders are falling off.
* The percent of S&P 500 members above their 50-day moving average is below 75%, which often serves as a threshold for a downturn.
* The S&P 500 Bullish Percent Index remains...
READ MORE
MEMBERS ONLY
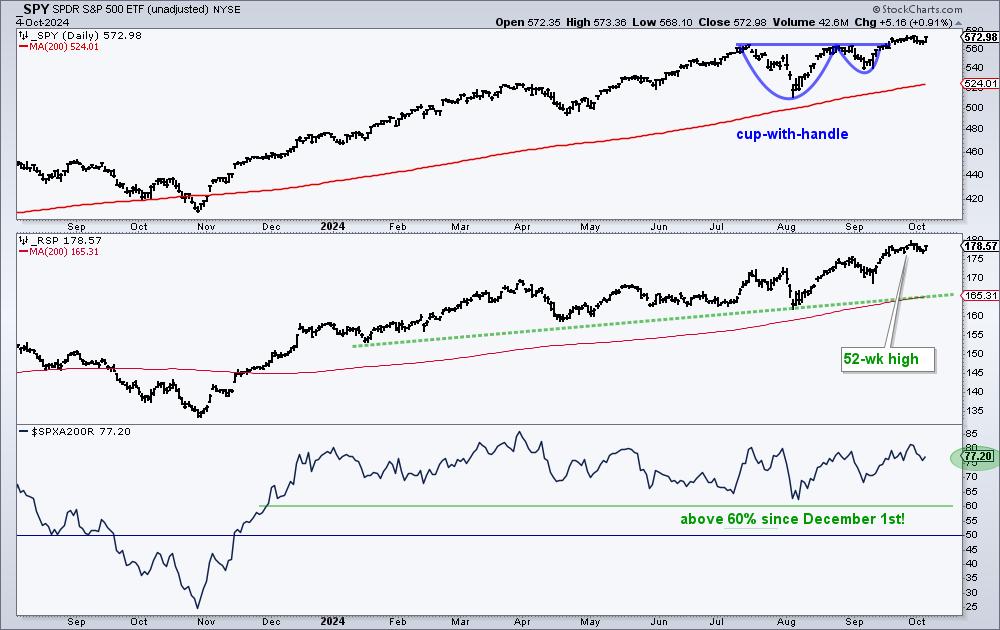
What More do the Bulls Want?

by Arthur Hill,
Chief Technical Strategist, TrendInvestorPro.com
KEY TAKEAWAYS
* Over 70% of S&P 500 stocks are above their 200-day SMAs.
* SPY and RSP are trading near new highs.
* We see a bullish continuation pattern in a key AI stock.
It is a bull market for stocks. On the chart below, the S&P 500...
READ MORE
MEMBERS ONLY

Will Technology Drive S&P Higher in October?
by Julius de Kempenaer,
Senior Technical Analyst, StockCharts.com
In this video from StockCharts TV,Julius explores the October seasonal outlook for the S&P 500 and various sectors. Seasonality suggests a potential rise in the S&P 500, fueled by strength in technology, but there are still concerns about the ongoing negative divergence between price and...
READ MORE
MEMBERS ONLY

China Stocks May Be On to Something
by Martin Pring,
President, Pring Research
China's stock market exploded last week in an amazing rally, so formidable that it raises the question of whether it could be the start of a new bull market, or just a short-covering rally which will quickly fizzle out. In that respect, it's important to note...
READ MORE
MEMBERS ONLY

These 4 Chinese Stocks are Worth a Look
by Joe Rabil,
President, Rabil Stock Research
In this exclusive StockCharts TV video, Joe explains how to use two timeframes to identify 2 important characteristics of a great setup. For examples, he shares a few Chinese stocks that are showing great strength to the upside and what levels to watch for a pullback. Joe also covers the...
READ MORE
MEMBERS ONLY

With 2024 Q2 Earnings In, Market Remains Very Overvalued

by Carl Swenlin,
President and Founder, DecisionPoint.com
S&P 500 earnings are in for 2024 Q2, and here is our valuation analysis.
The following chart shows the normal value range of the S&P 500 Index, indicating where the S&P 500 would have to be in order to have an overvalued P/E...
READ MORE
MEMBERS ONLY

US Sectors Soar to New Highs!
by Julius de Kempenaer,
Senior Technical Analyst, StockCharts.com
In this video from StockCharts TV,Julius takes a detailed look at the monthly charts for all US sectors and the S&P 500. With many sectors breaking to new highs, he highlights how the long-term uptrend for the S&P 500 remains intact. Julius also examines the...
READ MORE
MEMBERS ONLY

Are Lower Interest Rates Bad For Workers? | Focus on Stocks: October 2024
by Larry Williams,
Veteran Investor and Author
The common economic perception is that lower interest rates are good for business, which, in turn, means good for job growth. The following charts will turn that idea upside down and inside out. Keep in mind there is no chart fancy-dancing going on here; I am just presenting the last...
READ MORE
MEMBERS ONLY

DP Trading Room: Uncovering Stocks from DP Scan Alerts
by Erin Swenlin,
Vice President, DecisionPoint.com
In today's free DecisionPoint Trading Room, Erin pulls out her exclusive DecisionPoint Diamond Scans and finds us some new and interesting stock symbols to explore further. These scans are very powerful and bring the best charts to your attention. DecisionPoint has a new Scan Alert System for purchase...
READ MORE
MEMBERS ONLY

Why Were Chinese Stocks Up 20% Last Week?!
by Mary Ellen McGonagle,
President, MEM Investment Research
In this StockCharts TV video, Mary Ellen reviews the broader markets, including sector and industry group rotation, before highlighting the sharp move into Chinese stocks. She shares her thoughts on whether it's too late to participate. In addition, she looks at the key traits that signal your stock...
READ MORE
MEMBERS ONLY

Stock Market Regains Bullish Edge: Can Geopolitical Tensions Change Its Direction?
by Jayanthi Gopalakrishnan,
Director of Site Content, StockCharts.com
KEY TAKEAWAYS
* The stock market got an influx of positive news, bringing bullish momentum.
* The Dow Jones Industrial Average closed at a record high on Friday.
* Investors are rotating out of mega-cap tech stocks and into other areas such as precious metals, as well as China-related stocks and ETFs.
There&...
READ MORE
MEMBERS ONLY

Top Ten Charts to Watch for October 2024
by David Keller,
President and Chief Strategist, Sierra Alpha Research
As we near the end of what has been a fairly solid Q3 for the equity markets, we are left with the eternal question for investors: "What's next?"
We now have the Fed's first rate cut in the rearview mirror, with multiple rate cuts...
READ MORE
MEMBERS ONLY

Opportunities in Industrials and Materials
by Julius de Kempenaer,
Senior Technical Analyst, StockCharts.com
KEY TAKEAWAYS
* Negative divergence remains a distracting factor
* Defensive rotation still present
* Industrials and Materials on positive track toward leading RRG quadrant
Despite a backdrop of conflicting market signals, there are still sectors within the S&P 500 that are showing promising movements and potential opportunities for investors. Today,...
READ MORE