MEMBERS ONLY

Stock Market Looks Quiet, But Important Shifts are Underway

by Mary Ellen McGonagle,
President, MEM Investment Research
The stock market may look calm on the surface, but leadership is shifting beneath the surface. Find out where leadership is rotating and how selective stock opportunities are emerging....
READ MORE
MEMBERS ONLY
These Areas Are Holding Up — Many Are Not!
by Mary Ellen McGonagle,
President, MEM Investment Research
Mary Ellen McGonagle breaks down a market where strength is holding up in only certain areas while many others continue to weaken. She highlights where relative strength is showing up, where momentum is fading, and what investors should be watching in a selective market....
READ MORE
MEMBERS ONLY

Foreign Markets May Be More Attractive Than the U.S. in 2026

by Tom Bowley,
Chief Market Strategist, EarningsBeats.com
Investors are rotating to foreign markets and value stocks. Tom Bowley analyzes the relative strength of foreign stocks against the S&P 500 and identifies which markets are in the strongest trends....
READ MORE
MEMBERS ONLY

Stocks Steady, Small Caps Lead, Gold Surges: What the Charts Are Really Saying?

by Jayanthi Gopalakrishnan,
Director of Site Content, StockCharts.com
The S&P 500 holds its uptrend as small caps lead and gold surges. Here’s what the charts say about market direction and risk.
...
READ MORE
MEMBERS ONLY

Ignore the Headlines — This Is Where the Money Is Going!
by Tom Bowley,
Chief Market Strategist, EarningsBeats.com
Markets were mixed last week, but Tom Bowley explains why the real story isn’t in the headlines. He breaks down where money is rotating right now — and why those early-January signals matter more than index levels....
READ MORE
MEMBERS ONLY

Market Risk Is Rising — But These Stocks Look Better on Pullbacks

by Joe Rabil,
President, Rabil Stock Research
Joe Rabil of Rabil Stock Research explains why a pullback could create better stock opportunities, even as overall market risk rises. From there, he reviews SPY conditions, volatility, sentiment, and recent symbol requests....
READ MORE
MEMBERS ONLY

Market Rotation: Is "Sell America 2.0" Just Another Leadership Shift?
Rising interest rates and weakening tech are reshaping stock market leadership. Learn how market rotation works and what "Sell America 2.0" means for investors. ...
READ MORE
MEMBERS ONLY

RSI Signals Most Traders Misread — Overbought Levels & Divergences That Matter

by David Keller,
President and Chief Strategist, Sierra Alpha Research
Dave Keller breaks down RSI signals that many traders misread, including overbought conditions and bearish divergences. Using real chart examples, he explains which RSI signals actually matter as momentum shifts....
READ MORE
MEMBERS ONLY

Technology’s Sideways Market Is Hiding a Big Shift
by Mary Ellen McGonagle,
President, MEM Investment Research
The Technology sector has been range-bound and is undergoing some internal shifts beneath the surface. Find out what these shifts are and how you can capitalize on these moves....
READ MORE
MEMBERS ONLY
Market Leadership Is Narrowing — What’s Still Working?
by Mary Ellen McGonagle,
President, MEM Investment Research
Mary Ellen McGonagle breaks down how market leadership is narrowing as more areas lose strength. She highlights the sectors and stocks that are working and the signals investors should be watching in an increasingly selective market....
READ MORE
MEMBERS ONLY

Broadening Trade Benefits Small-Caps and Non-Tech, But Don't Count XLK Out Just Yet

by Arthur Hill,
Chief Technical Strategist, TrendInvestorPro.com
The bull market is seeing broader participation with industry groups such as Home Construction, Retail, and Regional Bank stocks breaking out. Here's an analysis of the various sectors and industry groups that are showing strength, plus a stock you may want to consider....
READ MORE
MEMBERS ONLY

Market Strength is Spreading, Just Not Where You Might Expect
by Jayanthi Gopalakrishnan,
Director of Site Content, StockCharts.com
The S&P 500 consolidates while market breadth improves. Small caps, semiconductors, and the S&P 500 Equal-Weight Index highlight a broader rally....
READ MORE
MEMBERS ONLY

Is History Repeating Itself? These Signals Are Concerning
by Tom Bowley,
Chief Market Strategist, EarningsBeats.com
Major indices remain near record levels as key market relationships begin to resemble conditions that can come before market tops. Tom Bowley breaks down the signals Wall Street is sending beneath the surface and explains why this familiar setup deserves close attention....
READ MORE
MEMBERS ONLY
10-Year Yield at a Critical Juncture — What Happens Next?
by Joe Rabil,
President, Rabil Stock Research
Joe Rabil of Rabil Stock Research breaks down why the 10-year yield is at a critical juncture after months of quiet trading, along with what that might signal. He also reviews SPY market conditions, gold, silver, and recent stock requests....
READ MORE
MEMBERS ONLY

Commodities Moving the Chains in Early 2026
Point & Figure charts are showing a breakout in broad commodities with a price target that suggests commodities have room to run. Here's a deep dive into the technical chart patterns that could support the run in commodities....
READ MORE
MEMBERS ONLY

Mixed Signals to Start the Year: Is Stock Market Leadership Changing?
by Jayanthi Gopalakrishnan,
Director of Site Content, StockCharts.com
Early price action shows mixed signals as Financials weaken, tech stalls, and oil, the dollar, and Bitcoin show signs of changing trends....
READ MORE
MEMBERS ONLY

Three Breadth Signals Confirming the Market’s Bullish Trend
by David Keller,
President and Chief Strategist, Sierra Alpha Research
Market breadth has improved dramatically as the S&P 500 pushes to new highs. Dave Keller, CMT, reviews three key breadth indicators—including advance-decline lines, new highs vs. lows, and stocks above key moving averages—to assess whether this bullish trend remains intact....
READ MORE
MEMBERS ONLY
5 Breadth Signals Powering the 2026 Breakout and What Would Break It
by David Keller,
President and Chief Strategist, Sierra Alpha Research
David Keller breaks down five key breadth signals confirming the market’s 2026 breakout. At the same time, he also examines what each indicator could do that would signal weakening participation and a potential breakdown....
READ MORE
MEMBERS ONLY

Is the US Market Losing its Edge Relative to Global Equities?

by Martin Pring,
President, Pring Research
Are the U.S. markets showing signs of running out of steam? Martin Pring analyzes the relative strength of U.S. indexes with respect to non-U.S. indexes. Another group that could gain momentum is small-caps. Here's what you should be watching. ...
READ MORE
MEMBERS ONLY

Markets Look Past DC Drama as Bank Earnings and Charts Take Center Stage
Earnings season kicks off this week with big banks reporting. Follow the price action and market-based indicators in these charts to get clear clues rather than media headlines....
READ MORE
MEMBERS ONLY

Nifty at a Crossroads; Awaits Clarity from Global Triggers

by Milan Vaishnav,
Founder and Technical Analyst, EquityResearch.asia and ChartWizard.ae
The Nifty was the only major global equity index to end the week in the red amid US tariff uncertainty. Is it vulnerable to further pressure?...
READ MORE
MEMBERS ONLY

How Government Policy Is Driving the Stock Market in 2026
by Mary Ellen McGonagle,
President, MEM Investment Research
Government policy decisions are moving industry groups as the focus shifts to energy security, housing affordability, and manufacturing. Find out which stocks are showing breakout potential....
READ MORE
MEMBERS ONLY

The Market Is Shifting — What You Should Be Watching Now
by Mary Ellen McGonagle,
President, MEM Investment Research
Mary Ellen McGonagle breaks down how market participation and sector movement are shifting early in the year, highlighting key signals investors should be watching as leadership rotates beneath the surface....
READ MORE
MEMBERS ONLY

The State of the Market: Trend, Breadth & Leadership, Plus a Trend-Momentum Strategy
by Arthur Hill,
Chief Technical Strategist, TrendInvestorPro.com
The S&P 500 is in a clear uptrend with strong breadth, and three sectors leading the trend are Finance, Health Care, and Industrials. Arthur Hills shows you how to use a top-down approach to identify oversold stocks within uptrends....
READ MORE
MEMBERS ONLY

The Stock Market’s Moving, But It’s Tapping the Brakes
by Jayanthi Gopalakrishnan,
Director of Site Content, StockCharts.com
The S&P 500 is edging higher but lacks conviction. Here are the key support levels, catalysts, and leadership shifts to watch as 2026 begins....
READ MORE
MEMBERS ONLY

The Market is Up, But the Warning Signs Are Adding Up!
by Tom Bowley,
Chief Market Strategist, EarningsBeats.com
Markets opened 2026 with solid gains, but Tom Bowley explains why several warning signs beneath the surface deserve attention. He breaks down leadership trends and intermarket relationships that are failing to confirm the rally, highlighting what traders should keep their eyes on....
READ MORE
MEMBERS ONLY
Momentum Is Building — These Stocks Stand Out!
by Joe Rabil,
President, Rabil Stock Research
Joe Rabil of Rabil Stock Research breaks down a momentum shift, highlighting stocks beginning to stand out based on trend, momentum, and relative strength. He also reviews SPY market conditions, including volatility, sentiment, and multi-timeframe trend analysis....
READ MORE
MEMBERS ONLY

Financials, Semiconductors, and Bitcoin Are Moving: Here’s Why

by Frank Cappelleri,
Founder & President, CappThesis, LLC
Frank Cappelleri breaks down why financials and semiconductors are showing strength and how Bitcoin is attempting to regain momentum early in 2026. Failed breakdowns, bullish patterns, and key levels are shaping what happens next in the market....
READ MORE
MEMBERS ONLY

Broadening, Broadening Everywhere in Early 2026: Record-High Mid-Caps
A shift is taking place in the stock market that investors shouldn't ignore. As leadership rotates beyond mega-cap stocks, mid-caps are breaking to record highs. What does this early-year price action indicate? Find out here....
READ MORE
MEMBERS ONLY
S&P 500 Earnings In for 2025 Q3; Overvaluation Persists

by Carl Swenlin,
President and Founder, DecisionPoint.com
S&P 500 P/E in Q3 2025 is above normal and projected to rise in 2026. These charts will help you keep track of quarterly earnings....
READ MORE
MEMBERS ONLY

Strong Start to 2026, But Will Nifty Hold the Momentum?
by Milan Vaishnav,
Founder and Technical Analyst, EquityResearch.asia and ChartWizard.ae
Nifty's technical setup remains in a strong uptrend, trading above key moving averages. However, momentum seems to have moderated, suggesting possible fatigue. Here's a technical deep dive to prepare you for the coming week....
READ MORE
MEMBERS ONLY

What's Behind This Market Bounce? The Signals That Matter
by Mary Ellen McGonagle,
President, MEM Investment Research
The stock market kicked off the new year with a bounce, but is the strength as solid as it looks on the surface?
In this video, Mary Ellen McGonagle digs into the January rebound and takes a closer look at what's fueling the move. She breaks down recent...
READ MORE
MEMBERS ONLY

The Stock Market May Be Waking Up: It’s Not Just Tech Anymore
by Jayanthi Gopalakrishnan,
Director of Site Content, StockCharts.com
Friday's market bounce brought a surprise: strength beyond Big Tech. See which sectors and ETFs are leading, and what it could mean for 2026....
READ MORE
MEMBERS ONLY

Warning Signs Are Growing, Be Prepared!
by Tom Bowley,
Chief Market Strategist, EarningsBeats.com
What should investors look forward to in 2026? Here's Tom Bowley's outlook. ...
READ MORE
MEMBERS ONLY

Everyone’s Bullish on 2026 - That’s the Problem!
by Tom Bowley,
Chief Market Strategist, EarningsBeats.com
The market ended 2025 on shaky footing despite a strong overall year, raising questions about what lies ahead. Tom Bowley explains why rising complacency, fading leadership, and a weak year-end pattern may matter more in 2026 than most investors realize....
READ MORE
MEMBERS ONLY

5 Charts That Will Define Markets in 2026
What's on tap for 2026? Here's a deep dive into the five charts that matter most as this bull market matures....
READ MORE
MEMBERS ONLY
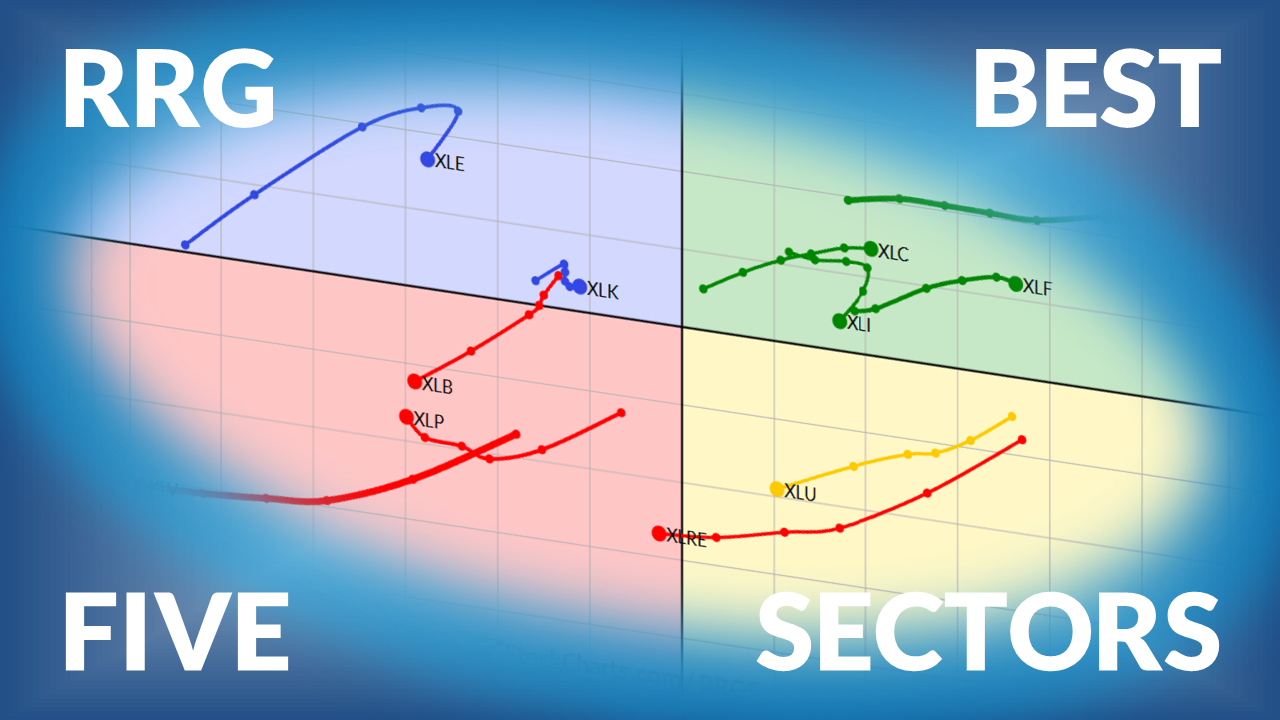
The Best Five Sectors This Week, #51

by Julius de Kempenaer,
Senior Technical Analyst, StockCharts.com
Weekly update on US sector ranking based on Relative Rotation Graphs....
READ MORE
MEMBERS ONLY

Volatility Hits Rock Bottom, What It Means for the Week Ahead
by Milan Vaishnav,
Founder and Technical Analyst, EquityResearch.asia and ChartWizard.ae
Though the NIFTY is trading just below lifetime highs, it appears to be in a zone of indecision. What's the best strategy in a setting where any adverse trigger could make the market vulnerable?...
READ MORE