MEMBERS ONLY

Below the 200-Day: What’s Next for the S&P 500?

by David Keller,
President and Chief Strategist, Sierra Alpha Research
The S&P 500 has broken below key support and its 200-day moving average, signaling a confirmed bearish phase. Dave Keller, CMT, outlines a downside target near 6200 and explains how short-term rallies could emerge before the broader downtrend continues....
READ MORE
MEMBERS ONLY
S&P 500 Breakdown: Next Downside Targets to Watch
by David Keller,
President and Chief Strategist, Sierra Alpha Research
The S&P 500 has broken key support, confirming a shift into a downtrend. Dave Keller outlines the next downside targets and the indicators to watch for a potential bounce or continued weakness....
READ MORE
MEMBERS ONLY
Mag 7 Malaise: What Big Tech’s Slide Means for the S&P 500
Where do the Mag 7 stocks go from here? These charts suggest further downside before the group finds its footing. However, seasonal trends show that a bullish period may be getting close. ...
READ MORE
MEMBERS ONLY

Week Ahead: Short Trading Week May Keep Markets Anxious As They Stay Modestly Oversold

by Milan Vaishnav,
Founder and Technical Analyst, EquityResearch.asia and ChartWizard.ae
The Nifty has fallen below key short-term support levels. Milan Vaishnav analyzes the index via indicators such as RSI and MACD and suggests investors take a cautious and defensive approach. He also analyzes sector performance against the Nifty 500 Index....
READ MORE
MEMBERS ONLY

Market Leadership Is Changing, Here's Where to Look

by Mary Ellen McGonagle,
President, MEM Investment Research
Mary Ellen McGonagle analyzes shifting market leadership as defensive sectors gain strength and tech weakens. See where money is rotating and what to watch next....
READ MORE
MEMBERS ONLY
S&P 500 Needs One Key Ingredient for Bottom

by Tom Bowley,
Chief Market Strategist, EarningsBeats.com
The Dow Industrials, Nasdaq 100, and Russell 2000 reached a 10% correction, and the S&P 500 is getting close. Volatility is elevated, and the Technology sector closed below a key support level. Tom Bowley breaks it all down using easy-to-digest charts....
READ MORE
MEMBERS ONLY

SPY and QQQ Break; High-Low Line Flattens; Lessons from the Oil and Rate Shock in 2022

by Arthur Hill,
Chief Technical Strategist, TrendInvestorPro.com
Oil prices are elevated, interest rates are rising, and the SPY is below its 200-day moving average. Arthur Hill compares the current market to the 2022 bear market and uncovers some interesting similarities....
READ MORE
MEMBERS ONLY
Before You Buy the Dip, Look at These 3 Charts

by Jayanthi Gopalakrishnan,
Director of Site Content, StockCharts.com
The major stock market indexes are under pressure. Learn what the charts say now, which support levels matter, and why caution still makes sense for investors....
READ MORE
MEMBERS ONLY
These Sectors Are Leading but the Market Is at a Turning Point

by Joe Rabil,
President, Rabil Stock Research
Joe Rabil highlights leading sectors and explains why oversold areas like tech and financials could see a bounce. He also reviews sentiment, volatility, and key support levels as the market approaches a potential turning point....
READ MORE
MEMBERS ONLY

Time for an Easter Rally?

by Martin Pring,
President, Pring Research
The recent stock market pullback may be hitting a floor. Discover which oversold indicators Martin Pring is monitoring for the next big trend reversal....
READ MORE
MEMBERS ONLY
S&P 500 Pullbacks Are Changing. What’s Different Now?

by Frank Cappelleri,
Founder & President, CappThesis, LLC
S&P 500 pullbacks are starting to behave differently following a confirmed breakdown and rising volatility. Frank Cappelleri explains what’s changed, what signals are weakening, and what needs to happen next....
READ MORE
MEMBERS ONLY

The Best Five Sectors This Week #58

by Julius de Kempenaer,
Senior Technical Analyst, StockCharts.com
Julius de Kempenaer presents his weekly update on US sector rotation using Relative Rotation Graphs....
READ MORE
MEMBERS ONLY
Are Sentiment Indicators Bearish Enough to Be Bullish?
by David Keller,
President and Chief Strategist, Sierra Alpha Research
Sentiment has turned more bearish, but is it bearish enough to signal a market low? Join Dave Keller as he reviews the VIX, AAII survey, NAAIM exposure, and put/call ratios to show why conditions may not be extreme just yet....
READ MORE
MEMBERS ONLY

StockCharts Insider: Why Should I Trade This Stock and Not That One?

by Karl Montevirgen,
The StockCharts Insider
Before We Dive In…
You’re looking at two stocks. Both seem promising. Both are starting to move. But which one do you trade? Spend five minutes on social media forums and you’ll see this question pop up everywhere. Many traders choose based on the story, the brand, or...
READ MORE
MEMBERS ONLY

S&P 500's Next Move: Tumbling Toward a Technical Correction or a Bounce?
With equities and other asset classes falling hard and bond yields rising, traders and investors are looking for a bottom to get back in. Mike Zaccardi analyzes the S&P 500 as well as gold and oil to uncover the signals of a market bottom....
READ MORE
MEMBERS ONLY

Why Oil Prices May Stay Elevated Into Mid-2026 and the Impact On the Stock Market
by Mary Ellen McGonagle,
President, MEM Investment Research
How long will oil prices stay elevated? Mary Ellen McGonagle analyzes the industry against the backdrop of the broader market....
READ MORE
MEMBERS ONLY

Selling Will Likely Escalate If S&P 500 Loses This Support Level
by Tom Bowley,
Chief Market Strategist, EarningsBeats.com
With volatility rising and key support nearing, a breakdown in the S&P 500 could trigger increased selling pressure. Tom Bowley analyzes the warning signs....
READ MORE
MEMBERS ONLY

SPY Hits Key Moment as Bearish Breadth Signal Triggers; Yield Spreads Channel March 2025
by Arthur Hill,
Chief Technical Strategist, TrendInvestorPro.com
Breadth in the SPY, QQQ, and IWM are getting close to their 200-day moving averages. Arthur Hill looks beneath the surface and uncovers the price structure in the ETFs and analyzes the BBB spread....
READ MORE
MEMBERS ONLY

Fed Uncertainty Sparks Selloff — This Level Matters Now
by Tom Bowley,
Chief Market Strategist, EarningsBeats.com
Hot inflation data and Fed uncertainty triggered a sharp late-day selloff in stocks and bonds. Tom Bowley breaks down weakening breadth, rising volatility, and why the S&P 500’s key support level could determine what happens next....
READ MORE
MEMBERS ONLY
This Pullback May Be Setting Up the Next Move Higher
by Joe Rabil,
President, Rabil Stock Research
A market pullback with improving sentiment may be setting up the next move higher. Follow along as Joe Rabil highlights key signals and stocks showing constructive setups....
READ MORE
MEMBERS ONLY

Are Investors Too Bearish? What Sentiment Signals Say About Stocks Now
Investor pessimism is spiking. Discover what the critical sentiment signals say now and bookmark these charts to catch the moment the market reverses toward optimism....
READ MORE
MEMBERS ONLY

StockCharts Insider: Market Breadth 101 — What Index Price Doesn’t Tell You
by Karl Montevirgen,
The StockCharts Insider
Before We Dive In…
When the S&P 500 makes a 1% move up, it feels like the market is exhibiting strength. But is it? Sometimes an index will rise because a handful of mega-caps are doing the heavy lifting. What you don’t see are the other...
READ MORE
MEMBERS ONLY
These Charts Could Decide the Next Market Move
by David Keller,
President and Chief Strategist, Sierra Alpha Research
Why hasn’t the market broken down, even amid weakening breadth? Dave Keller shows how a small group of mega-cap stocks may be holding the indexes together, and the key levels that could decide the next market move....
READ MORE
MEMBERS ONLY

Week Ahead: NIFTY Near To Its Inflection Point; Minor Rebounds Likely, Though Overall Structure Stays Bearish
by Milan Vaishnav,
Founder and Technical Analyst, EquityResearch.asia and ChartWizard.ae
With the Indian market ending the week in the negative and volatility elevated, Milan Vaishnav digs into what the coming days hold for the Nifty....
READ MORE
MEMBERS ONLY
Oil Prices Triggering a Market Domino Effect
by Mary Ellen McGonagle,
President, MEM Investment Research
Oil volatility is creating a chain reaction across markets as rising prices, fuel inflation fears, and push interest rates higher. Follow along as Mary Ellen McGonagle highlights the sectors weakening, the areas holding up, and the key levels investors should be watching....
READ MORE
MEMBERS ONLY
Large-Caps Hold Up Better Than Smalls; Trend Signals for SPY; A Bullish Setup in Based Metals
by Arthur Hill,
Chief Technical Strategist, TrendInvestorPro.com
Despite geopolitical tensions, the S&P 500 has held up well and is relatively close to its recent highs. When does the pullback turn into a long-term downtrend? Arthur Hill analyzes the market environment and highlights what investors should monitor....
READ MORE
MEMBERS ONLY

Market Breadth Breakdown: Why the Market Has “Bad Breadth” in March 2026
by David Keller,
President and Chief Strategist, Sierra Alpha Research
The S&P 500 may look stable, but market breadth is quietly deteriorating. Dave Keller breaks down key breadth indicators and explains why weakening participation could signal trouble ahead....
READ MORE
MEMBERS ONLY
Not Even Rising Fear Can Crack This Market
by Tom Bowley,
Chief Market Strategist, EarningsBeats.com
Fear is rising across markets as volatility spikes and headlines pile up. In this video, Tom Bowley explains why key accumulation signals and improving growth leadership suggest buyers are still supporting this market....
READ MORE
MEMBERS ONLY

Stock Market Is Sending Mixed Signals; Here’s What to Watch
by Jayanthi Gopalakrishnan,
Director of Site Content, StockCharts.com
The stock market is sending mixed signals. See what the charts reveal about current trends and why semiconductors may lead the next move....
READ MORE
MEMBERS ONLY
These Tech Stocks Are Close to Triggering Upside Breakouts
by Joe Rabil,
President, Rabil Stock Research
Joe Rabil highlights several tech stocks forming constructive pullbacks that could soon trigger upside breakouts. He also reviews S&P 500 market conditions, key support levels, and how relative strength helps confirm emerging setups....
READ MORE
MEMBERS ONLY
S&P 500 Pullbacks Keep Getting Bought. Why?
by Frank Cappelleri,
Founder & President, CappThesis, LLC
S&P 500 pullbacks keep attracting buyers, even as momentum signals weaken. Join Frank Cappelleri as he explains why dip-buying continues to support the market in spite of rising volatility and mixed technical signals....
READ MORE
MEMBERS ONLY
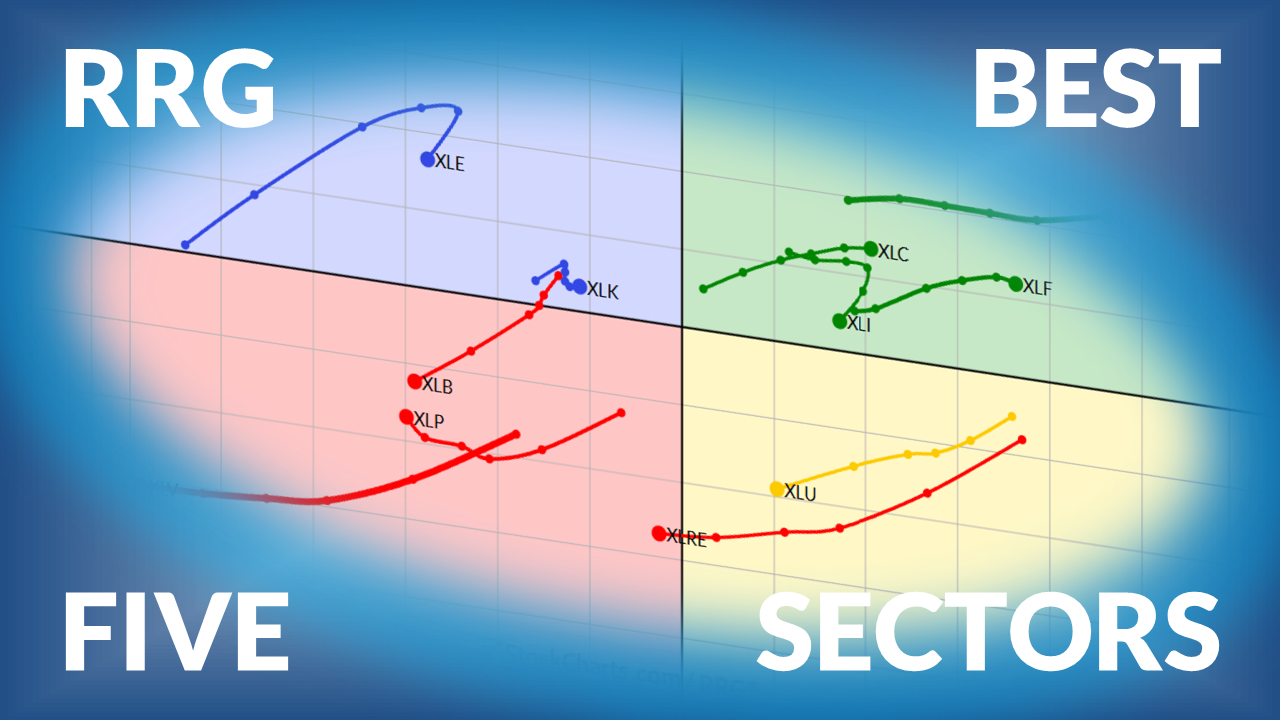
The Best Five Sectors This Week #56
by Julius de Kempenaer,
Senior Technical Analyst, StockCharts.com
Julius presents his weekly sector rotation update based on Relative Rotation Graphs....
READ MORE
MEMBERS ONLY

Week Ahead: NIFTY Rests At Crucial Support; Any Close Below This Level May Invite Incremental Weakness
by Milan Vaishnav,
Founder and Technical Analyst, EquityResearch.asia and ChartWizard.ae
Nifty has slipped back and closed exactly at its 100-week moving average, which has historically been a support level. Is it at risk for more downside?...
READ MORE
MEMBERS ONLY
A Market in Transition: Navigating Volatility and Rising Macro Risk
by Mary Ellen McGonagle,
President, MEM Investment Research
Rising oil prices are increasing investor fear. We're seeing a broad risk-off shift across institutional portfolios. Here's what you can expect, going forward. ...
READ MORE
MEMBERS ONLY

Stocks Wobble as Oil Spikes: What the Charts Are Telling Investors
by Jayanthi Gopalakrishnan,
Director of Site Content, StockCharts.com
The stock market turned volatile as oil prices surged. Here's what the charts are telling investors about the market's next move....
READ MORE
MEMBERS ONLY
Headlines Hit the Market But Buyers Keep Stepping In
by Tom Bowley,
Chief Market Strategist, EarningsBeats.com
The stock market has been rattled by geopolitical headlines, which have driven up crude oil prices. In this video, Tom Bowley shares his observations on what's happening beneath the surface....
READ MORE
MEMBERS ONLY
Has the Bull Run Its Course?

by Bruce Fraser,
Industry-leading "Wyckoffian"
Faced with an extended range-bound structure for QQQ, Bruce Fraser presents a PnF case study as he considers the progress of the bull market uptrend....
READ MORE