MEMBERS ONLY

BOND YIELDS PLUNGE TO NEW LOWS -- STOCK RALLY FADES ON CHINA TARIFF THREAT -- DOLLAR WEAKENS AS YEN AND GOLD REBOUND -- CRUDE OIL TUMBLES 7% -- FALLING YIELDS HURT FINANCIALS

by John Murphy,
Chief Technical Analyst, StockCharts.com
BOND YIELDS PLUNGE...A threat of new tariffs on China starting September 1 is contributing to this afternoon's plunge in bond yields. And lower stock prices. Chart 1 shows the 10-Year Treasury yield plunging 13 basis points to the lowest level since 2016. Even more surprising is a...
READ MORE
MEMBERS ONLY

A RISING DOLLAR LOWERS U.S. INFLATION BY PUSHING COMMODITY PRICES LOWER -- FALLING EUROPEAN CURRENCIES ARE PUSHING THE DOLLAR HIGHER -- FALLING BOND YIELDS IN THE UK AND EUROZONE ARE PULLING TREASURY YIELDS DOWN -- 10-YEAR BOND YIELD DROPS BELOW 2.00%
by John Murphy,
Chief Technical Analyst, StockCharts.com
A RISING DOLLAR IS KEEPING COMMODITY INFLATION DOWN...One of the reasons given by the Fed for lowering rates yesterday was to boost inflation. But the dollar hit the highest level in a year right after the rate cut. That's because foreign central bankers in Asia and Europe...
READ MORE
MEMBERS ONLY

STOCKS SELL OFF AFTER QUARTER POINT RATE CUT -- DOLLAR INDEX HITS NEW HIGH FOR THE YEAR WHICH PUSHED GOLD LOWER -- A RISING DOLLAR MAKES IT HARDER FOR THE FED TO BOOST INFLATION
by John Murphy,
Chief Technical Analyst, StockCharts.com
STOCKS WEAKEN...Stocks sold off on today's Fed accouncement. Or, more accurately, during the press conference afterwards based on some confusing responses from Jerome Powell regarding the reasons for today's rate cut, or whether more cuts are coming. The first three charts show three major stock...
READ MORE
MEMBERS ONLY

Tricky Dollar Is Still In A Bull Market

by Martin Pring,
President, Pring Research
* Defining a Bull or Bear Market Using a Two-Way Test
* Applying the Test to the Dollar
* The Euro and the Pound
Defining a Bull or Bear Market Using a Two-Way Test
Technical Analysis is an art form, one in which we put together several reasonably reliable indicators and form a...
READ MORE
MEMBERS ONLY

NASDAQ AND S&P 500 HIT NEW RECORDS -- SMALLER STOCKS AND TRANSPORTS HAVE A STRONG WEEK -- COMMUNICATIONS WERE WEEK'S TOP SECTOR -- BANKS LED FINANCIALS HIGHER -- KBW BANK INDEX MAY BE NEARING UPSIDE BREAKOUT -- EURO AND BRITISH POUND TOUCH TWO-YEAR LOWS
by John Murphy,
Chief Technical Analyst, StockCharts.com
NASDAQ AND S&P 500 HIT NEW RECORDS... SMALLER STOCKS AND TRANSPORTS STRENGTHEN... Stocks ended the week on a strong note. Charts 1 and 2 show the Nasdaq Composite Index and the S&P 500 closing at record highs on Friday. A report showing 2.1% GDP growth...
READ MORE
MEMBERS ONLY

THE MSCI ALL-WORLD STOCK INDEX IS TESTING ITS EARLY 2018 HIGH -- ITS FOREIGN STOCK INDEX IS LAGGING WAY BEHIND -- AND IS TESTING RESISTANCE OF ITS OWN -- GLOBAL CENTRAL BANKERS ARE IN A NEW RACE TO PUSH HISTORICALLY LOW RATES EVEN LOWER
by John Murphy,
Chief Technical Analyst, StockCharts.com
ALL COUNTRY WORLD INDEX TESTS PREVIOUS HIGH...Global stock indexes are once again testing overhead resistance barriers. The weekly bars in Chart 1 show the MSCI All Country World Index iShares (ACWI) in the process of testing its previous high set at the start of 2018 (see red circle). Any...
READ MORE
MEMBERS ONLY

UPS IS LEADING TRANSPORTS HIGHER TODAY -- SO ARE CH ROBINSON AND AMERICAN AIRLINES -- SMALL AND MIDSIZE STOCKS ARE ATTRACTING NEW BUYING -- SEMICONDUCTOR ISHARES HIT A NEW RECORD -- SO ARE TEXAS INSTRUMENTS AND LAM RESEARCH
by John Murphy,
Chief Technical Analyst, StockCharts.com
UPS GIVES BIG BOOST TO TRANSPORTS...The recent upturn in transportation stocks is starting to gain more traction. Chart 1 shows the Dow Transports rebounding nicely from last week's late selloff; that's helping to restore the bullish upturn that occurred at the start of last week....
READ MORE
MEMBERS ONLY

BANKS HAVE A STRONG DAY -- KBW BANK INDEX REACHES THREE MONTH HIGH -- REGIONAL BANK LEADERS ARE FIFTH THIRD, KEYCORP, AND REGIONS FINANCIAL -- JPM NEARS A NEW RECORD -- GOLDMAN SACHS RESUMES UPTREND -- BAC REACHES THREE MONTH HIGH
by John Murphy,
Chief Technical Analyst, StockCharts.com
BANK INDEX TURNS UP...Stocks are having another strong day, with sector leadership coming from materials (led by commodity chemicals) and industrials (with help from airlines). Semiconductors continue to lead technology higher. Financials are also having a strong day, led by banks. We're going to focus on banks...
READ MORE
MEMBERS ONLY
Is It Time For A Contra Trend Correction?
by Martin Pring,
President, Pring Research
* Major Trend Remains Positive
* Weekly Bar and Candle Charts Offer a Warning
* Reliable Short-Term Indicators, like Sentiment, are Overstretched
Major Trend Remains Positive
Each weekend, I go through a ChartList featuring weekly bar and candle charts of key markets. The idea is to spot technical events that appear on the...
READ MORE
MEMBERS ONLY

REGIONAL BANKS SHOW LEADERSHIP -- THAT INCLUDES BB&T, SUNTRUST, AND U.S. BANCORP -- CITIGROUP AND JP MORGAN CHASE MAY BE NEARING UPSIDE BREAKOUTS OF THEIR OWN -- GOLDMAN SACHS HAS HIT NEW HIGH FOR YEAR TO REVERSE PREVIOUS DOWNTREND
by John Murphy,
Chief Technical Analyst, StockCharts.com
BANKS HELP BOOST FINANCIALS...Financials are one of the day's strongest sectors. And banks are a big reason why. The daily bars in Chart 1 show the KBW Bank Index finding support above its 50- and 200-day moving averages; as well as a rising trendline drawn under its...
READ MORE
MEMBERS ONLY

CSX AND OTHER RAIL STOCKS PULL TRANSPORTS SHARPLY LOWER -- THAT'S MAKING INDUSTRIALS THE DAY'S WEAKEST SECTOR -- FALLING PRICE OF OIL WEAKENS ENERGY STOCKS -- GOLD MINING ETF RESUMES UPTREND WITH THE COMMODITY NOT FAR BEHIND
by John Murphy,
Chief Technical Analyst, StockCharts.com
TRANSPORTS HAVING A VERY BAD DAY... Just a day after reaching a new two-month high, transportation stocks are the day's weakest group. The daily bars in Chart 1 show the Dow Jones Transportation Average falling more than 3% today. And it's being led lower mainly by...
READ MORE
MEMBERS ONLY

Bond Yields May Not Be Headed Lower After All
by Martin Pring,
President, Pring Research
* Money Market Yields Continue to Look Vulnerable
* The 5-Year Yield is in a Secular Uptrend
* Longer-Dated Maturities Overstretched on the Downside
Money Market Yields Continue to Look Vulnerable
Everybody and their dog thinks that short-term rates will be cut by the Fed later this month. Count me in with the...
READ MORE
MEMBERS ONLY

STOCK INDEXES END WEEK AT RECORD HIGHS -- SECTOR RECORDS WERE SET BY CONSUMER DISCRETIONARY AND TECHNOLOGY -- INDUSTRIALS MAY BE GETTING CLOSE TO A RECORD AS WELL -- TRANSPORTATION STOCKS END ON A STRONG NOTE -- FINANCIALS HIT NEW HIGH FOR THE YEAR
by John Murphy,
Chief Technical Analyst, StockCharts.com
U.S. STOCK INDEXES SET NEW RECORDS...The three major U.S. stock indexes ended the week in record territory. A number of sectors hit records as well, or are getting close to doing so. Consumer discretionary and technology SPDRs hit new records. Financials hit a new high for the...
READ MORE
MEMBERS ONLY

GOLD IS THE WORLD'S STRONGEST CURRENCY -- GOLD HAS HIT A SIX-YEAR HIGH QUOTED IN DOLLARS -- AND IS HITTING MULTI-YEAR HIGHS WHEN QUOTED IN MAJOR FOREIGN CURRENCIES AS WELL
by John Murphy,
Chief Technical Analyst, StockCharts.com
GOLD IS DOING BETTER THAN THE WORLD'S MAJOR CURRENCIES... Gold is more than just a commodity. Gold is sometimes also viewed as an alternate currency. When global traders lose confidence in their currency, they often turn to gold as an alternative store of value. Since gold is quoted...
READ MORE
MEMBERS ONLY

RENEWED HOPE FOR JULY RATE CUT PUSHES STOCK INDEXES TO RECORD HIGHS -- TECHNOLOGY LEADS NASDAQ HIGHER -- UTILITIES HIT NEW HIGH WITH STAPLES AND REITS RIGHT BEHIND -- HOMEBUILDERS LEAD CYCLICALS TO NEW RECORD -- WEAK DOLLAR BOOSTS EMERGING MARKETS
by John Murphy,
Chief Technical Analyst, StockCharts.com
POWELL TESTIMONY MAKES JULY RATE CUT MORE LIKELY...Last Friday's strong jobs report raised concerns about a July rate cut later this month, which boosted interest rates and caused some profit-taking in stocks. Mr. Powell today put the July rate cut back on the table. Traders are now...
READ MORE
MEMBERS ONLY

Three Sectors And Five Industry Groups Poised To Move Higher
by Martin Pring,
President, Pring Research
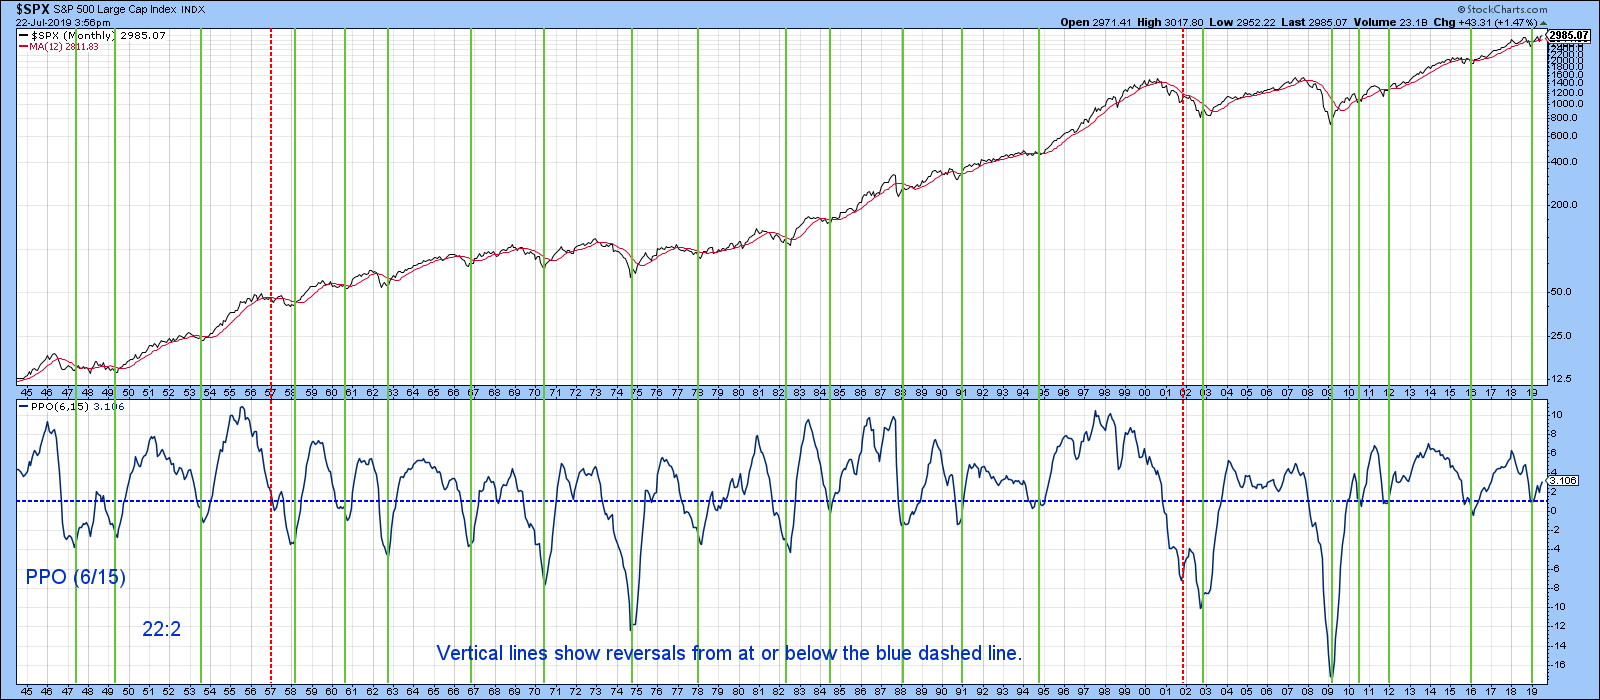
Market Tentatively Triggers a Long-Term Buy Signal
Chart 1 features a Coppock indicator for the NYSE Composite, which triggers buy signals by reversing to the upside from a position at or below the equilibrium level. Since 1970, there have been thirteen such signals and only one failure (in 2002). That&...
READ MORE
MEMBERS ONLY

Martin Pring's Monthly Market Roundup 2019-07-03
by Martin Pring,
President, Pring Research
The monthly Market Roundup video for July is now available.
Good luck and good charting, Martin J. Pring
The views expressed in this article are those of the author and do not necessarily reflect the position or opinion of Pring Turner Capital Group of Walnut Creek or its affiliates....
READ MORE
MEMBERS ONLY

STRONG JOBS REPORT SENDS BOND YIELDS HIGHER ON DIMINISHED HOPE FOR JULY RATE CUT -- DIVIDEND-PAYING STOCKS ARE LEADING TODAY'S MARKET RETREAT -- RISING YIELDS ARE BOOSTING BANKS AND FINANCIALS -- A STRONGER DOLLAR IS CAUSING PROFIT-TAKING IN GOLD
by John Murphy,
Chief Technical Analyst, StockCharts.com
STRONGER THAN EXPECTED JOBS REPORT BOOSTS YIELDS...A increase of 224,000 jobs in June was much higher than expected, and may have diminished hopes for a July rate cut. That can be seen by rising bond yields today. The 10-Year Treasury yield is rising 11 basis points to 2....
READ MORE
MEMBERS ONLY

DOW AND S&P 500 ARE POISED TO CLOSE AT RECORD HIGHS -- DROP IN BOND YIELDS CONTINUES TO SUPPORT DIVIDEND-PAYING STOCKS -- CONSUMER CYCLICALS ARE TRADING AT RECORD HIGHS TODAY -- BUT STAPLES HAVE DONE BETTER THAN CYCLICALS SINCE LATE APRIL
by John Murphy,
Chief Technical Analyst, StockCharts.com
S&P 500 SETS NEW RECORD... DOW IS GETTING CLOSE...Stocks are trading higher again today in a shortened pre-holiday trading session. Chart 1 shows the S&P 500 trading well above its late-April high and trading in new record territory again today. The SPX is trading well...
READ MORE
MEMBERS ONLY

Are Commodities About To Turn Up?
by Martin Pring,
President, Pring Research
* CRB Still Caught in a Trading Range
* Commodity/Bond Ratio Holding On By its Teeth
* Watch the Canadian Dollar for Clues
CRB Still Caught in a Trading Range
Back in May, I wrote an article entitled “Commodities: Down Now, Up Later?" in which I pointed out some of the...
READ MORE
MEMBERS ONLY

TRANSPORTS AND SMALL CAP INDEXES CLEAR 200-DAY AVERAGES -- TODAY IS REBALANCING DAY FOR RUSSELL INDEXES -- FINANCIALS ARE THE DAY'S STRONGEST SECTOR AND MAY BE BOOSTING SMALL CAPS -- BIG BANKS PASS ANNUAL STRESS TEST AND ARE LEADING XLF HIGHER
by John Murphy,
Chief Technical Analyst, StockCharts.com
TRANSPORTS CLEAR 200-DAY AVERAGE...Two market groups that have been market laggards all year are suddenly attracting new buying. I'm referring to small cap stocks and transports. Chart 1 shows the Dow Jones Transportation Average ending the week above its 200-day moving average. It's also one...
READ MORE
MEMBERS ONLY

JUNE SECTOR ROTATIONS SHOW MORE CONFIDENCE -- DEFENSIVE SECTORS FALL BEHIND -- WHILE TECHNOLOGY, CYCLICALS, AND INDUSTRIALS TAKE THE LEAD -- SEMICONDUCTORS LEAD TECH HIGHER -- CHIP STOCKS ARE TRACKING THE CHINESE STOCK MARKET VERY CLOSELY
by John Murphy,
Chief Technical Analyst, StockCharts.com
DEFENSIVE SECTORS FALL BEHIND... Previous messages have pointed out that defensive stock sectors were top performers since the market hit a peak at the end of April when trade tensions started to resurface. Stocks, however, have recovered most of their May losses during the month of June. And sector leadership...
READ MORE
MEMBERS ONLY

SMALL CAPS HAVE BEEN WEAKER THAN LARGE CAPS THIS YEAR -- A WEAKER DOLLAR MAY BE A REASON -- FALLING RATES ARE MORE LIKELY -- FINANCIALS ARE BIGGEST SMALL CAP SECTOR -- PREFERENCE FOR LARGE DIVIDEND-PAYING STOCKS MAY ALSO BE HURTING SMALL CAPS
by John Murphy,
Chief Technical Analyst, StockCharts.com
SMALL CAPS CONTINUE TO UNDERPERFORM...Small cap stocks have been lagging behind larger stocks for most of this year. And in a big way. The black bars in Chart 1 show the Russell 2000 Small Cap Index (RUT) lagging behind the S&P 500 Large Cap Index (gray area)...
READ MORE
MEMBERS ONLY

Four Reasons Why The Gold Breakout Is Likely To Be Valid
by Martin Pring,
President, Pring Research
* A Weaker Dollar is Bullish for Gold
* The Gold 6/15 PPO Model for Gold is Bullish
* Global Gold is Breaking Out
* Gold Shares Showing Signs of Strength
* Gold Special K Crossed its Bear Market Trend Line
Last week, Gold experienced an upside breakout from a multi-year base. I always...
READ MORE
MEMBERS ONLY

FALLING FOREIGN BOND YIELDS ARE PULLING TREASURY YIELDS LOWER -- GLOBAL STOCK INDEXES HAVE A STRONG WEEK AND NEAR UPSIDE BREAKOUTS -- FALLING YIELDS AND A WEAKER DOLLAR PUSH GOLD TO SIX-YEAR HIGH -- GOLD MINERS ALSO HAD A BREAKOUT WEEK
by John Murphy,
Chief Technical Analyst, StockCharts.com
NEGATIVE FOREIGN YIELDS LEAD TREASURY YIELDS LOWER...Bond yields are dropping all over the world. The British 10-Year yield fell this week to the lowest level since 2016 (0.80%). The Japanese yield remains in negative territory. Nearly a quarter of bond yields in global developed markets are already negative...
READ MORE
MEMBERS ONLY

FED LEAVES RATES UNCHANGED BUT SETS STAGE FOR JULY RATE CUT -- BOND AND STOCK PRICES GAIN -- BIG DROP IN BOND YIELDS WEAKENS BANK STOCKS -- WEAK DOLLAR PUSHES GOLD TO NEW HIGH FOR THE YEAR -- HEALTHCARE SPDR ACHIEVES BULLISH BREAKOUT
by John Murphy,
Chief Technical Analyst, StockCharts.com
STOCKS GAIN ON EXPECTED RATE CUT... The Fed left rates unchanged today, but dropped the word "patient" from its statement, and gave the strong impression that a rate cut is likely. Fed fund futures are betting on a rate cut in July. That sent bond and stock prices...
READ MORE
MEMBERS ONLY

REGIONAL BANK LEADERS INCLUDE SUNTRUST, CITIZENS FINANCIAL, AND BB&T -- ALL THREE APPEAR TO BE FORMING SYMMETRICAL TRIANGLES
by John Murphy,
Chief Technical Analyst, StockCharts.com
TRIANGLES ON DISPLAY...Today's earlier message showed the S&P Bank SPDR (KBE) trying to rise above its 200-day moving average. It also mentioned that regional banks were leading today's bank rebound. While drilling down through some regional bank charts, I noticed that many of...
READ MORE
MEMBERS ONLY

HEALTHCARE SPDR NEARS UPSIDE BREAKOUT -- DRUG STOCKS ARE ALSO BREAKING OUT -- BANKS RALLY ON FED DAY
by John Murphy,
Chief Technical Analyst, StockCharts.com
HEALTHCARE SPDR NEARS UPSIDE BREAKOUT...Money has been flowing into healthcare stocks since the end of April. And the sector may be on the verge of a bullish breakout. The daily bars in Chart 1 show the Health Care SPDR (XLV) testing its early March intra-day peak at 93.10....
READ MORE
MEMBERS ONLY

S&P Composite Continues To Lead The World Higher As More Short-Term Indicators Go Bullish
by Martin Pring,
President, Pring Research
* US Breaking Out Against the World
* The World Itself Looks to be in Pretty Good Technical Shape
* NYSE A/D and Upside/Downside Lines at Record Levels
* More Short-Term US Market Indicators Turn Bullish
* Multiple Momentum Trend Line Breaks is Very Positive
* There Is Always Something to Worry About
US...
READ MORE
MEMBERS ONLY

MONTHLY SECTOR RANKINGS SHOW DEFENSIVE LEADERSHIP THAT INCLUDES UTILITIES, HEALTH CARE, REAL ESTATE, AND CONSUMER STAPLES -- GOLD MINERS LED MATERIALS HIGHER -- HOMEBUILDERS ARE LEADING CONSUMER DISCRETIONARY SECTOR HIGHER TODAY
by John Murphy,
Chief Technical Analyst, StockCharts.com
MONTHLY PERFORMANCE SHOWS DEFENSIVE LEADERSHIP...Chart 1 is taken from the Sector Summary page for the past month. And it shows that investors are still gravitating toward defensive issues. Four of the top sectors are utilities, health care, real estate, and consumer staples. All four are defensive in nature. Even...
READ MORE
MEMBERS ONLY

GOLD SHARES ARE RISING WITH THE METAL -- AND ARE NEARING A TEST OF 2019 HIGHS -- THE FACT THAT GOLD MINERS ARE RISING FASTER THAN BULLION IS ANOTHER POSITIVE SIGN
by John Murphy,
Chief Technical Analyst, StockCharts.com
GOLD MINERS ETF NEARS TEST OF 2019 HIGH...Yesterday's message wrote about the price of gold being in the late stages of a potential bottoming formation. It also suggested that three intermarket forces were working in gold's favor. They include a weaker dollar, falling interest rates,...
READ MORE
MEMBERS ONLY

INTERMARKET TRENDS ARE STARTING TO FAVOR GOLD -- A WEAKER DOLLAR IS ONE OF THEM -- AND FALLING INTEREST RATES -- GOLD HAS DONE BETTER OVER THE LAST YEAR WHEN STOCKS HAVE WEAKENED -- GOLD IS TESTING MAJOR OVERHEAD RESISTANCE
by John Murphy,
Chief Technical Analyst, StockCharts.com
A WEAKER DOLLAR INCREASES APPEAL OF GOLD... The brown monthly bars in Chart 1 show the price of gold forming a potential bottoming formation that started nearly four years ago when it hit bottom in late 2015. Since then, the price of bullion has traded between that low and a...
READ MORE
MEMBERS ONLY

THE McCLELLAN OSCILLATOR TURNED POSITIVE THIS WEEK -- THAT'S BOOSTING THE McCLELLAN SUMMATION INDEX AND KEEPING ITS 2019 UPTREND INTACT -- BOTH ARE MEASURES OF MARKET BREADTH
by John Murphy,
Chief Technical Analyst, StockCharts.com
BOTH McCLELLAN BREATH INDICATORS TURN UP... Chart 1 includes two breadth indicators that work together. Both are compared to the NYSE Composite Index (upper box). The dashed line in the lower part of the chart plots the McClellan Summation Index. That's a long term measure of market breadth....
READ MORE
MEMBERS ONLY

STOCKS START THE WEEK ON A STRONG NOTE
by John Murphy,
Chief Technical Analyst, StockCharts.com
STOCK INDEXES CLEAR 50-DAY AVERAGES... Stocks are starting the week on a strong note. Charts 1 and 2 show the Dow and S&P 500 trading above their 50-day averages. The Dow has also cleared initial resistance at 26,000. Chart 2 shows the SPX also exceeding overhead resistance...
READ MORE
MEMBERS ONLY

Seven Reasons For Being Bullish
by Martin Pring,
President, Pring Research
* Financial Velocity Indicator Poised to Go Bullish
* Oversold NASDAQ Volume in a Position to Support a Rally
* Rapid Expansion of Net New Highs is Bullish
* Global Breadth Turning?
* When Stock Exchanges Break to the Upside, That’s Usually Bullish for Stocks
Financial Velocity Indicator Poised to Go Bullish
One of...
READ MORE
MEMBERS ONLY

DOW ENDS WEEK ON A STRONG NOTE -- TECHNOLOGY LEADS FRIDAY RALLY
by John Murphy,
Chief Technical Analyst, StockCharts.com
DOW ENDS WEEKLY LOSING STREAK The Dow Industrials gained 263 points today (1.02%) to end the week on a strong note. That also ends a six-week losing streak for the blue chip index. Chart 1 shows the Dow regaining its 200-day average on Wednesday, and ending the week right...
READ MORE
MEMBERS ONLY

10-YEAR TREASURY YIELD HEADED TOWARD TEST OF 2017 LOW -- THAT'S HELPING PUSH DIVIDEND PAYING STOCK SECTORS INTO RECORD TERRITORY -- BUT IS CAUSING BANKS TO LAG BEHIND
by John Murphy,
Chief Technical Analyst, StockCharts.com
10-YEAR TREASURY YIELD NEARS TEST OF 2017 LOW... The 10-Year Treasury yield is falling another 6 basis points today to 2.06% which is drawing dangerously close to its 2017 low. The weekly bars in Chart 2 show that year's intra-day yield low at 2.03%. Its lowest...
READ MORE
MEMBERS ONLY

PHARMACEUTIALS LEAD HEALTH CARE SPDR TO POSSIBLE UPSIDE BREAKOUT -- DRUG LEADERS ARE ABBOTT LABS, MERCK, AND PFIZER -- MEDICAL EQUIPMENT STOCKS ALSO LOOK STRONG -- THAT INCLUDES BOSTON SCIENTIFIC, MEDTRONIC, AND THERMO FISHER SCIENTIFIC
by John Murphy,
Chief Technical Analyst, StockCharts.com
HEALTHCARE SPDR MAY BE TURNING UP ... The health care sector may be nearing an upside breakout. The daily bars in Chart 1 shows the Health Care SPDR (XLV) trading above its 200-day average in today's trading; and testing its late May intra-day peak at 90.18. A close...
READ MORE
MEMBERS ONLY
Martin Pring's Monthly Market Roundup 2019-06-03
by Martin Pring,
President, Pring Research
The monthly Market Roundup video for June is now available.
Good luck and good charting,
Martin J. Pring
The views expressed in this article are those of the author and do not necessarily reflect the position or opinion of Pring Turner Capital Group of Walnut Creek or its affiliates....
READ MORE
MEMBERS ONLY

Can They Pull The Trigger On Gold And The Yen?
by Martin Pring,
President, Pring Research
* Long-Term Picture Shows Gold Close to a Breakout
* The Shares Are on the Cusp As Well
* Short-Term Indicators for Gold Go Bullish
* Yen Emerging From a Breakout
I like to use an indicator that I call “Risk On Risk Off,” which combines an index comprising several risky entities with another...
READ MORE