MEMBERS ONLY
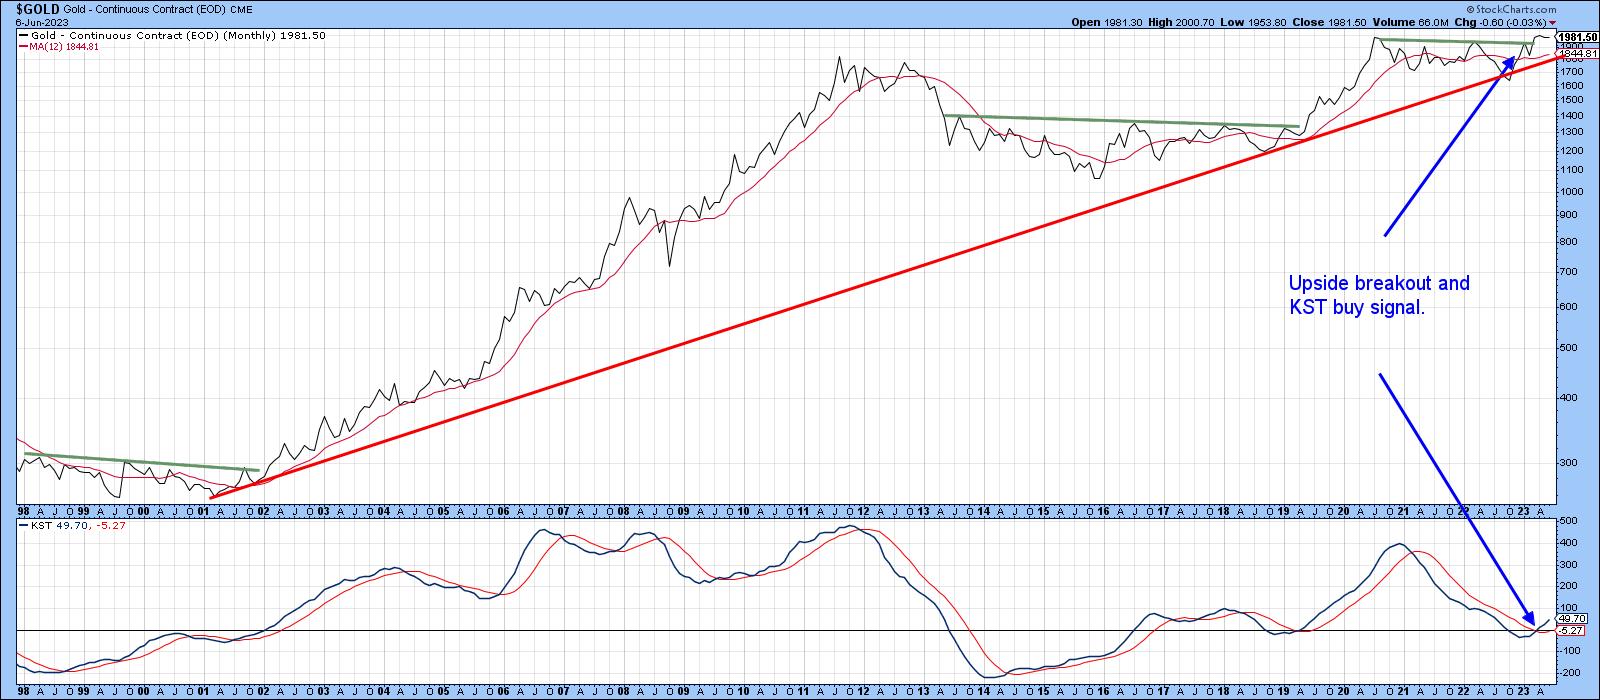
Is Gold About to Explode or Crash?

by Martin Pring,
President, Pring Research
The price of gold was recently trading at an all-time monthly closing high. Since then, it has backed off, raising the question of whether that was "the" top or whether the subsequent short-term price decline represents a healthy digestion of previous price gains, which will serve as a...
READ MORE
MEMBERS ONLY

Market Correction is Coming

by Larry Williams,
Veteran Investor and Author
"The farther backward you can look, the farther forward you can see." - Winston Churchill
In this exclusive StockCharts TV special, Larry is back to talk about a stock market correction ahead. There have not been any long term selling opportunities recently. However, right here & now, Larry...
READ MORE
MEMBERS ONLY

MARKET RALLY BROADENS OUT -- DOW LEADS FRIDAY RALLY -- CYCLICALS HAVE A STRONG WEEK

by John Murphy,
Chief Technical Analyst, StockCharts.com
DOW PLAYS CATCH-UP... A strong May jobs report and the passing of the debt ceiling bill have combined to give a big boost to stocks at week's end. The rally has been enough to push the Nasdaq to a new 52-week high and a ten-month high in the...
READ MORE
MEMBERS ONLY
Perhaps It's Time for the Laggards to Catch Up?
by Martin Pring,
President, Pring Research
The recent strong performance by a few tech stocks has gained widespread attention, as has the disappointing market breadth. The result has been a soaring NASDAQ and a lagging NYSE Composite and Dow. Small cap stocks have also left a lot to be desired. The question is whether this divergence,...
READ MORE
MEMBERS ONLY

CHIP STOCKS LEAD MARKET HIGHER -- SPX STILL LAGS BEHIND -- AUTOS HAVE A STRONG WEEK
by John Murphy,
Chief Technical Analyst, StockCharts.com
TALE OF TWO MARKETS... Previous messages have pointed out the growing gap between rising technology stocks and the rest of the market. That gap widened even further this week. Technology was once again the week's strongest sector thanks to surging chip stocks. The weekly bars in Chart 1...
READ MORE
MEMBERS ONLY

TECH STOCKS CONTINUE TO LEAD MARKET HIGHER -- MOST OTHER SECTORS, HOWEVER, CONTINUE TO LAG BEHIND THE S&P 500 FOR THE YEAR
by John Murphy,
Chief Technical Analyst, StockCharts.com
BIG TECH STOCKS LEAD MARKET HIGHER... The largest stocks in the technology sector saw big gains during the week. That pushed the Invesco QQQ Trust to the highest level in more than a year as shown by the weekly bars in Chart 1. Technology and Communication Services SPDRS were the...
READ MORE
MEMBERS ONLY
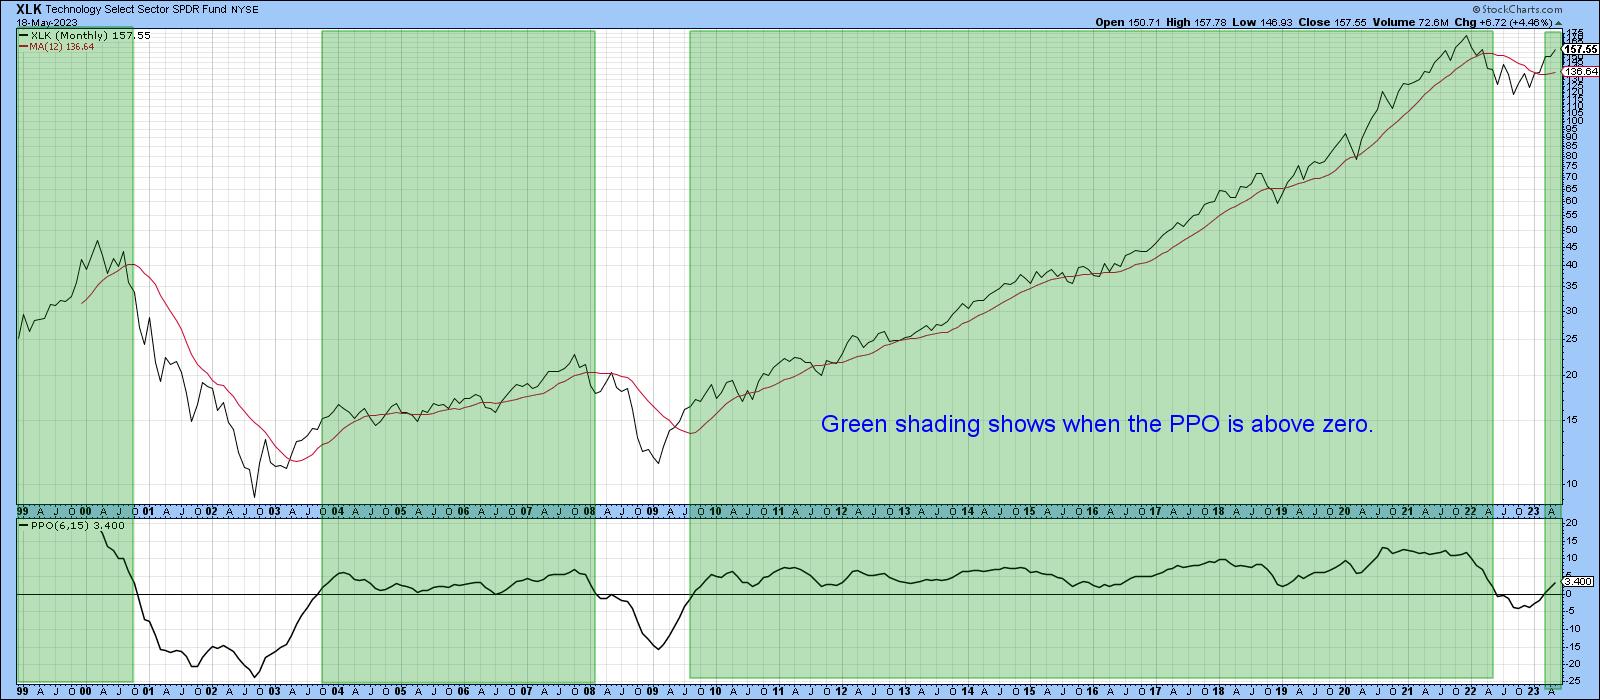
Does this Technology Rally Have Legs?
by Martin Pring,
President, Pring Research
In the last couple of months, we have seen a number of analysts and commentators point out that the current rally has been led by a handful of large-cap tech stocks and is therefore suspect. That observation suggests this week's extension to the advance is doomed. It'...
READ MORE
MEMBERS ONLY
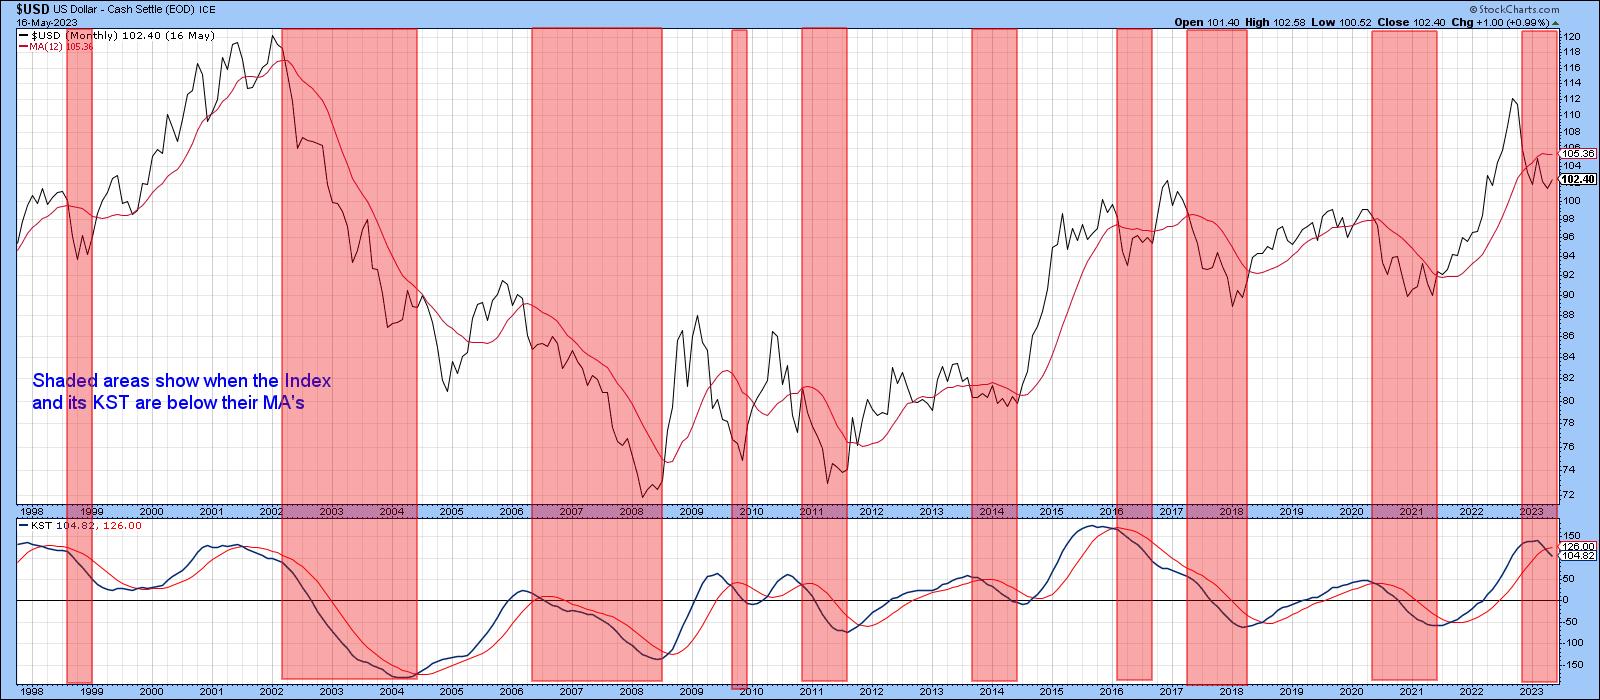
The Long-term Trend of the US Dollar May Not Be as Bearish as You Think
by Martin Pring,
President, Pring Research
There has been a lot of talk recently about diversifying away from the dollar and it potentially losing its reserve status. The primary trend of the Dollar Index may be bearish, but the longer-term charts do not agree; they suggest that the dollar's death is greatly exaggerated. Let&...
READ MORE
MEMBERS ONLY

MARKET BREADTH REMAINS WEAK -- FINANCIALS AND MATERIALS LEAD DECLINE -- WEAK COPPER AND REGIONAL BANKS WEIGH ON MARKET
by John Murphy,
Chief Technical Analyst, StockCharts.com
BAD BREADTH CONTINUES... Several recent messages have demonstrated poor stock market breadth. Unfortunately, that negative situation hasn't shown any improvement. One of the charts used to demonstrate that negative situation is repeated below. Chart 1 compares the S&P 500 Large Cap Index (black bars) to the...
READ MORE
MEMBERS ONLY
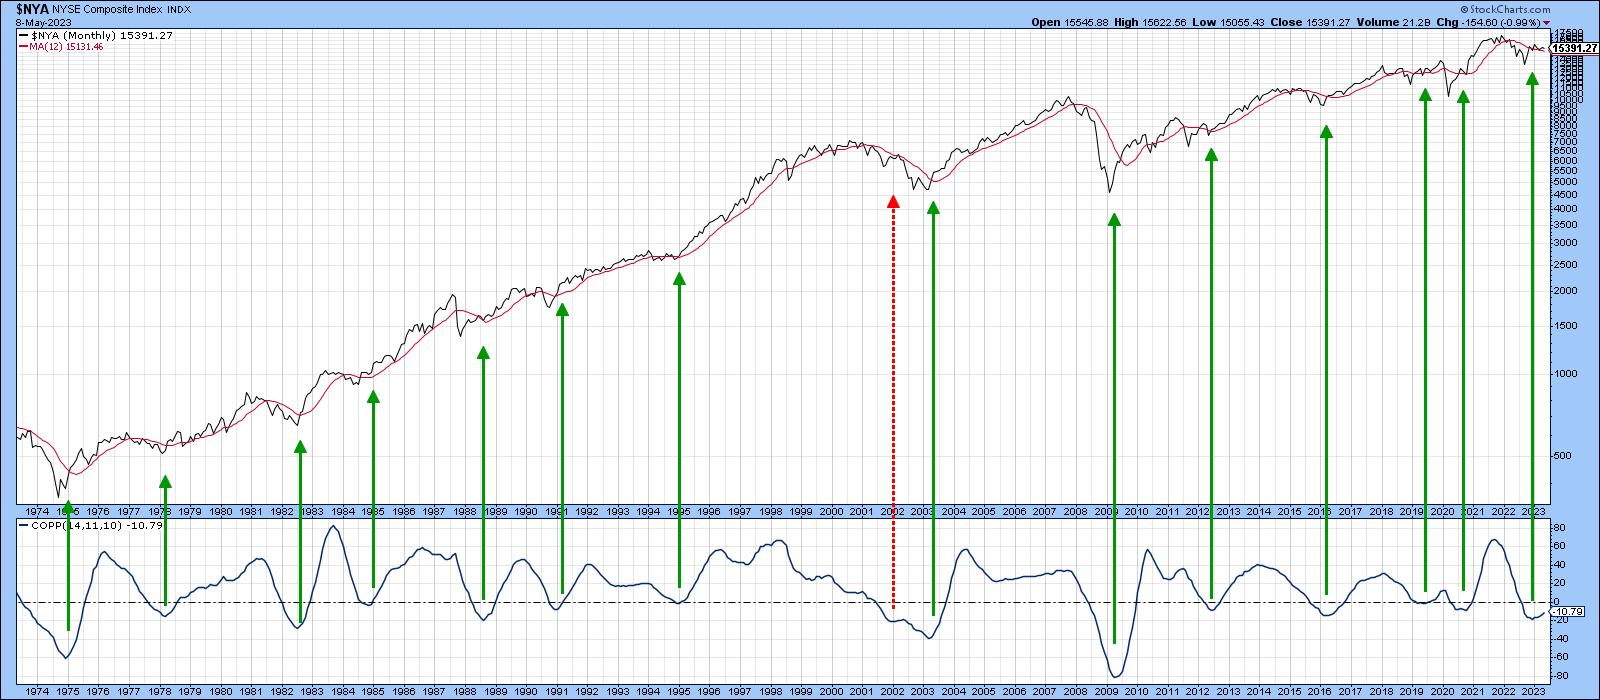
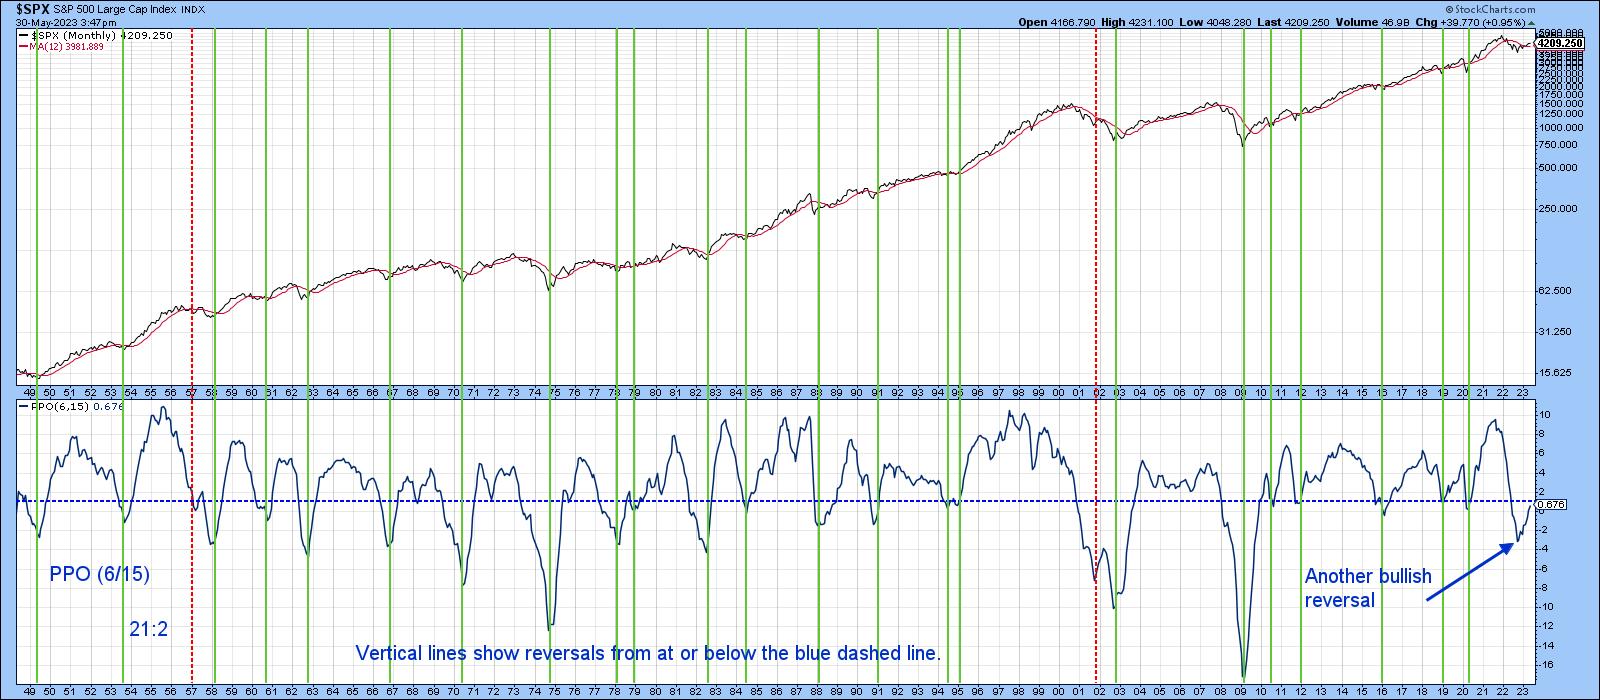
Could We See a Buy Signal for Stocks and Bonds Similar to 1982?
by Martin Pring,
President, Pring Research
The other day, I was looking at the charts of stocks, bonds, and gold and remembered that the lows of 1982 were preceded by a similar setup to what we see today. History rarely repeats exactly, and there are many differences between now and then. Still, I think it'...
READ MORE
MEMBERS ONLY

FALLING BOND YIELDS HAVE BEEN GOOD FOR THE NASDAQ AND GOLD -- BUT BAD FOR CRUDE OIL
by John Murphy,
Chief Technical Analyst, StockCharts.com
BONDS YIELDS VS. THE NASDAQ...The direction of bond yields has had an impact on various intermarket relationships. One of the them is the Nasdaq market. The main point of Chart 1 is to show that falling bond yields have been good for the Nasdaq market so far this year....
READ MORE
MEMBERS ONLY
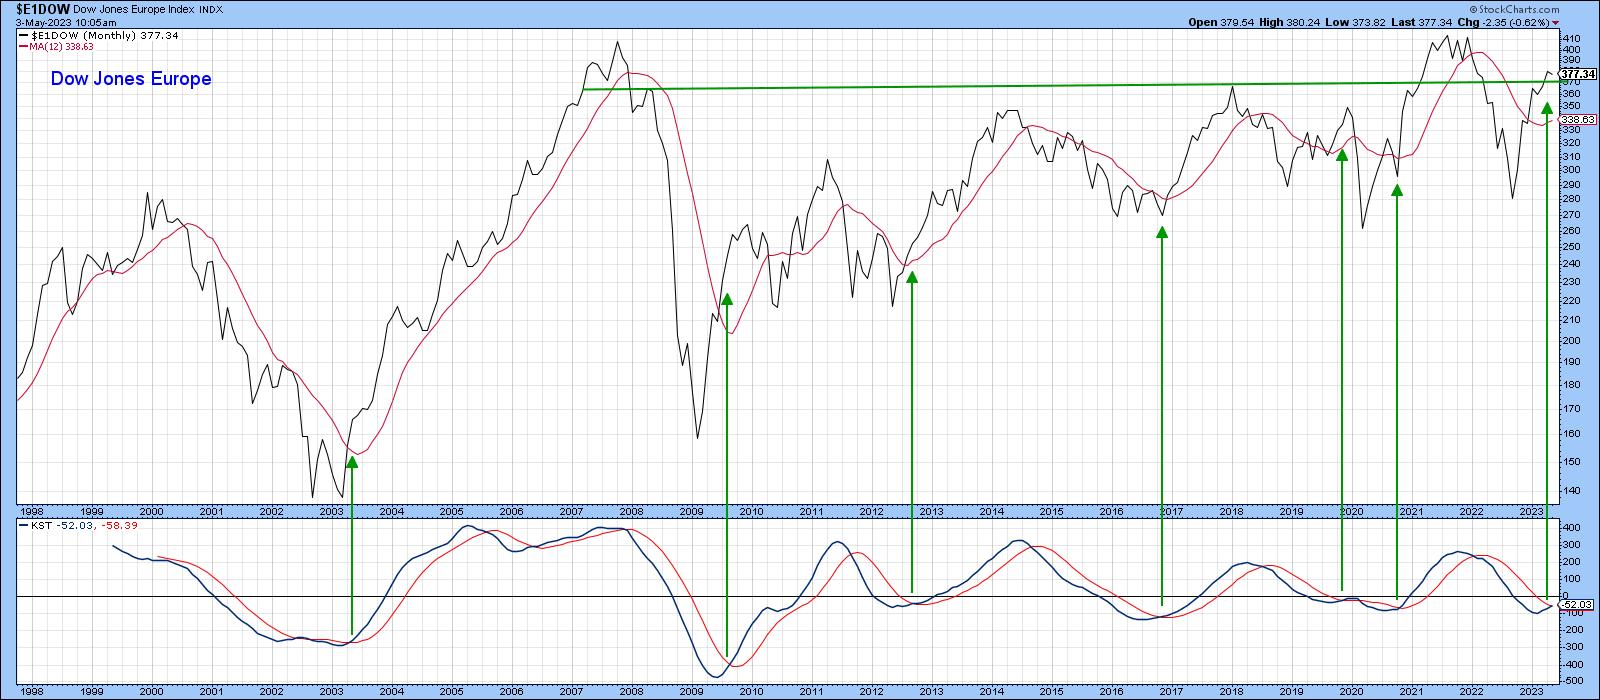
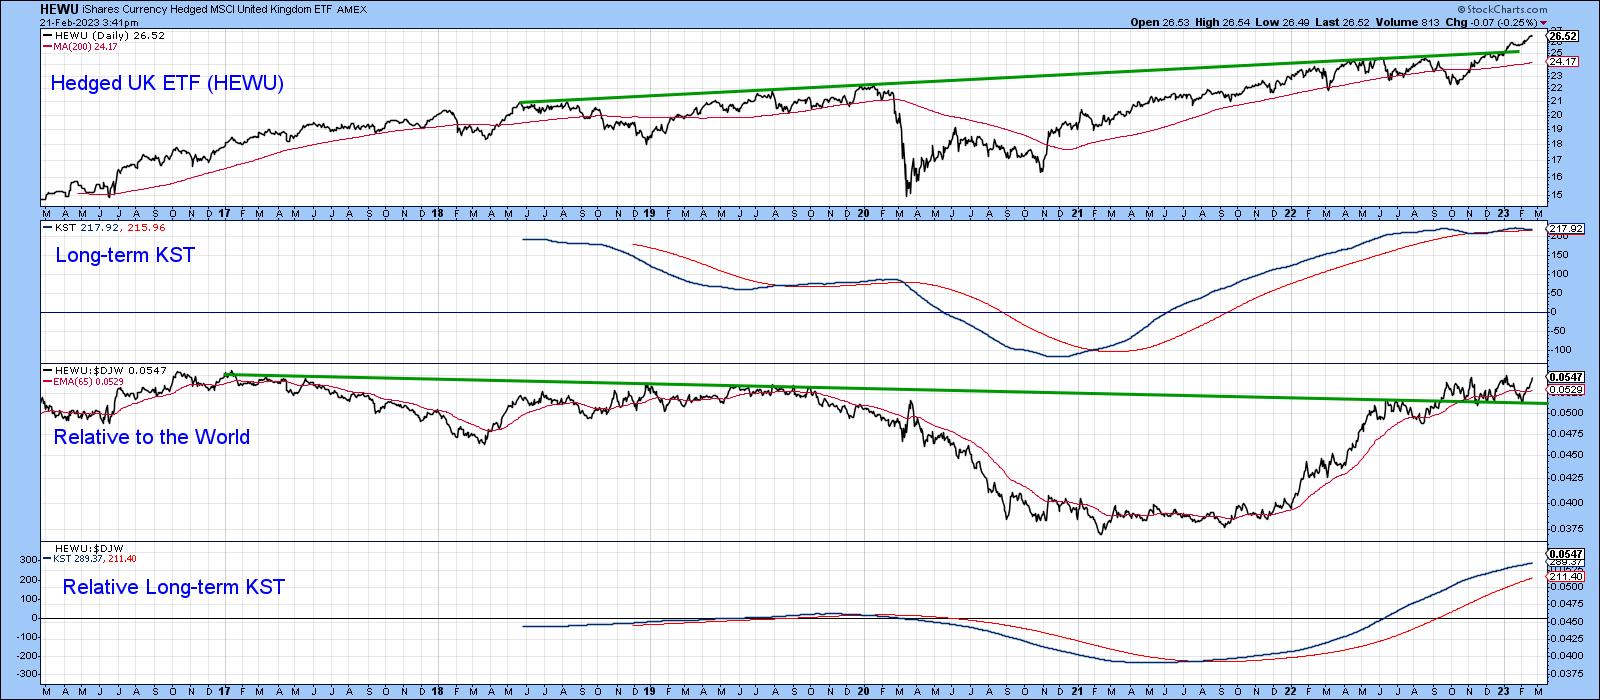
Europe and Japan to the Rescue?
by Martin Pring,
President, Pring Research
Most of the time, when looking at equity markets outside of the US, I focus on the various country ETFs, which are denominated in dollars rather than local currencies. In some ways, this limits my perspective, since currency fluctuations can change some of the outcomes--especially in countries experiencing a high...
READ MORE
MEMBERS ONLY

TRANSPORTATION STOCKS LAG BEHIND INDUSTRIALS
by John Murphy,
Chief Technical Analyst, StockCharts.com
MARKET ENDS WEEK ON A STRONG NOTE... Stocks gained more ground this past week with major indexes moving closer to overhead resistance levels. The market is being led higher by communication and technology stocks. As a result, the Nasdaq 100 touched a new high for the year and is leading...
READ MORE
MEMBERS ONLY
Three Charts I Am Watching Closely for a Verdict
by Martin Pring,
President, Pring Research
Charts have always fascinated me, so I plow through a lot of them in the course of a typical week. To me, breakouts hold a similar buzz as a striker scoring a great goal from the edge of the penalty box in soccer. To boot, I do not see any...
READ MORE
MEMBERS ONLY

BREADTH FIGURES CONTINUE TO SHOW NEGATIVE DIVERGENCES
by John Murphy,
Chief Technical Analyst, StockCharts.com
MORE NEGATIVE DIVERGENCES... My message from a couple of weeks ago showed various measures of market breadth failing to keep up with the S&P 500 which suggested that the current stock rally was on weak technical footing. Unfortunately, that situation hasn't improved. A number of breath...
READ MORE
MEMBERS ONLY
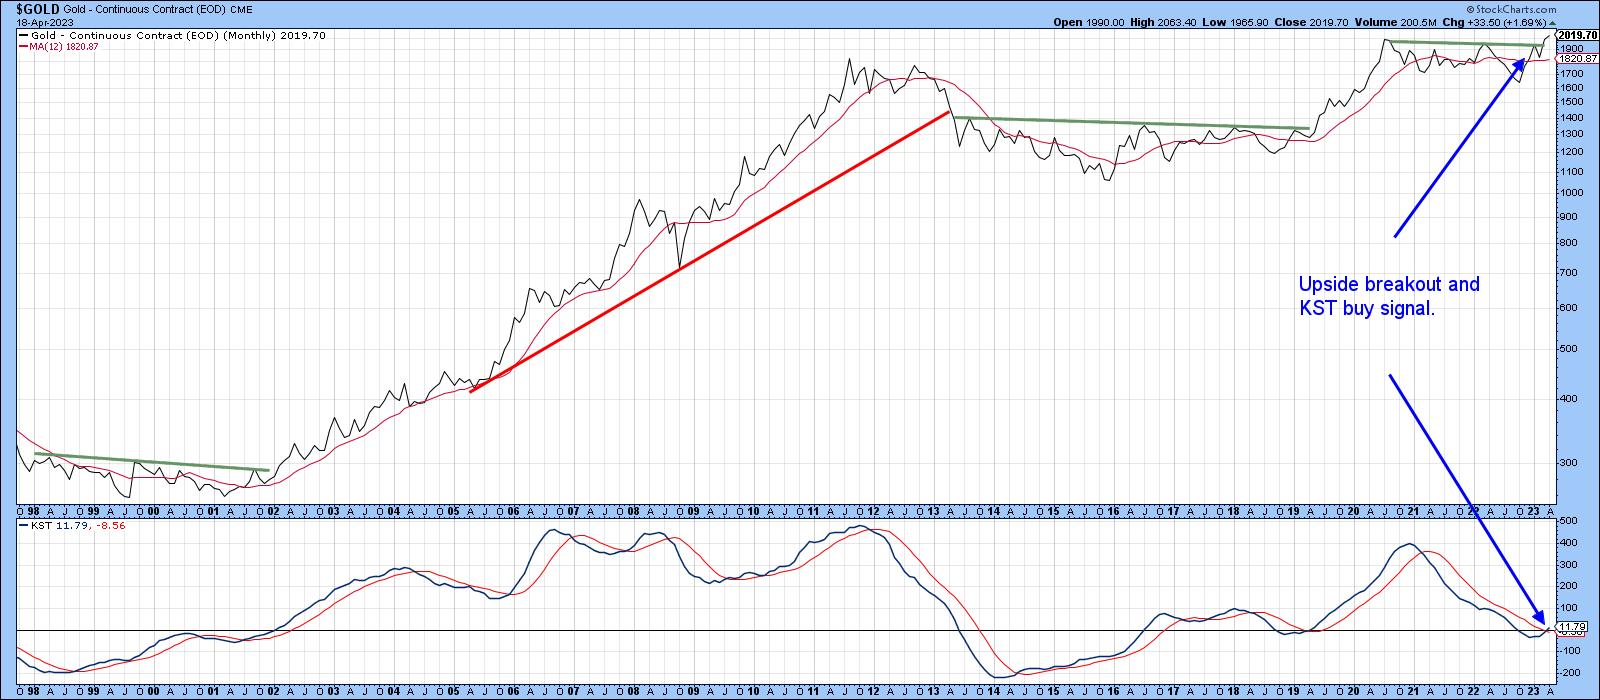
What Are the Implications of Last Month's Gold Breakout for Commodities?
by Martin Pring,
President, Pring Research
Chart 1 below shows that, on a monthly close basis, gold broke out from a large consolidation formation in March. It has built on that move in the first part of April by moving slightly higher. The implication is obviously for higher gold prices, once the overbought condition laid out...
READ MORE
MEMBERS ONLY

AN INTERMARKET LOOK AT GOLD
by John Murphy,
Chief Technical Analyst, StockCharts.com
GOLD RALLY STALLS AT OVERHEAD RESISTANCE... Gold has risen to the highest level in a year and has been attracting a lot of attention lately. Gold is traditionally viewed as a safe haven asset when investors are concerned about the state of the economy in an inflationary environment. The weekly...
READ MORE
MEMBERS ONLY
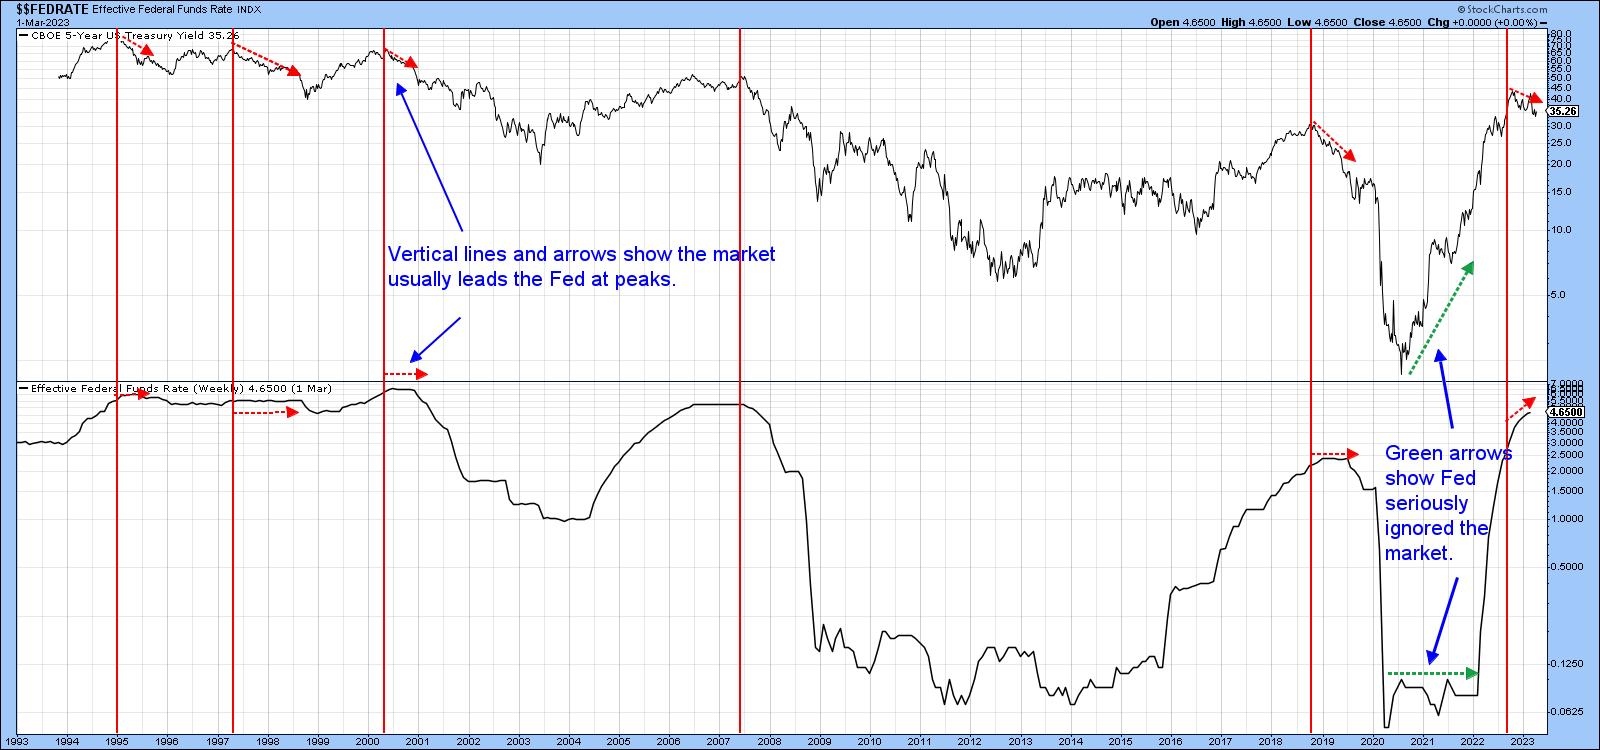
Mr. Powell, Tear Down These Interest Rates
by Martin Pring,
President, Pring Research
These are not my words, but those of Mr. Market, who is doing his best to let the central bank know that rates are too high. Chart 1, for instance, compares the market-driven 5-year yield to that of the Effective Federal Funds. The dashed green arrows indicate that, in 2021,...
READ MORE
MEMBERS ONLY

STOCKS END WEEK LITTLE CHANGED -- BUT MARKET BREADTH IS LAGGING BEHIND
by John Murphy,
Chief Technical Analyst, StockCharts.com
EQUAL WEIGHTED SPX LAGS BEHIND...Stocks were little changed on the shortened trading week and have maintained their intermediate uptrend. The black bars in Chart 1 show the S&P 500 having reached the highest level in two months. The SPX also remains above moving average lines and may...
READ MORE
MEMBERS ONLY
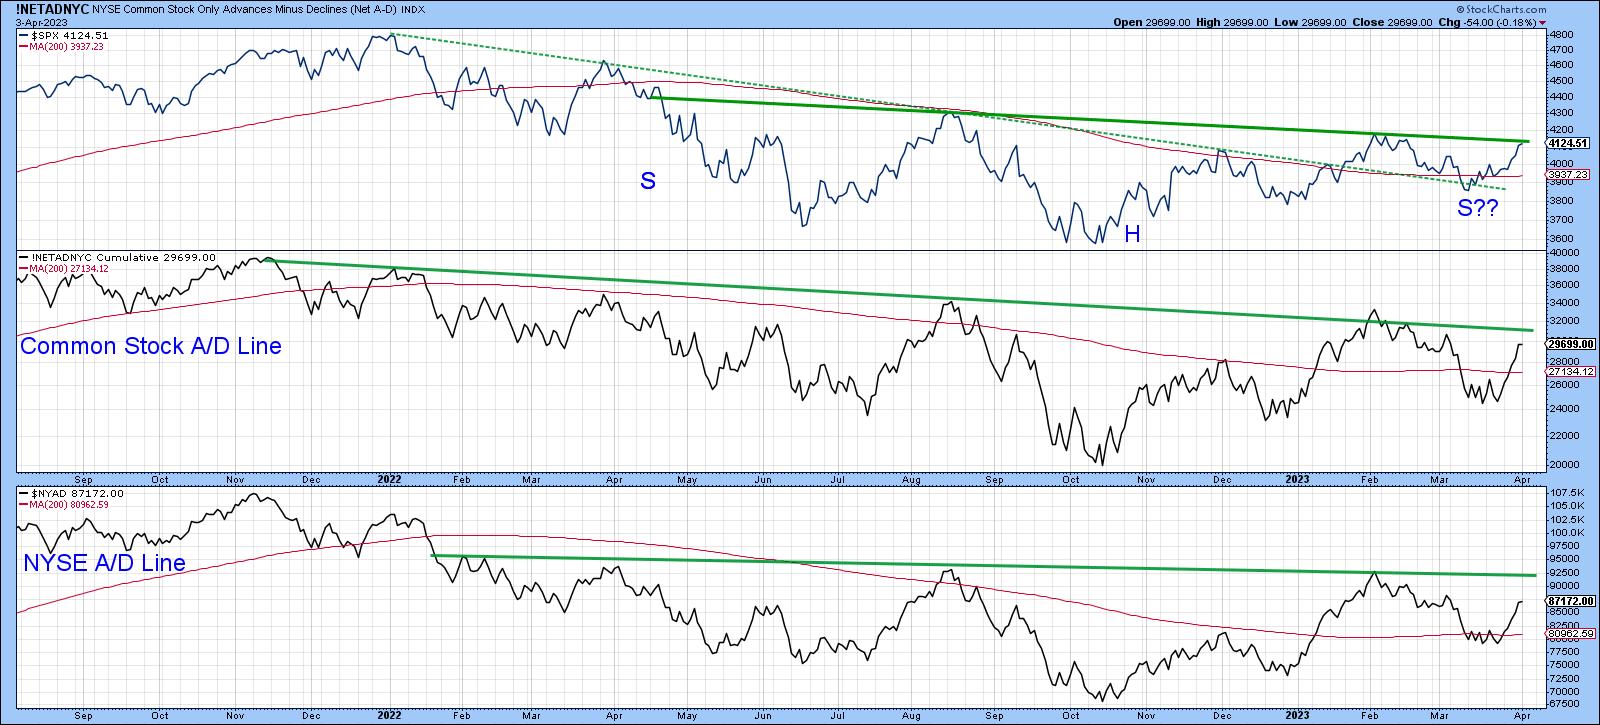
Market Faces Key Test
by Martin Pring,
President, Pring Research
Global equities have risen for the last three weeks and now are at or just below key chart points. Chart 1, for instance, shows that the S&P 500 index ($SPX) is close to breaking above resistance in the form of its 2022–23 down trendline. In reality, that...
READ MORE
MEMBERS ONLY

NASDAQ LEADS MARKET HIGHER --
by John Murphy,
Chief Technical Analyst, StockCharts.com
MAJOR STOCK INDEXES HAVE A STRONG WEEK...Although the stock market's long-term trend may still be in doubt, stocks are ending the quarter on a strong note. Starting with the weakest, Chart 1 shows the Dow Industrials ending the quarter back above its 200-day moving average and in...
READ MORE
MEMBERS ONLY
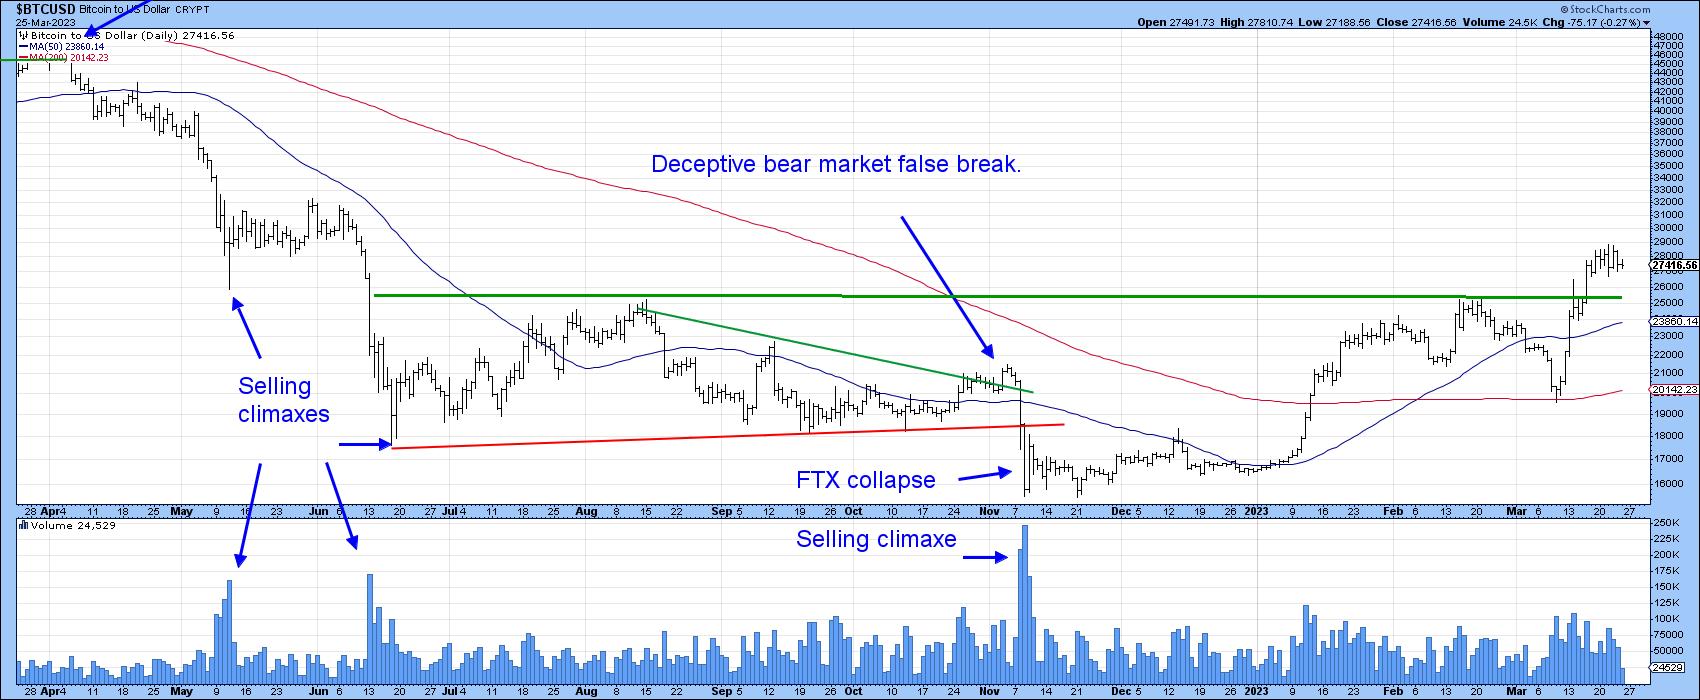
Don't Let a Good Banking Crisis Go to Waste
by Martin Pring,
President, Pring Research
Remember the wall-to-wall coverage concerning the FTX crypto collapse? It's a great example of why conventional wisdom and groupthink are usually wrong.
The prevailing hysteria had most traders brainwashed into expecting further crypto collapses and price drops. The simple fact is that, the market had been anticipating trouble...
READ MORE
MEMBERS ONLY

BANK WEAKNESS WEIGHS ON MARKET -- PLUNGE IN BOND YIELDS SHOWS FLIGHT TO SAFETY -- THAT'S HELPING GOLD AND TECH STOCKS
by John Murphy,
Chief Technical Analyst, StockCharts.com
BANK INDEX WEIGHS ON STOCKS...Despite day to day volatility, major stock indexes are trying to hold onto small gains for the week and are trying to hold underlying support levels. The black bars in Chart 1 show the S&P 500 bouncing last week off potential support at...
READ MORE
MEMBERS ONLY
Don't Be Surprised by a Pleasant Surprise
by Martin Pring,
President, Pring Research
In early February, I pointed out that five consistently correct long-term indicators had triggered primary bull trend buy signals. The article certainly did not represent good timing from a short-term point of view, as the market has been selling off ever since. Nevertheless, these indicators remain in the bullish camp....
READ MORE
MEMBERS ONLY

STOCKS ATTEMPT TO STABILIZE NEAR SUPPORT -- BOND PRICES TEST RESISTANCE -- COMMODITY DROP CARRIES MIXED MESSAGE
by John Murphy,
Chief Technical Analyst, StockCharts.com
S&P 500 STABILIZES NEAR DECEMBER LOW...A short-term oversold condition helps support stocks. The daily bars in Chart 1 show the S&P 500 bouncing off potential chart support at its December low. In addition, its 9-day RSI line in the upper box is bouncing off its...
READ MORE
MEMBERS ONLY
Bull or Bear Market? A StockCharts Member Special
by Larry Williams,
Veteran Investor and Author
When Larry talks, you listen.
It's a great rule to live by. Anyone who has followed Larry Williams' legendary work in the markets knows the expertise he brings and the value of his analysis. So, when Larry called and said "I've got thoughts to...
READ MORE
MEMBERS ONLY

The Good News About SVB Bank They Are Not Telling You
by Martin Pring,
President, Pring Research
There is a well-known saying going around Wall Street that, when the Fed hits the brakes, someone inevitably crashes through the windscreen. That obviously applies to shareholders and directors of Silicon Valley Bank (SIVB), though depositors, following a nail-biting weekend, are apparently off the hook. It also warns the central...
READ MORE
MEMBERS ONLY

COLLAPSE IN BANK STOCKS LEADS MARKET LOWER -- PLUNGE IN INTEREST RATES BOOSTS BONDS
by John Murphy,
Chief Technical Analyst, StockCharts.com
BANK INDEX COLLAPSES... A plunge in bank stocks this week has inflicted heavy technical damage on that group and is weighing heavily on the rest of the market. The weekly bars in Chart 1 show the KBW Bank Index losing -16% on the week and falling to the lowest level...
READ MORE
MEMBERS ONLY
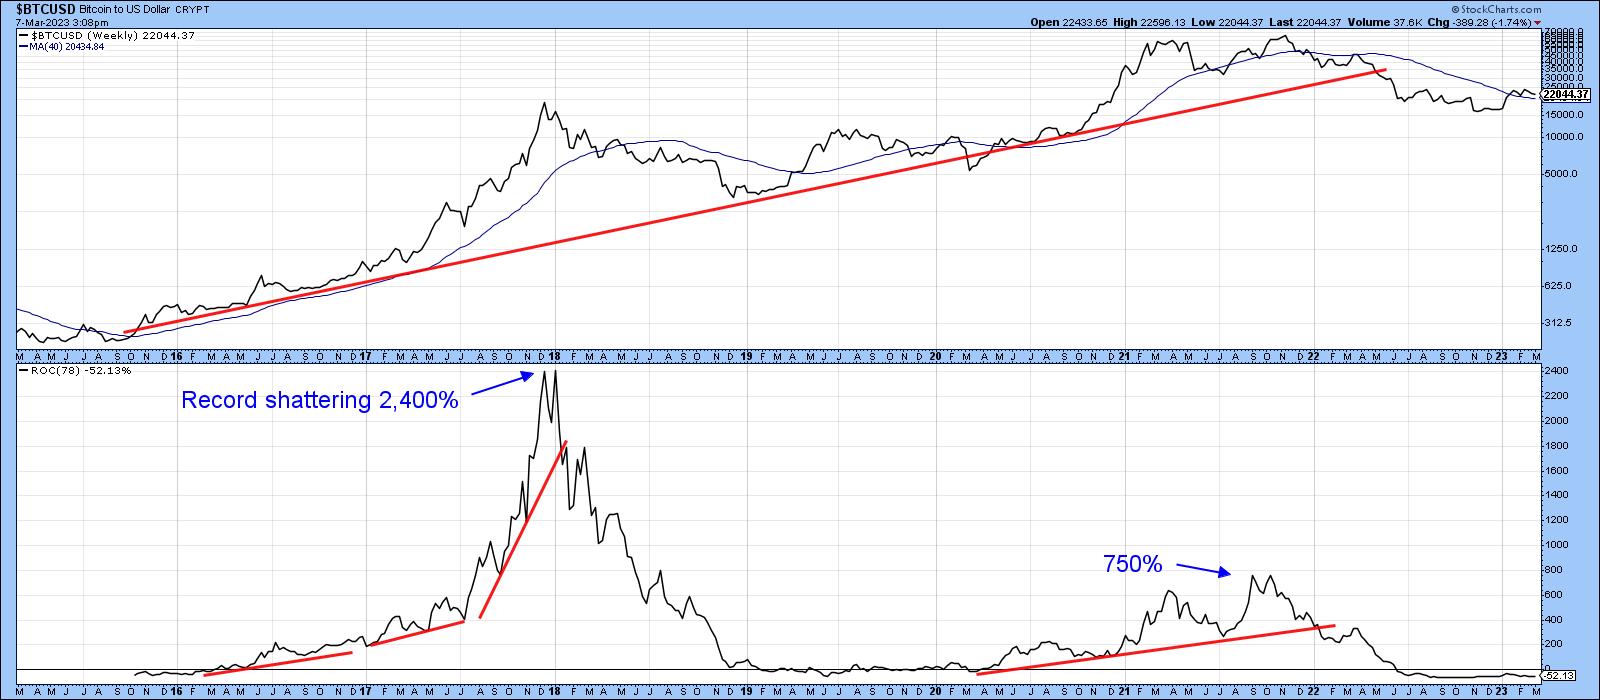
Is Bitcoin Ready for Prime Time Again?
by Martin Pring,
President, Pring Research
Last May, I wrote an article entitled "Bitcoin Bubble Finally Bursts", where I laid out the technical case for substantially lower prices. It was partially based on the fact that the 18-month ROC had peaked from a level in excess of 200%. My research, featuring 26 case studies...
READ MORE
MEMBERS ONLY

STOCK INDEXES HOLD 200-DAY LINES -- VIX INDEX RETREATS -- TWO-YEAR YIELD HITS 16 YEAR HIGH
by John Murphy,
Chief Technical Analyst, StockCharts.com
STOCK INDEXES HOLD 200-DAY LINES...After a weak month of February, major stock indexes are finally attracting some new buying. More importantly, this week's rebound is happening at some important moving average lines. Chart 1 shows the Dow Industrials bouncing off potential chart support along its late December...
READ MORE
MEMBERS ONLY
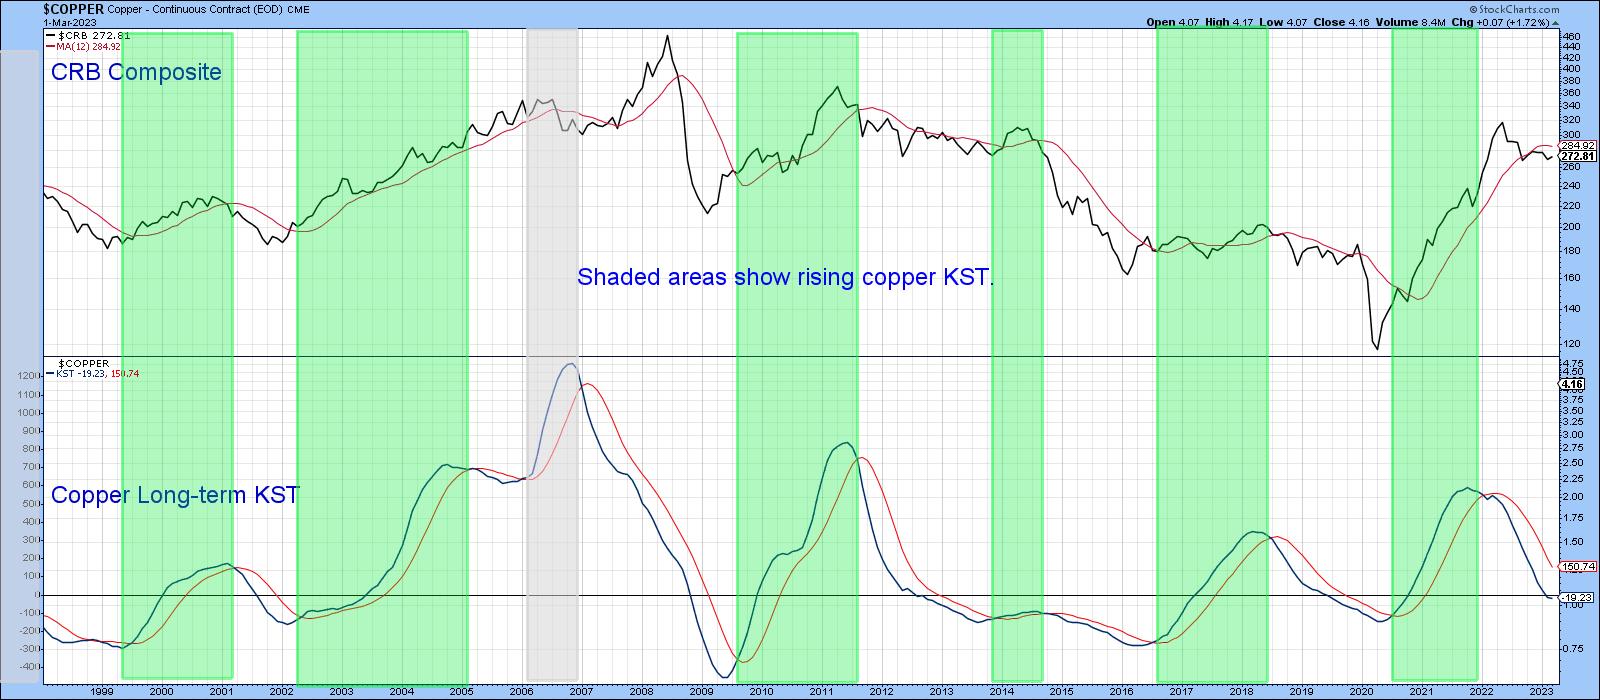
The Trend of This Metal Could Have Immense Consequences if It Breaks Out
by Martin Pring,
President, Pring Research
Commodity prices are an imperfect but useful forecaster of consumer price inflation. A key secular trend indicator that I use for industrial commodity prices went bullish last year. Since then, prices have corrected. However, it makes sense to take the pulse of the commodity markets from time to time, in...
READ MORE
MEMBERS ONLY

STOCKS LOSE UPSIDE MOMENTUM -- RISING BOND YIELDS ARE BAD FOR STOCKS
by John Murphy,
Chief Technical Analyst, StockCharts.com
DOW FAILS TEST OF AUGUST PEAK... The Dow Industrials led the three-month rally from their October low; and may be now leading the market lower. Chart 1 shows the Dow failing to clear a major resistance barrier at its August high and now falling back to the lowest level of...
READ MORE
MEMBERS ONLY
These Four "Basket Cases" Have Great Looking Charts
by Martin Pring,
President, Pring Research
We are all aware of the investment principle that it's time to buy when the news is blackest. Even knowing this, it's always difficult to step up and click on that buy button, because the problems seem unsolvable. Moreover, how do we know for sure that...
READ MORE
MEMBERS ONLY

INTEREST RATES RISE ON INFLATION REPORTS -- STOCKS PULLBACK -- ENERGY HAS A BAD WEEK
by John Murphy,
Chief Technical Analyst, StockCharts.com
TEN-YEAR YIELD TESTS 3.90%... Bond yields climbed this week on two reports showing that inflation gained during January. Chart 1 shows the 10-Year Treasury yield testing some resistance at 3.90% formed at the end of December. A close above that level would put the TNX at the highest...
READ MORE
MEMBERS ONLY

Trying to Unravel the Enigma of the US Dollar
by Martin Pring,
President, Pring Research
The US Dollar Index ($USD) has taken a hit in the last few months, causing many commentators to cry "bear market." However, an examination of the long-term indicators doesn't indicate a consensus pointing in a southerly direction. Neither is there unanimity that the recent setback represents...
READ MORE
MEMBERS ONLY

RISING RATES WEIGH ON STOCKS -- SMALL CAP INDEX STALLS AT AUGUST HIGHS -- ENERGY STOCKS JUMP WITH CRUDE OIL
by John Murphy,
Chief Technical Analyst, StockCharts.com
BOND YIELDS ARE CLIMBING... Last week's message showed the 10-Year Treasury yield bouncing off its 200-day moving average suggesting that a rebound in yields might be starting. Chart 1 shows the TNX climbing above its 50-day moving average and a falling trendline extending back to its October high....
READ MORE
MEMBERS ONLY

Momentum for This Interasset Relationship Just Reversed. What Are the Implications?
by Martin Pring,
President, Pring Research
Every business cycle has an inflationary and deflationary part to it. And if you know the prevailing phase, it can be enormously helpful. For example, when inflation is dominating, it's usually a favorable environment for commodities and commodity defensive sectors, such as mining and energy. At such times,...
READ MORE
MEMBERS ONLY

SMALL CAP LEADERSHIP IS AN ENCOURAGING SIGN -- STOCK INDEXES CLEAR DECEMBER HIGH -- KEEPING AN EYE ON BOND YIELDS
by John Murphy,
Chief Technical Analyst, StockCharts.com
SMALL CAP LEADERSHIP... The last couple of messages have shown improvement in market breadth. That improvement was reflected in rising advance-declines lines and percent of stocks over moving average lines. Here's another example of improving breadth in the form of small cap leadership. The daily bars in Chart...
READ MORE
MEMBERS ONLY

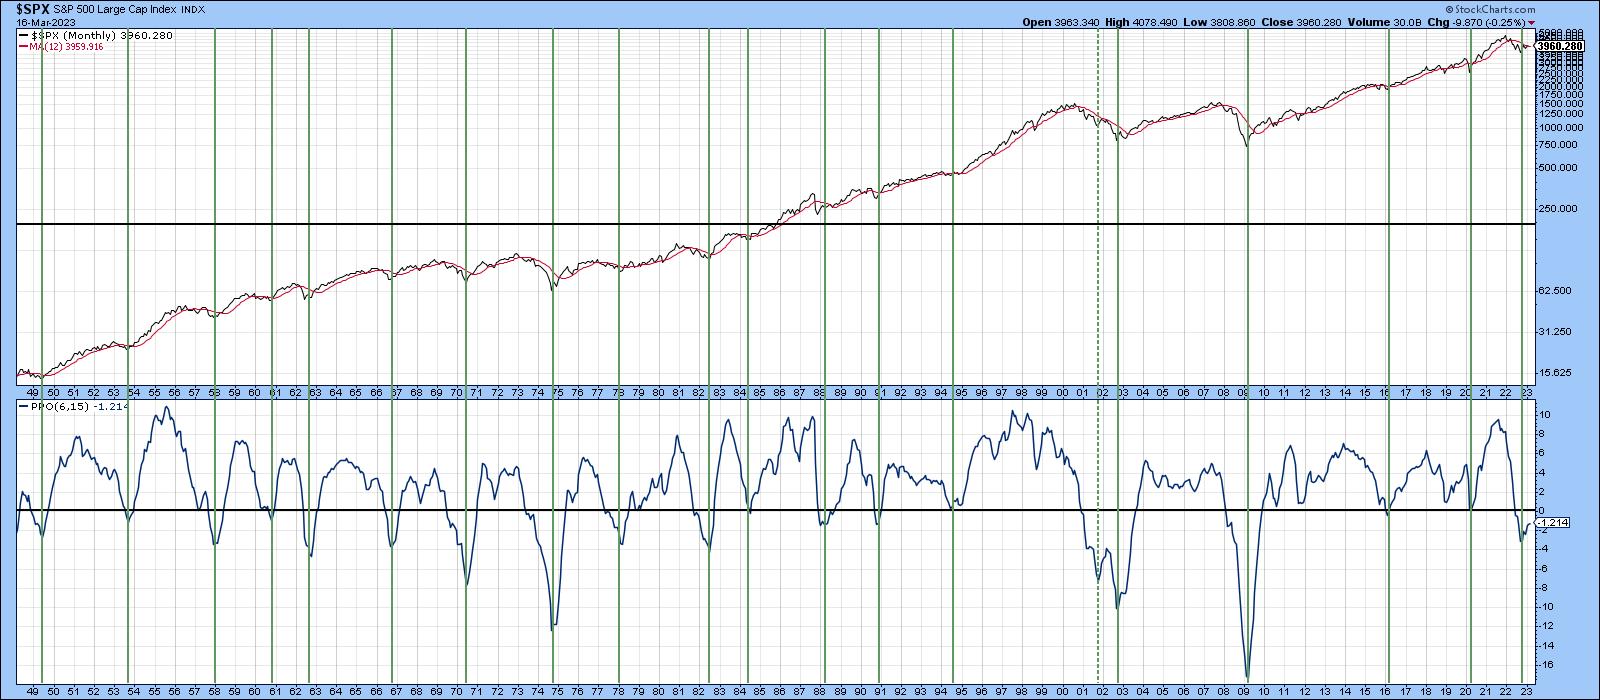
These Five Long-Term Indicators Are Signaling a Bull Market
by Martin Pring,
President, Pring Research
I have been negative on the market for some time. I believe that it's a wiser policy to wait for the long-term indicators to turn bullish, rather than trying to capture every twist and turn of those bear market rallies, pregnant as they are, with false breakouts and...
READ MORE
MEMBERS ONLY

S&P 500 NEARS TEST OF DECEMBER HIGH AFTER CLEARING 200-DAY LINE -- BREADTH INDICATORS REMAIN SUPPORTIVE -- SECTOR BREADTH IS ALSO POSITIVE
by John Murphy,
Chief Technical Analyst, StockCharts.com
NEXT TEST IS DECEMBER HIGH... The technical condition of the stock market continues to improve. Chart 1 shows the S&P 500 clearing its 200-day moving average. Although not shown here, it also cleared a falling trendline extending back a year. Both are positive signs. The next test will...
READ MORE