MEMBERS ONLY

STOCKS REBOUND FROM FROM OVERSOLD CONDITION -- COMMODITIES REMAIN WEAK -- ENERGY PRICES DECLINE

by John Murphy,
Chief Technical Analyst, StockCharts.com
S&P 500 ENDS THREE-WEEK DECLINE... Stocks are ending the week on a strong note after falling for the previous three weeks. An oversold condition and the presence of underlying chart support are also playing a role in this week's buying. The 9-day RSI line in the...
READ MORE
MEMBERS ONLY

Preparing for an Upcoming Bond Mini-Bull Market

by Martin Pring,
President, Pring Research
This may seem like a foolish title, given that the Fed could be about to raise short-term interest rates by as much as 75 basis points in September with further, but smaller, hikes following that. However, bonds revolve around the business cycle in a chronological sequence, as do stocks and...
READ MORE
MEMBERS ONLY

The Direction of the Secular Trend Will Determine Whether the June Low Holds
by Martin Pring,
President, Pring Research
The big daddy of all market trends is the secular or very long-term one, and it's about to have a big influence as to whether the June low will hold, meaning prices are about to reach new all-time highs, or if we are going to return to a...
READ MORE
MEMBERS ONLY

STOCKS SELL OFF ON HAWKISH FED -- MAJOR DOWNTREND IS STILL INTACT
by John Murphy,
Chief Technical Analyst, StockCharts.com
STOCKS SELL OFF FOLLOWING POWELL SPEECH... A modest rally attempt was turned back pretty decisively today following a speech by Fed chief Powell that sounded more hawkish than the market was expecting. Friday's heavy selling also reinforced the view expressed last Friday that the summer rally in stocks...
READ MORE
MEMBERS ONLY

Energy Gets a New Lease on Life
by Martin Pring,
President, Pring Research
Back in June, I wrote an article entitled Are Commodities Losing their Mojo?It drew attention to the fact that some long-term indicators were pointing to at least a temporarypull-back in prices. That process is already underway, but the article also pointed out that energy usually lags other industrial commodity...
READ MORE
MEMBERS ONLY

S&P 500 MEETS RESISTANCE AT ITS 200-DAY MOVING AVERAGE AS BOND YIELDS REBOUND -- SUMMER STOCK RALLY HAS REACHED CRITICAL JUNCTURE AS IT TESTS MAJOR RESISTANCE LINES
by John Murphy,
Chief Technical Analyst, StockCharts.com
S&P 500 STALLS AT 200-DAY AVERAGE...The two month rally in stocks has run into a couple of formidable resistance lines while in an overbought condition. Last week's message showed the S&P 500 nearing a test of its 200-day moving average and a falling...
READ MORE
MEMBERS ONLY

Dollar Bull Market Due for an Intermediate Correction, But It's Not an Easy Call
by Martin Pring,
President, Pring Research
It's a Primary Bull Market for the Dollar
Chart 1 shows that the US Dollar Index is very much in a primary bull market, having violated a (dashed) secular down trendline a few months ago and, more recently, completed a 7-year rectangle formation. The green-shaded areas identify those...
READ MORE
MEMBERS ONLY

STOCK INDEXES CLEAR JUNE HIGH -- TEST OF 200-DAY AVERAGES MAY BE NEXT
by John Murphy,
Chief Technical Analyst, StockCharts.com
JUNE HIGHS CLEARED... Last week's message showed major stock indexes testing initial resistance at their June highs, and suggested that an upside penetration of that resistance could lead to a possible test of their 200-day moving averages. Those June highs have since been exceeded. Chart 1 shows the...
READ MORE
MEMBERS ONLY

Good Inflation News is Helping Stocks Move Through Resistance -- But is It Enough?
by Martin Pring,
President, Pring Research
The summer rally has enabled several indexes to push through important resistance, but, since there was a lot of backing and filling at higher levels earlier this year, there are several places where even more resistance is apparent.
If you want to be bullish, for instance, take a look at...
READ MORE
MEMBERS ONLY

STOCK RALLY CONTINUES -- SOME POTENTIAL UPSIDE TARGETS -- NASDAQ TESTS DOWN TRENDLINE
by John Murphy,
Chief Technical Analyst, StockCharts.com
INTERMEDIATE TERM RALLY CONTINUES... The stock rally that started in mid-June continues to gain ground which confirms that the market has put in an intermediate term bottom. The question is how far that intermediate rally can rally within the current downtrend. Hopefully, the charts shown below will help determine where...
READ MORE
MEMBERS ONLY

Indexes Back to Their Breakdown Points; Should We Pop the Champagne If They Go Through?
by Martin Pring,
President, Pring Research
The rally since mid-June has taken several indexes back to their extended breakdown trendlines, which mark one demarcation point between bull and bear. Chart 1, for instance shows that the NASDAQ completed a top in May and then followed through with further weakness. By mid-June, the Index found a bottom...
READ MORE
MEMBERS ONLY

Markets Ready to Rock & Roll!

by Larry Williams,
Veteran Investor and Author
Markets are getting ready to rock & roll to the upside! In this exclusive StockCharts TV special, Larry has a lot to show you and a lot of education to share. He digs into the three key reasons he's expecting a major rally: panic selling, important buying, and...
READ MORE
MEMBERS ONLY

STOCK INDEXES TEST MOVING AVERAGE RESISTANCE -- ENERGY AND UTILITIES ARE WEEKLY LEADERS -- DROP IN BOND YIELDS MAY BE HELPING STOCKS
by John Murphy,
Chief Technical Analyst, StockCharts.com
STOCK INDEXES GAIN MORE GROUND... Despite a .75% rate hike by the Fed on Wednesday, and a second quarter of negative GDP growth on Thursday, stock indexes continued to gain ground. And they're in the process of testing some overhead resistance lines. Chart 1 shows the Dow Industrials...
READ MORE
MEMBERS ONLY

The Truth About Recessions
by Martin Pring,
President, Pring Research
This week, we diverge from our normal chart talk to focus on the economy, as the word "recession" is now on virtually every one's lips, provoked by a lot of misinformation.
First, there seems to be a general understanding in the media that the definition of...
READ MORE
MEMBERS ONLY

STOCKS SHOW MODEST WEEKLY GAINS -- BUT DOWNTREND STILL IN EFFECT -- PULLBACK IN BOND YIELDS MAY BE HELPING STOCKS
by John Murphy,
Chief Technical Analyst, StockCharts.com
MODEST WEEKLY GAINS... Stock indexes gained some ground this week, but not enough to reverse major downtrends. And they remain below overhead resistance levels. The daily bars in Chart 1 show the Dow Industrials rising to the highest level in six weeks and clearing their 50-day moving average. While that...
READ MORE
MEMBERS ONLY

Housing Data Disappoints, But Housing ETFs Rally
by Martin Pring,
President, Pring Research
Due to its sensitivity to interest rates, housing has the greatest average lead time going into recessions than any other economic (as opposed to financial) indicator. For that reason alone, it is worth examining amid the constant talk of recession.
The HMI vs. Housing Starts
Earlier this week, two important...
READ MORE
MEMBERS ONLY

ONE VERSION OF YIELD CURVE INVERTS -- ANOTHER IS WEAKENING -- ENERGY SECTOR REMAINS WEAK
by John Murphy,
Chief Technical Analyst, StockCharts.com
TEN YEAR - TWO YEAR YIELD CURVE INVERTS... Chart 1 shows the spread between the ten year and two year Treasury yields falling below the zero line which signals an inverted yield curve. That means that the shorter two-year yield is now higher than the longer maturity ten-year yield. That...
READ MORE
MEMBERS ONLY

Will the Bond Market Surprise Us?
by Martin Pring,
President, Pring Research
In late April, I wrote that bond yields had run into resistance and a pause in the on-going uptrend was likely. Yields on longer-dated maturities initially moved slightly higher, but are now at approximately the same level as that April article. However, more corrective activity appears likely, as commodities (e....
READ MORE
MEMBERS ONLY

STOCKS SHOW MODEST GAINS ON THE WEEK -- SECTOR BREADTH REMAINS WEAK -- COMMODITIES TEST SUPPORT LINES
by John Murphy,
Chief Technical Analyst, StockCharts.com
MAJOR STOCK INDEXES GAIN ON THE WEEK... Stocks saw modest gains on the week but not enough to disturb their major downtrend. Chart 1 shows the Dow Industrials gaining .77% for the week but remaining well below overhead resistance levels and moving average lines. Chart 2 shows the S&...
READ MORE
MEMBERS ONLY

Credit Spreads May be the Canary in the Financial Mine
by Martin Pring,
President, Pring Research
Waterfall declines leading to capitulation are easy to observe and understand when we have the benefit of hindsight. However, they are almost impossible to identify ahead of time.
One characteristic often associated with such uncomfortable price moves is an unexpected weakening of economic activity, where confidence literally falls off a...
READ MORE
MEMBERS ONLY

STOCKS END SECOND QUARTER ON THE DOWNSIDE -- YIELD CURVE NEARS INVERSION -- SECTOR RANKINGS REMAIN DEFENSIVE
by John Murphy,
Chief Technical Analyst, StockCharts.com
STOCKS REMAIN UNDER PRESSURE...Stocks are ending the quarter with more selling. The weekly bars in Chart 1 show the S&P 500 down more than 3% on the week with a monthly loss of more than 8%. For the year, the S&P 500 is down 20%...
READ MORE
MEMBERS ONLY
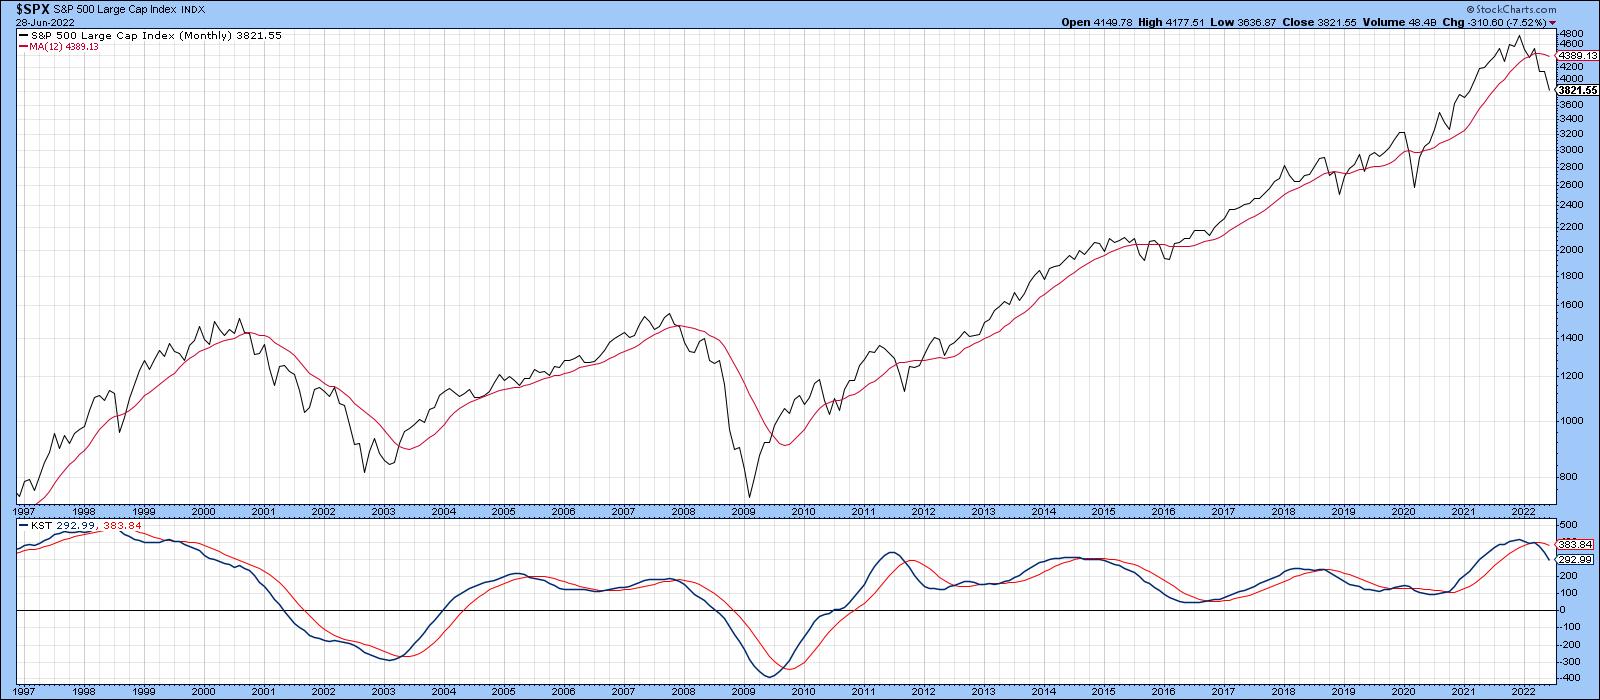
The Rally Since Mid-June Leaves a Lot to be Desired
by Martin Pring,
President, Pring Research
Long-term indicators, such as the KST and the S&P relative to its 12-month MA, remain in a bearish mode, but, that said, it would certainly be unusual to see them turn bullish immediately after the final low. Indeed, Chart 1 shows that the Index is currently well below...
READ MORE
MEMBERS ONLY

STOCKS HAVE A STRONG WEEK WITHIN DOWNTREND -- MARKET BREADTH REMAINS WEAK -- COPPER SELLING SIGNALS ECONOMIC WEAKNESS
by John Murphy,
Chief Technical Analyst, StockCharts.com
BEAR MARKET BOUNCE...Major stock indexes had their first gain in three weeks and made up for the previous week's big losses. But any rebound still has to be viewed as a bear market bounce. The weekly bars in the first three charts below paint a similar picture....
READ MORE
MEMBERS ONLY

Are Commodities Losing their Mojo?
by Martin Pring,
President, Pring Research
Commodities have been on a tear since their lows set in the spring of 2020, but every news outlet you tune into these days is talking about inflation, gasoline in particular. That does not mean that prices cannot go higher. Over the long-term, that's probably a realistic scenario....
READ MORE
MEMBERS ONLY

RISING BOND YIELDS HURT HOMEBUILDERS -- THAT'S HELPING MAKE CONSUMER DISCRETIONARY SECTOR THE WEAKEST PART OF THE MARKET THIS YEAR
by John Murphy,
Chief Technical Analyst, StockCharts.com
RISING RATES HURT HOMEBUILDERS... Weakness in homebuilding stocks is another sign that the U.S. economy is weakening. Rising mortgage rates which are closely tied to bond yields have a lot to do with that. The brown weekly bars in Chart 1 show the U.S. Home Construction iShares (ITB)...
READ MORE
MEMBERS ONLY

Four Charts that are Acting in an Unintuitive Way
by Martin Pring,
President, Pring Research
Prices often move in the opposite direction to the expectations of most investors and traders. In many cases, that happens because the latest news has already been factored into prices and market participants have already begun to anticipate the next development. For example, a group of institutions might like the...
READ MORE
MEMBERS ONLY

FOUR DECADE HIGH IN INFLATION PUSHES STOCK AND BOND PRICES SHARPLY LOWER -- BOND YIELD NEARING MAJOR UPSIDE BREAKOUT -- NO SIGN OF A TOP IN OIL
by John Murphy,
Chief Technical Analyst, StockCharts.com
HOT CPI REPORT SIGNALS LOWER STOCK PRICES... Friday's report that the May Consumer Price Index gained 8.6% from the previous year was the highest inflation rate in more than forty years and pushed stock prices sharply lower for the day and week. Going into the report, expectations...
READ MORE
MEMBERS ONLY

This Sector Bucked Last Friday's Decline and Could Be Ready to Take Off
by Martin Pring,
President, Pring Research
A couple of weeks ago, I wrote about the fact that the technical position of gold was extremely finely balanced, and that it was "Either in a Hard Place or a Sweet Spot". My conclusion was that its short-term position was improving and that the sweet spot scenario...
READ MORE
MEMBERS ONLY

What Happens When Bonds Start to Outperform Stocks?
by Martin Pring,
President, Pring Research
It is possible for prices of individual asset classes to move in a linear up or down trend for an extended period. However, this rarely happens with inter-asset relationships, which rotate around the business cycle. As a result, it is helpful to monitor inter-asset relationships and their momentum to see...
READ MORE
MEMBERS ONLY

SHORT-TERM STOCK REBOUND NOT THAT IMPRESSIVE
by John Murphy,
Chief Technical Analyst, StockCharts.com
NOT MUCH OF REBOUND...This time last week it seemed clear that stocks had put in a short-term bottom marking the start of a potential bear market rally. So far at least, that rally hasn't gone very far. The three charts shown below show the same overhead resistance...
READ MORE
MEMBERS ONLY
Gold: Either in a Hard Place or a Sweet Spot
by Martin Pring,
President, Pring Research
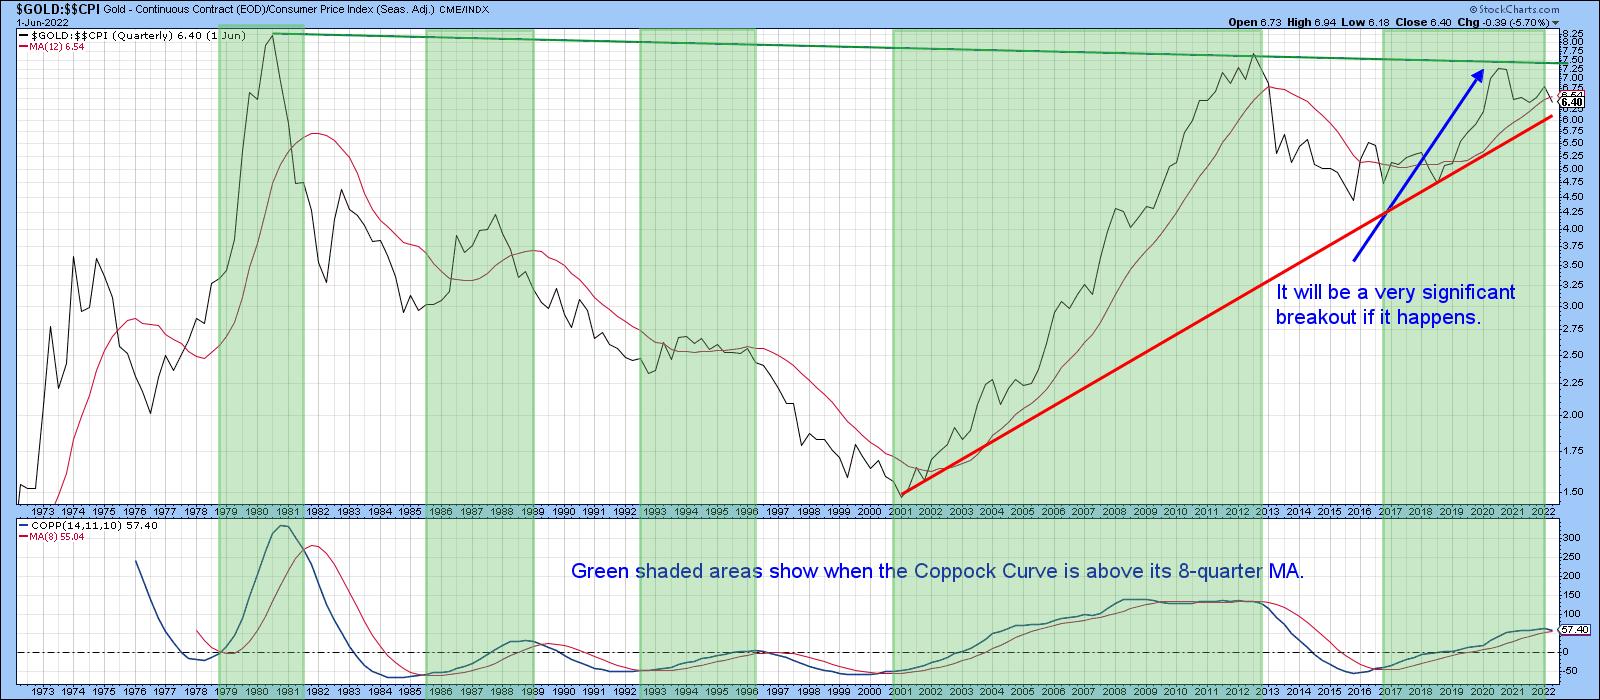
The long-term technical position of gold is extremely finely balanced and could easily tip into a full-fledged bear market, or start a new secular up leg to the bull trend that began in the opening years of this century.
Chart 1 really says it all. First, it expresses gold adjusted...
READ MORE
MEMBERS ONLY
Where Do We Go From Here? And Will This Rally Last?
by Larry Williams,
Veteran Investor and Author
Larry is back and ready to weigh in with his forecast of where stocks—and the economy—are headed in this new StockCharts TV special. He takes a look at some of the "Fallen Angels" of the market and discusses the ongoing situation with inflation. Afterwards, he focuses...
READ MORE
MEMBERS ONLY

THIS WEEK'S REBOUND SUGGESTS SHORT-TERM STOCK BOTTOM IN PLACE -- BUT HOW FAR CAN IT RALLY?
by John Murphy,
Chief Technical Analyst, StockCharts.com
WEEKLY S&P CHART SHOWS OVERSOLD CONDITION... Stocks are having their best week in two months which suggests that a short-term bottom may be in place. Before looking at daily charts, however, it's worth checking a weekly chart to keep things in perspective. The weekly bars in...
READ MORE
MEMBERS ONLY

It's Time for a Rally, But that Comes with a Catch
by Martin Pring,
President, Pring Research
The stock market's recent sell-off has made the front pages and top headlines in TV broadcasts, and CNN's famous Fear and Greed Index has fallen to an extreme level of fear. My contrarian bones say it's time for a rally. Is that right? Yes...
READ MORE
MEMBERS ONLY

STOCKS REMAIN UNDER PRESSURE -- BREADTH FIGURES CONFIRM BEARISH OUTLOOK
by John Murphy,
Chief Technical Analyst, StockCharts.com
S&P 500 REMAINS IN DOWNTREND...Stock prices continue to weaken with no sign of a bottom. The daily bars in Chart 1 show the S&P 500 having fallen to the lowest level in more than a year and nearing a 20% loss which signals a bear...
READ MORE
MEMBERS ONLY

Commodities on the Verge of an Upside Breakout, But Participation Will Likely Narrow
by Martin Pring,
President, Pring Research
Chart 1 shows that the Invesco DB Commodity Tracking Fund could be on the verge of breaking out from a 3-month consolidation pattern. It also points out that the number of commodities participating in the rally has been narrowing of late. That's because the indicator monitoring a universe...
READ MORE
MEMBERS ONLY

USING FIBONACCI RETRACEMENT LINES FOR POTENTIAL DOWNSIDE TARGETS
by John Murphy,
Chief Technical Analyst, StockCharts.com
INFLATION REMAINS THE BIGGEST THREAT TO MARKETS... It was reported this morning that April's Producer Price Index for the past year came in at 11%. That followed yesterday's report that the Consumer Price Index was 8.3%. Both reports confirm that inflation remains dangerously high with...
READ MORE
MEMBERS ONLY

Bitcoin Bubble Finally Bursts
by Martin Pring,
President, Pring Research
I have written two articles about Bitcoin in recent months. The first,last December, concluded that "there are definitely some cracks appearing (in the technical structure), but a shrinking consensus of evidence continues to point to an uptrend." Thesecond, entitled "Has the Bitcoin Bubble Burst", noted...
READ MORE
MEMBERS ONLY

STOCKS RESUME SELLING AFTER FED RELIEF RALLY -- BOND YIELDS NEAR TEST OF OVERHEAD RESISTANCE
by John Murphy,
Chief Technical Analyst, StockCharts.com
STOCK SELLING RESUMES... Stocks are being sold heavily today and are totally reversing yesterday's Fed relief rally. Stocks have given back all of Wednesday's price gains and look poised to fall further. Chart 1 shows the Dow Industrials falling sharply today after meeting resistance at their...
READ MORE
MEMBERS ONLY

It's Not What the Fed Does, But How the Market Reacts to its Decision, That Counts
by Martin Pring,
President, Pring Research
I'll get to the Fed element later, but, first, a few words on the Dow Jones Global Stock Index. Chart 1 shows that it has been experiencing a series of declining peaks and troughs since last November. That's not a bullish sign. Neither is the fact...
READ MORE