MEMBERS ONLY

DP Trading Room: These Banks are Bullish Going Into Earnings

by Erin Swenlin,
Vice President, DecisionPoint.com
Earnings season is kicking off and Carl and Erin spotlight the banks that will be reporting on Friday. The setups aren't good for all of these banks, but some are set up nicely going into their earnings calls. Earnings are always tricky as good earnings can still result...
READ MORE
MEMBERS ONLY
The Economy is Slowing - Are You in the Right Stocks?

by Mary Ellen McGonagle,
President, MEM Investment Research
In this StockCharts TV video, Mary Ellen reviews where things stand after the markets close at another new high. She also shares what drove price action this week and how that may change the markets going forward. Finally, she highlights precise sell strategies in a shifting market.
This video originally...
READ MORE
MEMBERS ONLY
The Chart to Help Navigate a Summer Market Top

by David Keller,
President and Chief Strategist, Sierra Alpha Research
KEY TAKEAWAYS
* Value sectors have been consistently underperforming the benchmarks since the April market low
* Technology has outperformed the S&P 500 as well as other growth sectors in 2024
* Defensive sectors like Utilities and Consumer Staples may be the most important to watch, as they can demonstrate investor...
READ MORE
MEMBERS ONLY

Tesla Stock's Shocking Comeback: What You Need to Know Before July 23

by Karl Montevirgen,
The StockCharts Insider
KEY TAKEAWAYS
* TSLA's stock price surged 32% above its zone of congestion following its April 23 earnings report
* News of Tesla's dwindling inventories, plus expectations of a Fed rate cut before the end of the year (among other things), are fueling the stock's advance...
READ MORE
MEMBERS ONLY

Unmasking Market Moves: Why Focusing on Individual Stocks Beats Indexes in 2024

by Julius de Kempenaer,
Senior Technical Analyst, StockCharts.com
KEY TAKEAWAYS
* Today, we're looking at market breadth from a different perspective
* In this article, we'll plot major US stockmarket indices on a Relative Rotation Graph
* Even inside the NYFANG index, the base is narrow
There's been much chatter and mentions of weak or...
READ MORE
MEMBERS ONLY

Should You Be Worried About Poor Market Breadth?
by David Keller,
President and Chief Strategist, Sierra Alpha Research
In this edition of StockCharts TV'sThe Final Bar, available to watch below, Dave celebrates the S&P 500 closing above 5500, laments the lack of market breadth, and provides updates on the infamous Hindenburg Omen. He also breaks down key levels to watch on charts of V,...
READ MORE
MEMBERS ONLY

Could AMZN's Stock Hit $3 Trillion Valuation? What You Need To Know
by Karl Montevirgen,
The StockCharts Insider
KEY TAKEAWAYS
* AMZN's stock price entered new all-time high territory, closing at $200.02; it could rise higher
* If AMZN's stock price dips, watch for key levels to enter a long position
* Amazons' next earnings report is expected to drop on August 1, 2024, which...
READ MORE
MEMBERS ONLY

DP Trading Room: Deflation...a Possibility?
by Erin Swenlin,
Vice President, DecisionPoint.com
Today's DP Trading Room was jam packed! The lead story is definitely the fact that deflation is another possibility that many are not talking about. We don't know if it will be the final outcome, but we have a link that discusses this possibility: https://hoisington....
READ MORE
MEMBERS ONLY

What to Expect This Month | Focus on Stocks: July 2024

by Larry Williams,
Veteran Investor and Author
Historically, July has seen stock prices move higher almost 80% of the time, cementing this in our trader's notebook as a time to stay home and trade. Others can vacation this month!
Chart 1 is my true seasonal pattern for the Dow for the last 124 years. It...
READ MORE
MEMBERS ONLY

Top 5 Stocks in "Go" Trends | Fri June 28, 2024

by Tyler Wood,
Co-founder, GoNoGo Charts®
KEY TAKEAWAYS
* Trend Continuation
* Breakouts
* Momentum Confirmation
* Bull Flags
Top 5 Stocks in "Go" Trends
Trend Continuation on Rising Momentum
GoNoGo Charts® highlight low-risk opportunities for trend participation with intuitive icons directly in the price action. The resurgence of momentum in the direction of the underlying price trend...
READ MORE
MEMBERS ONLY
Top 10 Stocks to Watch in July 2024!
by David Keller,
President and Chief Strategist, Sierra Alpha Research

by Grayson Roze,
Chief Strategist, StockCharts.com
In this edition of StockCharts TV'sThe Final Bar, join Dave and Grayson as they run through top 10 charts to watch in July 2024! They'll cover breakout strategies, moving average techniques, relative strength, and much more. You don't want to miss these insights into...
READ MORE
MEMBERS ONLY
Mastering GoNoGo Charting: Scanning Securities on StockCharts.com
by Tyler Wood,
Co-founder, GoNoGo Charts®
KEY TAKEAWAYS
* Scanning
* screening
* Idea Generation
* Market Breadth
Join Tyler Wood, CMT, in this insightful tutorial where he demonstrates how to effectively scan for GoNoGo conditions using StockCharts.com. GoNoGo Charts, a powerful method developed by Alex Cole and Tyler Wood, blend foundational tools in technical analysis into a powerful...
READ MORE
MEMBERS ONLY

3 Essential Lessons We Investors Can Learn from Top Winemakers

by Gatis Roze,
Author, "Tensile Trading"
"It takes 10 years to learn from the vineyard, and another 10 years to learn the wine from that vineyard."
Metaphors and analogies are powerful teachers and offer behavioral adhesiveness. In other words, the ideas and lessons they present stick in our memory, and can thus more easily...
READ MORE
MEMBERS ONLY

Bank Stress Tests: What They Mean for Your Portfolio

by Jayanthi Gopalakrishnan,
Director of Site Content, StockCharts.com
KEY TAKEAWAYS
* The 2024 bank stress results show that all participating banks are able to withstand an economic collapse
* In spite of the banks passing the stress test, the XLF didn't see much movement
* Look for XLF to reverse at its 50% Fibonacci retracement level and start gaining...
READ MORE
MEMBERS ONLY

Can Nvidia's Stock Skyrocket Again? Key Levels to Watch Now!
by Karl Montevirgen,
The StockCharts Insider
KEY TAKEAWAYS
* NVDA shares prices are falling, but it doesn't necessarily mean that the AI trend is at an end
* Expect near-term weakness in NVDA's stock price but keep in mind that longer-term prospects present a different picture
* Watch key support levels since ultra-bullish sentiment could...
READ MORE
MEMBERS ONLY

Why Investors are Betting Big on Berkshire Hathaway Class B Shares Right Now
by Karl Montevirgen,
The StockCharts Insider
KEY TAKEAWAYS
* Berkshire Hathaway Class B shares are poised for an explosive breakout
* Fundamentally, BRK/B has been a consistent outperformer and is diversified among different sectors
* BRK/B is working its way through a symmetrical triangle formation and could breakout in either direction
Berkshire Hathaway needs no introduction. The...
READ MORE
MEMBERS ONLY

DP Trading Room: Carl's Grab Bag! - Chipotle (CMG), NVDA, Bahnsen & Hussman
by Erin Swenlin,
Vice President, DecisionPoint.com
Carl brings out his "Grab Bag" during today's free DecisionPoint Trading Room! He gives us a read on Chipotle's (CMG) 50:1 split. He talks about NVDA's strangle hold on the market and gives us homework to read recent articles from David...
READ MORE
MEMBERS ONLY

4 Ways To ENHANCE The Moving Averages On Your Charts
by Grayson Roze,
Chief Strategist, StockCharts.com
Moving averages are a crucial charting tool, but many of us aren't getting the most out of them. In this edition of StockCharts TV'sStockCharts in Focus, Grayson shows you how to enhance your moving averages with 4 unique charts, straight out of his own account. You&...
READ MORE
MEMBERS ONLY

Gilead's Game-Changer: What You Need to Know About the Stock
by Karl Montevirgen,
The StockCharts Insider
KEY TAKEAWAYS
* Gilead Sciences' stock price got a boost from positive results of a late-stage trial of its HIV drug
* While Gilead still needs to replicate its results and seek FDA approval, this may be a good time for traders and investors to get in early on a potentially...
READ MORE
MEMBERS ONLY

Deja Dot.com Disaster?

by Carl Swenlin,
President and Founder, DecisionPoint.com
Today on Fox Business' Varney & Company, David Bahnsen (The Bahnsen Group) was asked if the current market reminded him of the Dot.com Bubble. He said it did, but not the part about all those worthless dot.com companies that went bust. Big companies like Cisco, Microsoft, and...
READ MORE
MEMBERS ONLY

Investing with the Trend: Conclusions

by Greg Morris,
Veteran Technical Analyst, Investor, and Author
Note to the reader: This is the twenty-fifth and final in a series of articles I'm publishing here, taken from my book, "Investing with the Trend." Hopefully, you will find this content useful. Market myths are generally perpetuated by repetition, misleading symbolic connections, and the complete...
READ MORE
MEMBERS ONLY

Analyze This: Will the Dow Soar or Crash in 2024?
by Karl Montevirgen,
The StockCharts Insider
KEY TAKEAWAYS
* Analyst opinions of Dow Jones Industrial Average are mixed, with both bullish and bearish forecasts
* While some analysts expect the Dow to hit 40,000 this year, some say it can fall to 34,000
* Basic tools like trend lines and support-and-resistance, paired with Fibonacci Retracements, can help...
READ MORE
MEMBERS ONLY

June & Gloom | Larry's "Family Gathering" June 18, 2024 Recording
by Larry Williams,
Veteran Investor and Author
June is here! Will it be bloom or gloom for the stock market?
In this month's Family Gathering video, Larry examines the current averages in the market and what the advance-decline line is telling us. He explains the Trading Day of the Month (TDOM) concept and how you...
READ MORE
MEMBERS ONLY

"Family Gathering" Meeting Today at 2 PM Eastern
Today, Larry Williams will be hosting a "Family Gathering" meeting at 2pm Eastern Daylight Time (11am Pacific). Sign-in in begins 5 minutes prior. The show, which will include both a presentation from Larry and a viewer Q&A session, will be recorded and posted online for those...
READ MORE
MEMBERS ONLY

DP Trading Room: Natural Gas (UNG) Bearish Again?
by Erin Swenlin,
Vice President, DecisionPoint.com
Carl and Erin return to the trading room showing you the charts you need to see to start your week!
Carl covered the market trends and condition to start the program. He also covers Bitcoin, Dollar, Gold, Silver, Gold Miners, Bonds, Yields and Crude Oil.
Carl also gave us a...
READ MORE
MEMBERS ONLY

Breadth Thrust Can Validate a New Bull Phase for Stocks
by David Keller,
President and Chief Strategist, Sierra Alpha Research
In this edition of StockCharts TV'sThe Final Bar, Dave describes how the "breadth thrust", popularized by legendary market strategist Martin Zweig, can help to validate a new bull phase for stocks. He answers viewer questions on pairs trades, running technical indicators like RSI on price ratios,...
READ MORE
MEMBERS ONLY

A Debit Spread in American Express to Add Long Exposure

by Tony Zhang,
Chief Strategist, OptionsPlay
KEY TAKEAWAYS
* American Express (AXP) has pulled back and is in oversold levels, which may present a buying opportunity
* AXP has upside potential and, to take advantage of it, you could trade an ITM debit spread
* A debit spread has a favorable risk to reward potential that can add long...
READ MORE
MEMBERS ONLY

How to Stop the "Wealth Destroyers" by Deploying Your Sell Methodology
by Gatis Roze,
Author, "Tensile Trading"
"We are in the business of making mistakes. Winners make small mistakes. Losers make big mistakes."
There are zillions of cliches that paraphrase what Ned Davis said. The umbrella axiom with your portfolio should be to cut your losers.
Nude investing is what I label an investor without...
READ MORE
MEMBERS ONLY
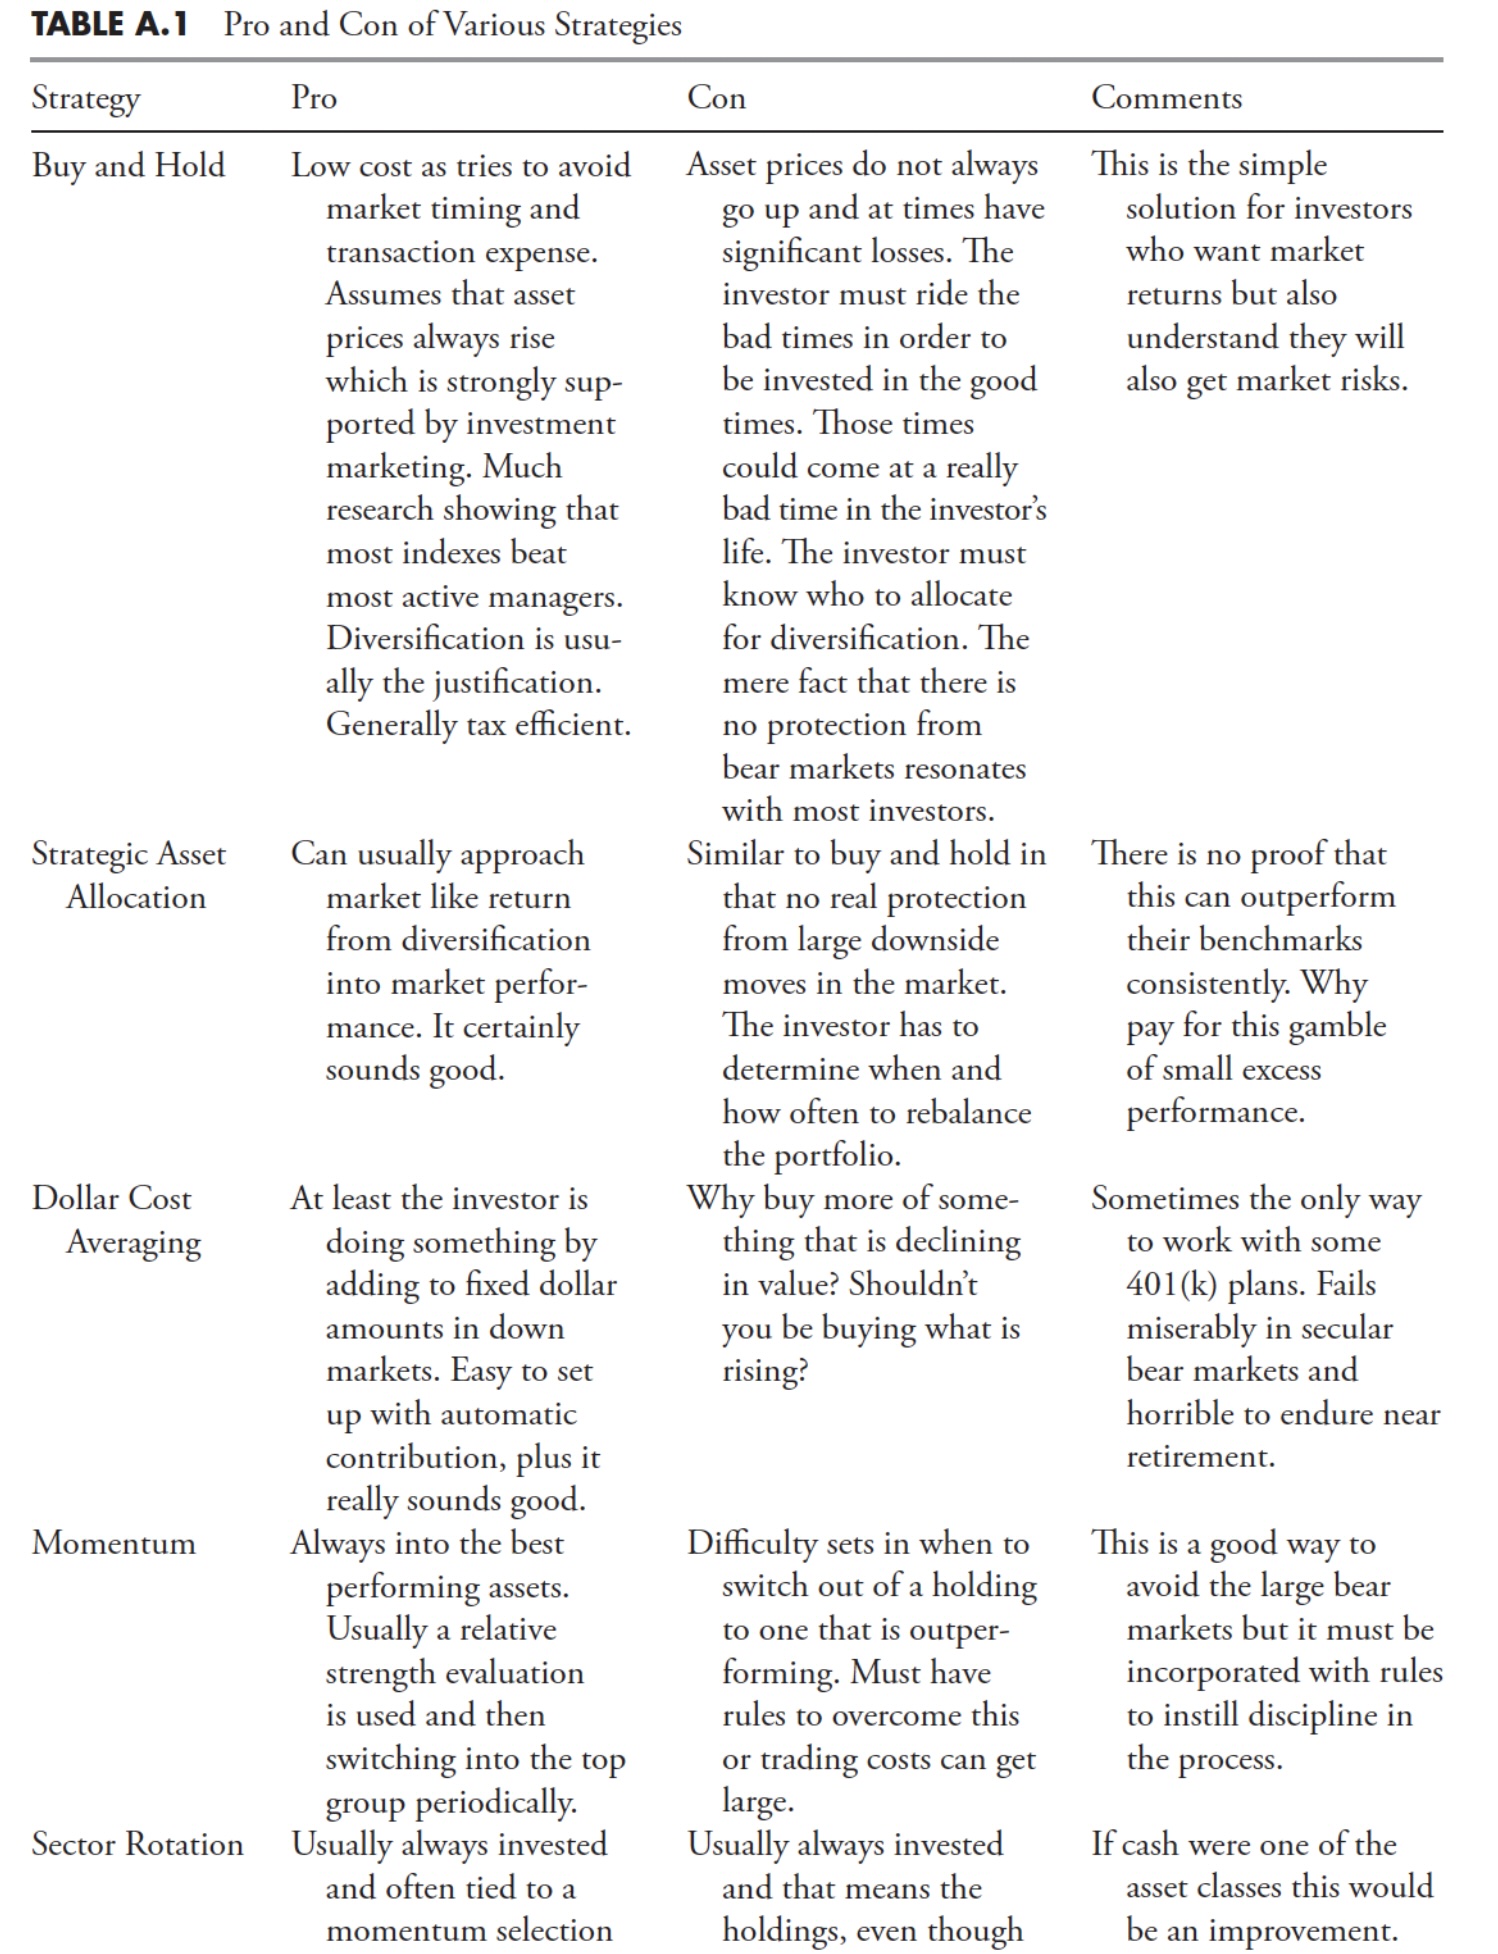
Investing with the Trend: Appendix
by Greg Morris,
Veteran Technical Analyst, Investor, and Author
Note to the reader: This is a set of appendices for a series of articles I'm publishing here, taken from my book, "Investing with the Trend." Hopefully, you will find this content useful. Market myths are generally perpetuated by repetition, misleading symbolic connections, and the complete...
READ MORE
MEMBERS ONLY

Bitcoin, Politics, and Profits: What You Need to Know About CleanSpark and Riot Platforms
by Karl Montevirgen,
The StockCharts Insider
KEY TAKEAWAYS
* A presidential contender expressed a desire to mine all remaining Bitcoin in the U.S.
* 90% of Bitcoin's total supply of 21 million has been mined
* If the remaining Bitcoin gets mined, it presents an unprecedented opportunity for two of the largest Bitcoin miners in the...
READ MORE
MEMBERS ONLY

Larry's LIVE "Family Gathering" Webinar Airs NEXT WEEK - Tuesday, June 18 at 2 PM EDT!
Larry is going LIVE! Don't miss the upcoming "Family Gathering" webinar with Larry Williams, airing live through Zoom on Tuesday, June 18 at 2:00pm Eastern Daylight Time.
In this must-see event, Larry will be presenting his current opinions on a broad variety of current market...
READ MORE
MEMBERS ONLY

5 Simple and Powerful Uses for Moving Averages

by Joe Rabil,
President, Rabil Stock Research
On this week's edition of Stock Talk with Joe Rabil, Joe shows the five ways to use the Moving Average lines to help with decision making. He discusses how these lines can help to define trend reversals and confirmed trends, when to be on the alert for a...
READ MORE
MEMBERS ONLY

DP Trading Room: Equal-Weight Losing Against Cap-Weight SPY
by Erin Swenlin,
Vice President, DecisionPoint.com
Did you know that the equally-weighted RSP is seriously underperforming the cap-weighted SPY? It is losing considerable ground against the SPY and that suggests that if mega-caps fail, so will go the market. Carl shows us charts to prove his point.
Next up Carl covers the market in general followed...
READ MORE
MEMBERS ONLY

Tracking the Three Signs of the Bear
by David Keller,
President and Chief Strategist, Sierra Alpha Research
There is no denying that the primary trend for the S&P 500 remains bullish as we push to the end of Q2 2024. But what about the conditions "under the hood" of the major benchmarks? Today, we'll highlight three "signs of the bear&...
READ MORE
MEMBERS ONLY

NVIDIA's Stock Split and Potential Correction
by Carl Swenlin,
President and Founder, DecisionPoint.com
by Erin Swenlin,
Vice President, DecisionPoint.com
When Nvidia (NVDA) opens on Monday, it will have experienced a 10:1 split, and we should remember that one of the purposes of stock splits is to facilitate distribution. That is to say that the lower price after the split attracts investors who avoided the stock at the higher...
READ MORE
MEMBERS ONLY

Retail Stocks Caught in Limbo: Will RTH Break Free and Soar?
by Karl Montevirgen,
The StockCharts Insider
KEY TAKEAWAYS
* VanEck Vectors Retail ETF (RTH) holds 70% discretionary and 30% staples retail stocks
* Retail stocks have been on a steady long-term uptrend over the last 10 years
* Traders are likely to accumulate or sell positions depending on the Fed's interest rate decisions
VanEck Vectors Retail ETF...
READ MORE
MEMBERS ONLY
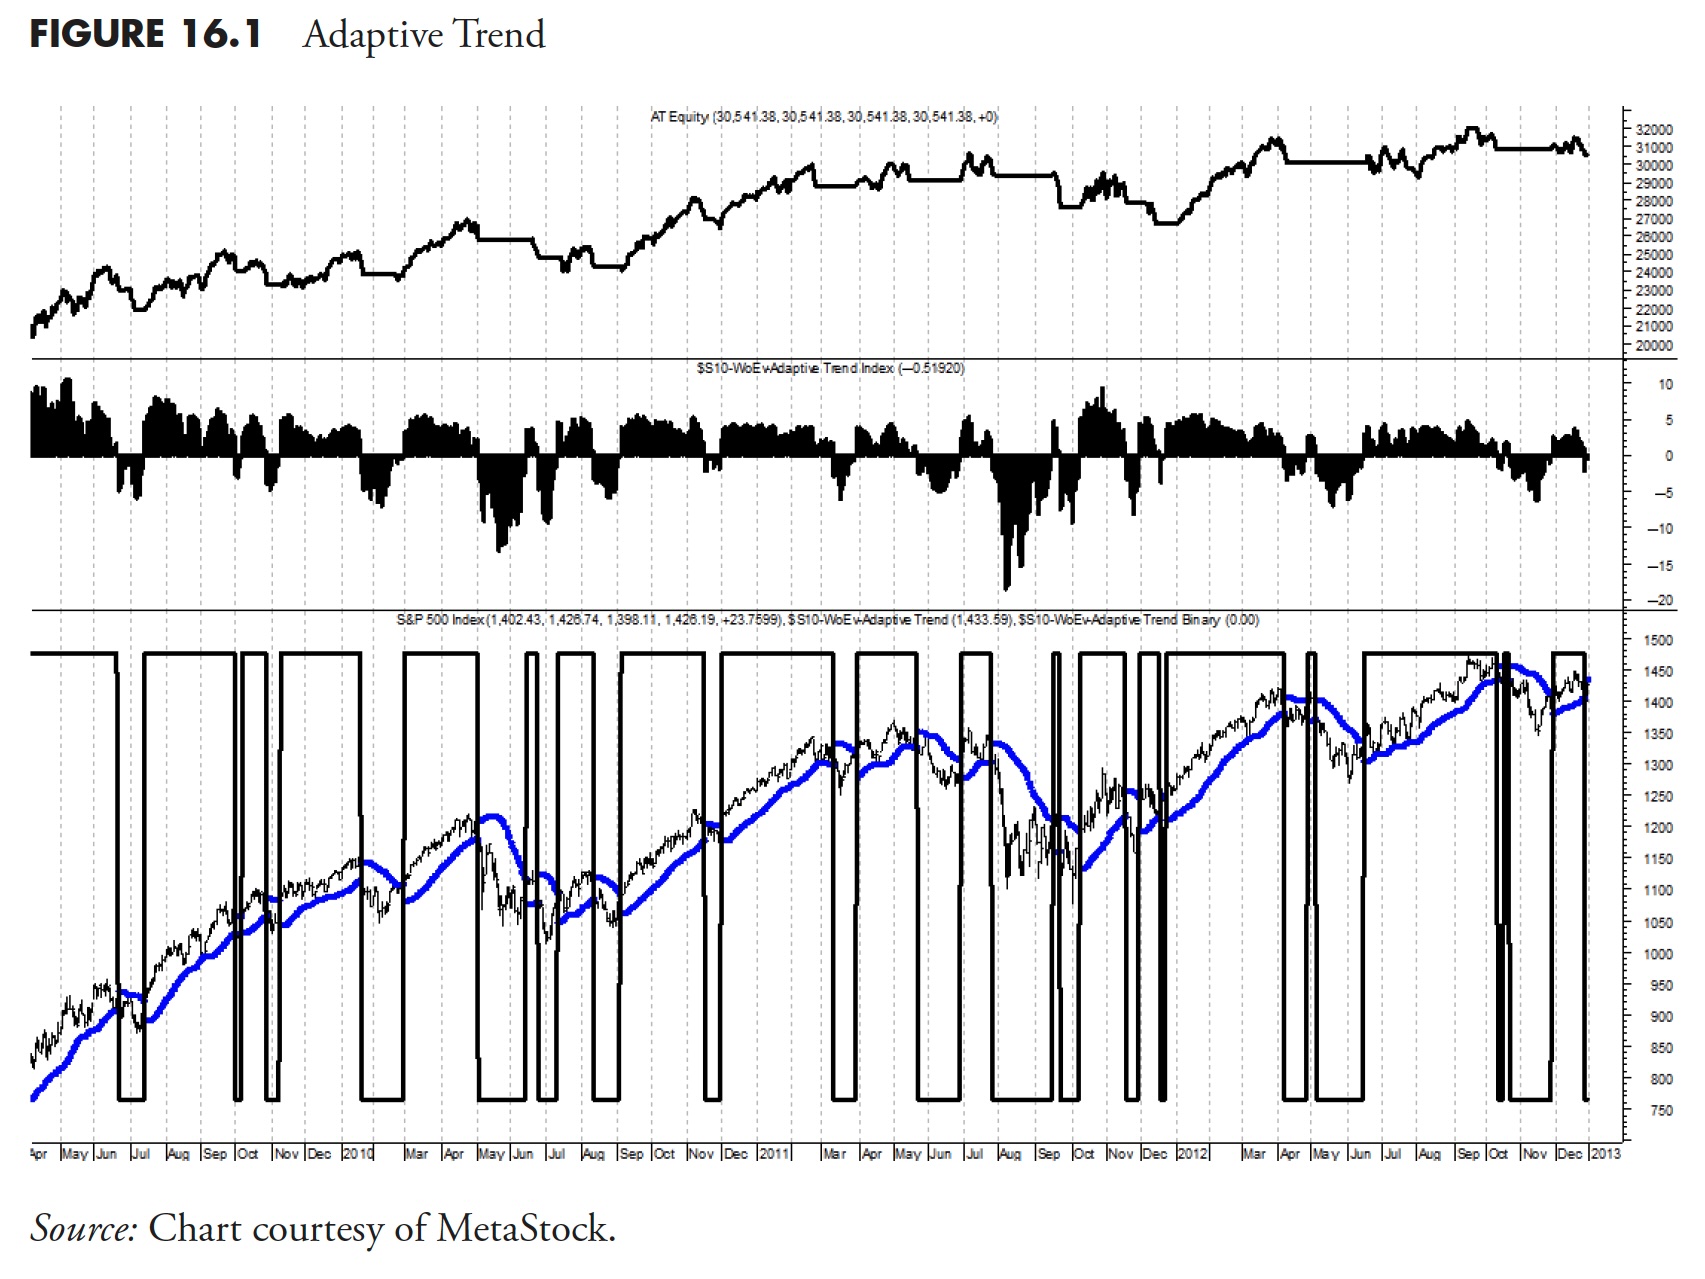
Rules-Based Money Management - Part 8: Putting Trend-Following to Work
by Greg Morris,
Veteran Technical Analyst, Investor, and Author
Note to the reader: This is the twenty-fourth in a series of articles I'm publishing here taken from my book, "Investing with the Trend." Hopefully, you will find this content useful. Market myths are generally perpetuated by repetition, misleading symbolic connections, and the complete ignorance of...
READ MORE
MEMBERS ONLY

3 Keys to Finding the Strongest Trends
by Joe Rabil,
President, Rabil Stock Research
On this week's edition of Stock Talk with Joe Rabil, Joe shows the three keys he hunts for when identifying reversals and strong trends, giving a few examples and then showing one that is developing now. He then highlights similar techniques he uses while reviewing the Sectors. In...
READ MORE
MEMBERS ONLY

Will Spotify Smash Its All-Time High of $387?
by Karl Montevirgen,
The StockCharts Insider
KEY TAKEAWAYS
* Spotify's stock price has been trending higher for the last 16 months
* Spotify's stock price could reach its all-time high
* Analysts project Spotify's stock price to reach $400 in 2024 and $485 in 2025
Music streamer Spotify Technology (SPOT) isn't...
READ MORE
MEMBERS ONLY

A Practical Options Strategy to Trade Home Depot
by Tony Zhang,
Chief Strategist, OptionsPlay
KEY TAKEAWAYS
* To take advantage of Home Depot's stock price decline, try implementing the put vertical spread
* The put vertical spread can lower your risk while you capitalize on the downside move in HD
* By going out to the August expiration, you can open a put vertical for...
READ MORE