MEMBERS ONLY

Missed Out on Micron's 112% Surge? Here's Your Second Chance!

by Karl Montevirgen,
The StockCharts Insider
KEY TAKEAWAYS
* Micron's AI game just got started and is looking to heat up as it provides key components to both Nvidia and Advanced Micro Devices
* MU's price, however, has begun to pull back as bulls look for a favorable entry point
* Using a bearish StockCharts...
READ MORE
MEMBERS ONLY
These Signals Will Improve Your Timing!

by Joe Rabil,
President, Rabil Stock Research
On this week's edition of Stock Talk with Joe Rabil, Joe explains how to use the MACD crossover signal and the Pinch play signal. There are times when one is better than the other, and he uses several examples to show this distinction. He discusses how the low...
READ MORE
MEMBERS ONLY
Market Research and Analysis - Part 1: Why Technical Analysis?

by Greg Morris,
Veteran Technical Analyst, Investor, and Author
Note to the reader: This is the twelfth in a series of articles I'm publishing here taken from my book, "Investing with the Trend." Hopefully, you will find this content useful. Market myths are generally perpetuated by repetition, misleading symbolic connections, and the complete ignorance of...
READ MORE
MEMBERS ONLY

Larry's LIVE "Family Gathering" Webinar Airs NEXT WEEK - Tuesday, March 19th at 2:00pm EDT!
Larry is going LIVE! Don't miss the upcoming "Family Gathering" webinar with Larry Williams, airing live through Zoom on Tuesday, March 19 at 2:00pm Eastern Daylight Time.
In this must-see event, Larry will be presenting his current opinions on a broad variety of current market...
READ MORE
MEMBERS ONLY
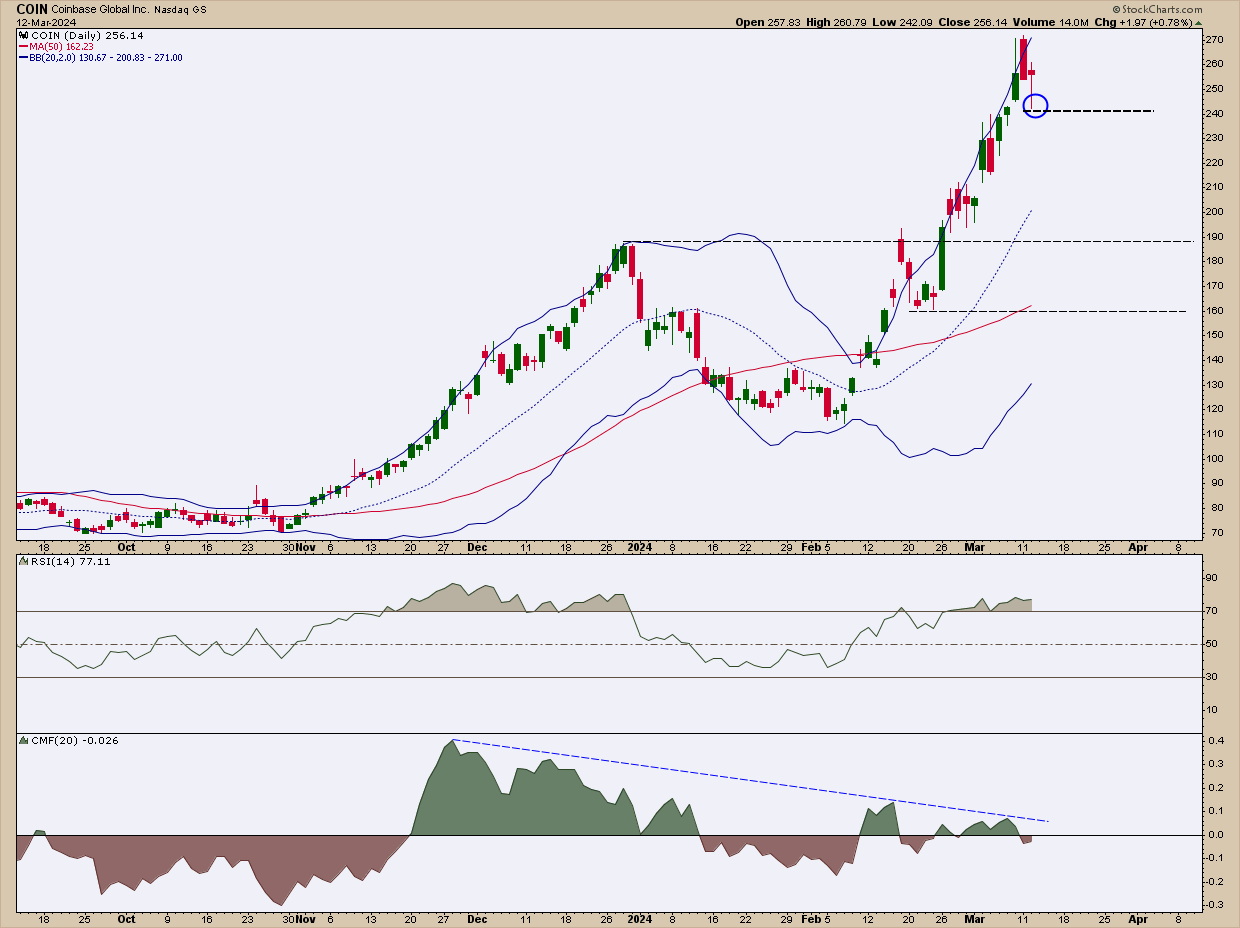
Is Coinbase Stock About to Crater? Here's One Way to Exploit It
by Karl Montevirgen,
The StockCharts Insider
KEY TAKEAWAYS
* Coinbase's (COIN) stock is blasting off, hitting a jaw-dropping 99.6 SCTR score.
* The pin bar (most current bar) seems like a desperate attempt for the bulls to advance the stock amidst being potentially outnumbered by sellers.
* Ready to go on the offensive? Here's...
READ MORE
MEMBERS ONLY

The Business Cycle is Edging its Way to a More Inflationary Stage

by Martin Pring,
President, Pring Research
Last week, I pointed out the inflationary consequences of the recent gold breakout, as gold market participants initially expect prices to firm up in the commodity pits and later the CPI itself. This week, we will take those thoughts a step further by relating swings in industrial commodity prices to...
READ MORE
MEMBERS ONLY

WFC Stock: A Step-By-Step Analysis to Better Time Your Entry

by Jayanthi Gopalakrishnan,
Director of Site Content, StockCharts.com
KEY TAKEAWAYS
* Wells Fargo stock hits a new all-time high
* The Financial sector has been gaining strength with several big bank stocks displaying positive movement
* Momentum in WFC may be strong now but a slowdown could mean a big pullback since the stock is trading above its average price movement...
READ MORE
MEMBERS ONLY
DP Trading Room: Semiconductors - SOXX v. SMH, They're Not the Same

by Erin Swenlin,
Vice President, DecisionPoint.com
Carl and Erin explore the differences between two Semiconductor ETFs, SOXX and SMH. They are NOT the same. One offers far more upside potential than the other. Learn how to easily compare two ETFs or even two stocks using relative strength.
Carl covered the market in general with special attention...
READ MORE
MEMBERS ONLY
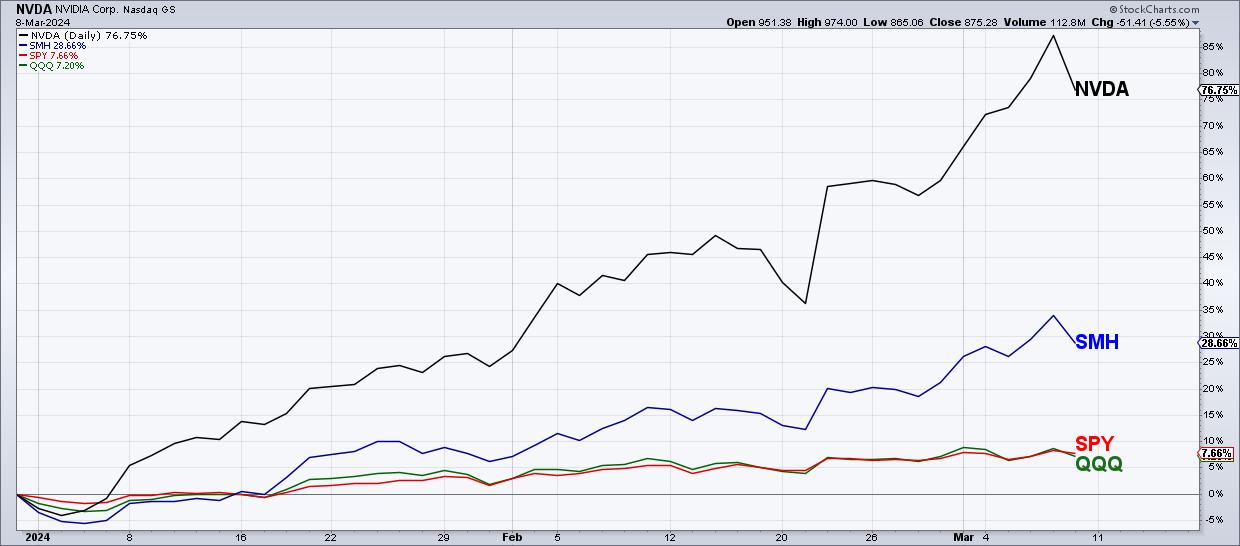
Bearish Engulfing Pattern Marks Top For NVDA?

by David Keller,
President and Chief Strategist, Sierra Alpha Research
KEY TAKEAWAYS
* Nvidia is up 77% year-to-date, far outpacing the S&P 500 and Nasdaq which are both up about 7-8%.
* A bearish engulfing pattern is a two-bar candle pattern indicating short-term distribution and negative sentiment.
* Downside targets for NVDA can be identified using trendlines and Fibonacci retracements.
Large-cap...
READ MORE
MEMBERS ONLY
The Halftime Show: 100th and LAST Show!

by Pete Carmasino,
Chief Market Strategist, Chaikin Analytics
Pete presents the 100th and final edition ofStockCharts TV'sHalftime! This week, Pete shares some parting tips on what to look for when the trends change from defense, (risk off) to offense (risk on). He explains how he saw them coming and how the Chaikin Power Gauge did as...
READ MORE
MEMBERS ONLY

Find Stocks That Are BEATING The S&P 500 - In Just One Click!

by Grayson Roze,
Chief Strategist, StockCharts.com
Feel like you never find those high-flying stocks before they make their big moves? This week's edition of StockCharts TV'sStockCharts in Focus is for you! Grayson walks you through the 3 simple steps he uses to find, track and trade the market's strongest stocks...
READ MORE
MEMBERS ONLY
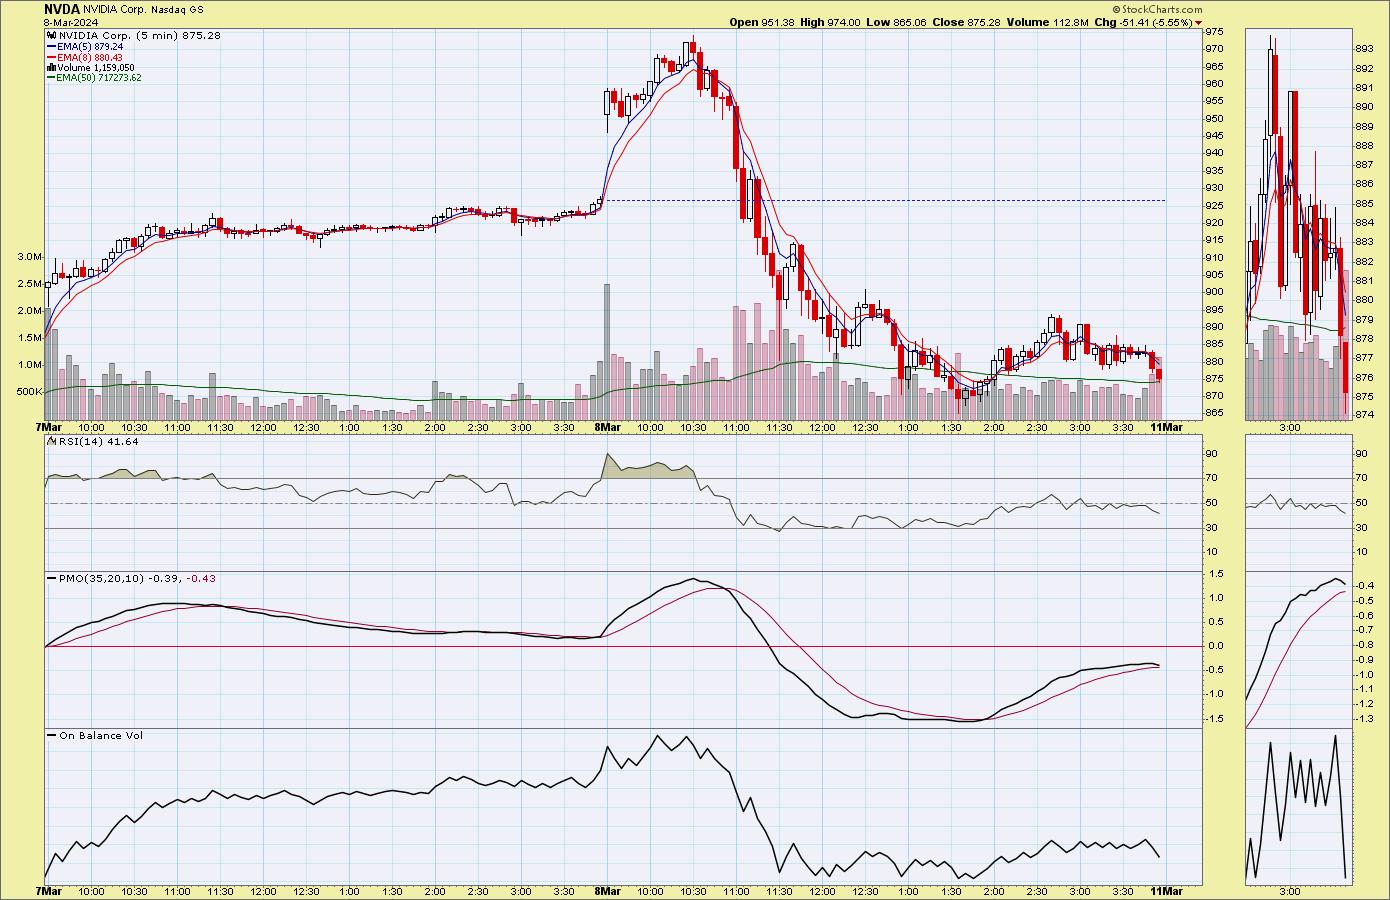
What Happened to NVIDIA (NVDA)?
by Erin Swenlin,
Vice President, DecisionPoint.com
NVIDIA (NVDA) was enjoying quite a rally to start the day. All seemed right with the world. Someone recently said to me, regarding another company, that it was "a victim of its own success." This is what happened to NVDA.
It appears that the ceiling was reached for...
READ MORE
MEMBERS ONLY

Top 10 Actionable Charts to Watch 2024
by David Keller,
President and Chief Strategist, Sierra Alpha Research
by Grayson Roze,
Chief Strategist, StockCharts.com
In this edition of StockCharts TV'sThe Final Bar, Grayson and Dave run through the 10 charts they feel present actionable opportunities based on their technical analysis setups. They'll cover breakout strategies, moving average techniques, relative strength, and much more. And you'll have ten new...
READ MORE
MEMBERS ONLY
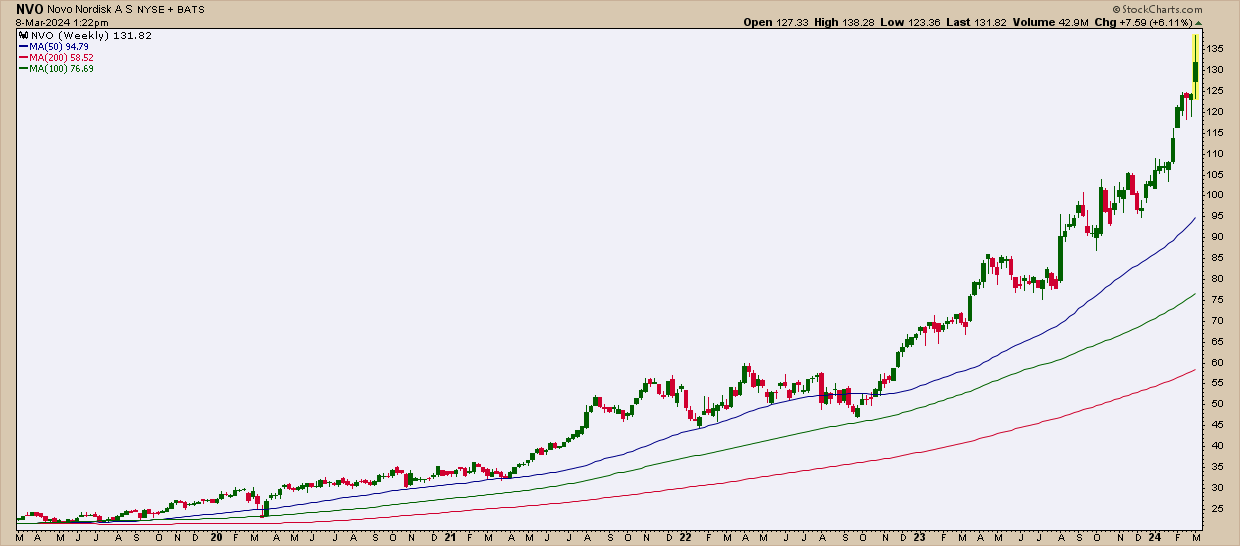
Ozempic Set the Stage, But Could Novo's Newest Drug Be the Real Moneymaker?
by Karl Montevirgen,
The StockCharts Insider
KEY TAKEAWAYS
* Novo Nordisk A/S (NVO) has been riding a strong uptrend since 2017, fueled by its Ozempic drug.
* This last week, positive results for its new drug, amycretin, transformed the Ozempic fever into a Wall Street frenzy.
* Technical and fundamental buy points seem to be at odds if...
READ MORE
MEMBERS ONLY

Clear Split in NY FANG+ Universe Offers Pair Trading Opportunities

by Julius de Kempenaer,
Senior Technical Analyst, StockCharts.com
KEY TAKEAWAYS
* NYFANG+ Index at elevated levels in strong uptrend.
* New long positions are exposed to high risk.
* I found a pair trading opportunity within the NYFANG universe to avoid directional market risk.
It is no secret that the NYFANG+ Index is still in in incredible up-run after bottoming out...
READ MORE
MEMBERS ONLY

How To Stop Missing Trades Using Price Alerts
by Joe Rabil,
President, Rabil Stock Research
On this week's edition of Stock Talk with Joe Rabil, Joe shows how to use StockCharts price and advanced alerts to help you stop missing trades. He explains why he uses alerts of all kinds on stocks he is interested in buying, as well as current holdings. This...
READ MORE
MEMBERS ONLY
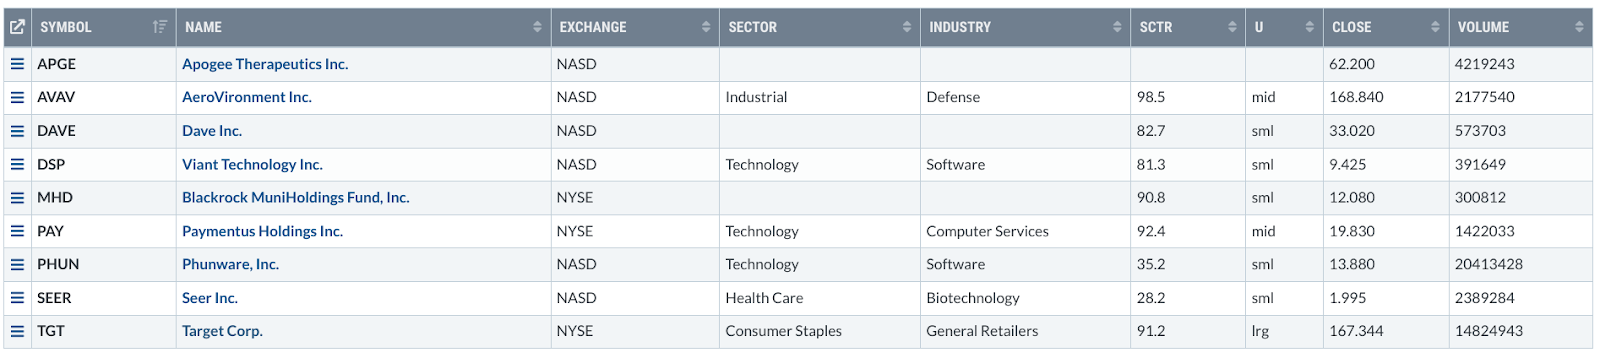
Target's Stock Defied Gravity When the Market Tanked: Timely Buy or FOMO?
by Karl Montevirgen,
The StockCharts Insider
KEY TAKEAWAYS
* Target Corp (TGT) bucked the trend on Tuesday, popping 13% despite a broader market selloff.
* Investors jumped in despite the retailer's weak 2024 guidance.
* A potentially strong entry point for TGT rests on two factors, one technical and the other fundamental.
On Tuesday, Target Corp (TGT)...
READ MORE
MEMBERS ONLY
DP Trading Room: Must See Gold Charts!
by Erin Swenlin,
Vice President, DecisionPoint.com
Carl begins today's show with a walk through General Electric (GE) which was in the news this week. See what Carl thinks of the charts!
Carl covers the market in general and pays particular attention to Gold as it launches skyward. Can this run continue? What does this...
READ MORE
MEMBERS ONLY
How I Found SMCI BEFORE the Stock Gained Over 205% (in 3 Simple Steps!)
by Grayson Roze,
Chief Strategist, StockCharts.com
Feel like you never find those high-flying stocks before they make their big moves? This week's edition of StockCharts TV'sStockCharts in Focus is for you! Grayson walks you through the 3 simple steps he uses to find, track and trade the market's strongest stocks...
READ MORE
MEMBERS ONLY
Could This Stock Be the NEXT NVDA?
by David Keller,
President and Chief Strategist, Sierra Alpha Research
In this edition of StockCharts TV'sThe Final Bar, Dave wraps up his Dubai journey with a special Viewer's Questions Mailbag edition! Dave explores whether LABU is on the path to mimic NVIDIA and if it's still the right time to jump in. He also...
READ MORE
MEMBERS ONLY

Your Selling Methodology is Your Paramedic to Profits

by Gatis Roze,
Author, "Tensile Trading"
"When you feel like bragging, it's probably time to sell." — John Neff
Stock market investing is simple, really. You only need to make two choices: when to buy and when to sell. The unfortunate reality is that 75% of casual investors really only want to hear...
READ MORE
MEMBERS ONLY

Spotting Tradable Pullbacks after Trend Reversing Surges

by Arthur Hill,
Chief Technical Strategist, TrendInvestorPro.com
Most stocks surged with the broader market in the fourth quarter of 2023. SPY and QQQ extended their advances in 2024, but some stocks did not partake and fell back. Even so, some of these stocks show signs of long-term trend reversals and their declines in 2024 look corrective. This...
READ MORE
MEMBERS ONLY
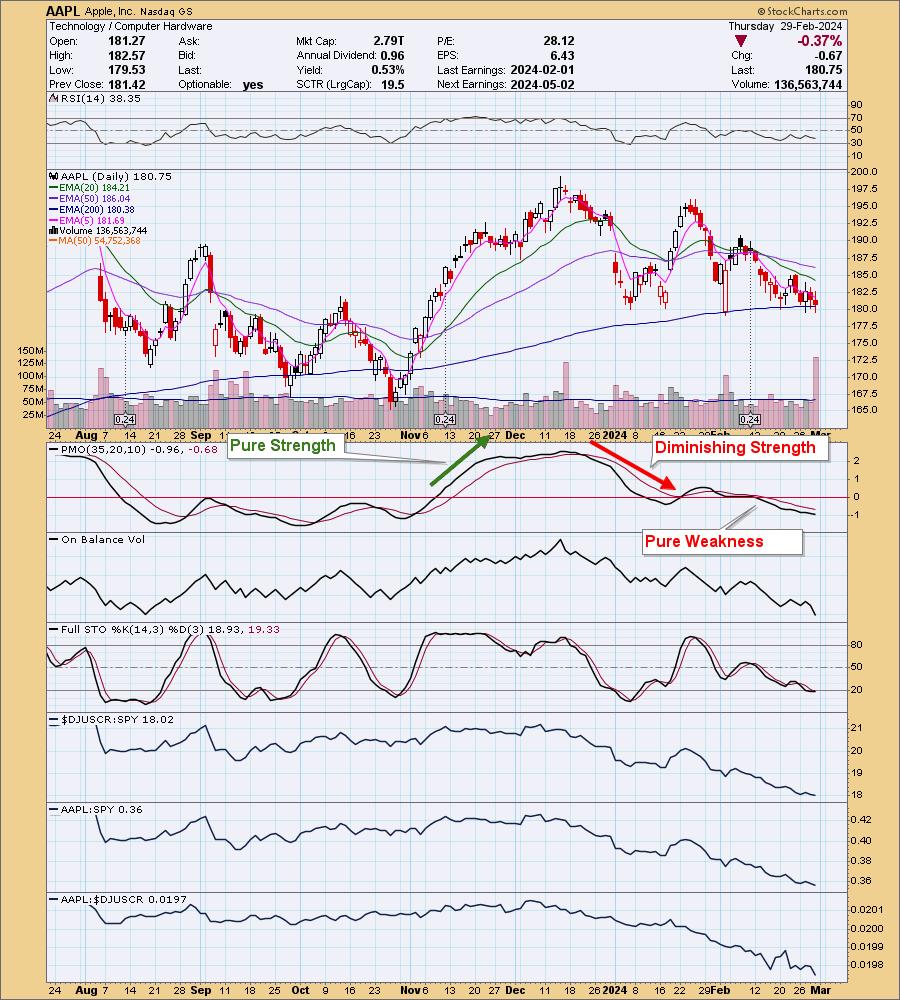
Apple (AAPL) and Google (GOOGL) Flashing "Pure Weakness"
by Erin Swenlin,
Vice President, DecisionPoint.com
We've begun talking more about the Price Momentum Oscillator (PMO) as it relates to finding "pure strength" and "pure weakness". What it all comes down to is the zero line and the PMO's behavior above or below.
We review the Magnificent 7...
READ MORE
MEMBERS ONLY
Swing Trading Strategies, Tips & Trends
by Joe Rabil,
President, Rabil Stock Research

by Bruce Fraser,
Industry-leading "Wyckoffian"
On this week's edition of Stock Talk with Joe Rabil, Joe features special guest, Bruce Fraser of Power Charting. Joe and Bruce discuss swing trading in detail, first by defining swing trading and how it is different from trend trading, and then spending time going through the SIG...
READ MORE
MEMBERS ONLY
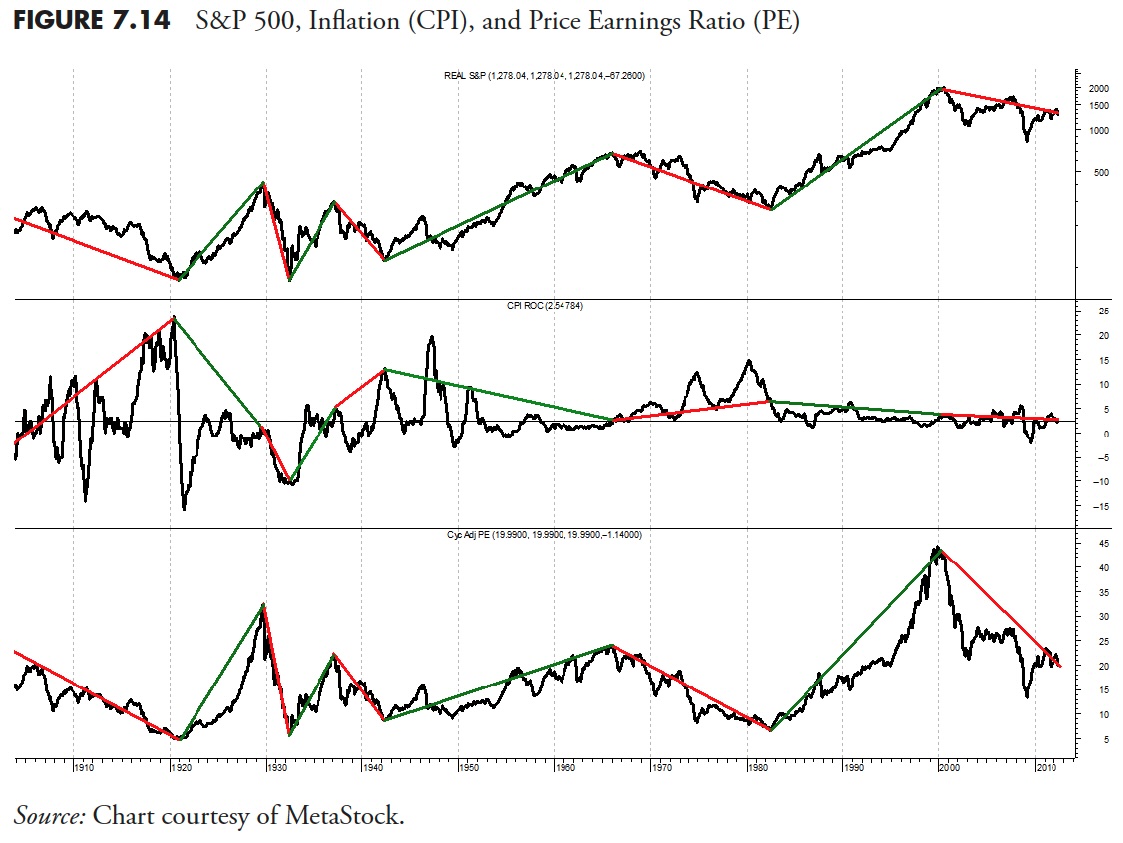
The Hoax of Modern Finance - Part 10: Market Facts — Secular Markets
by Greg Morris,
Veteran Technical Analyst, Investor, and Author
Note to the reader: This is the tenth in a series of articles I'm publishing here taken from my book, "Investing with the Trend." Hopefully, you will find this content useful. Market myths are generally perpetuated by repetition, misleading symbolic connections, and the complete ignorance of...
READ MORE
MEMBERS ONLY

The False Flag of Fed Rate Cuts | Focus on Stocks: March 2024

by Larry Williams,
Veteran Investor and Author
Let's begin this month with a look at...
The False Flag of Fed Rate Cuts
Day after day, we hear how the Fed will embark on a series of rate cuts this year "because inflation has peaked" and is heading lower. The drop in inflation is...
READ MORE
MEMBERS ONLY

Flip the Script: Defense as Your New Offensive Playbook
by Karl Montevirgen,
The StockCharts Insider
KEY TAKEAWAYS
* March is a strong seasonal month for Utilities and Consumer Staples in relation to the broader market
* Utilities and Consumer Staples are defensive plays which, if timed correctly, can result in a positive market outcome
* The StockCharts Seasonality charts can help you identify sector plays that may not...
READ MORE
MEMBERS ONLY
DP Trading Room: The PMO Versus the MACD!
by Erin Swenlin,
Vice President, DecisionPoint.com
Today Carl explains the benefits of using the Price Momentum Oscillator versus the MACD. They are not the same!
Carl then gives us his insights on the market in general as well as Bitcoin news, Magnificent 7 overview, as well as Crude Oil and Interest Rates.
Erin gives us an...
READ MORE
MEMBERS ONLY

MEM TV: Simple Way to Identify a Buy Point in NVDA

by Mary Ellen McGonagle,
President, MEM Investment Research
In this episode of StockCharts TV'sThe MEM Edge, Mary Ellen reviews what drove the markets to new highs and what areas are outperforming. She also shares how to identify a buy point in NVDA after its gap up following earnings, as well as how to determine when a...
READ MORE
MEMBERS ONLY
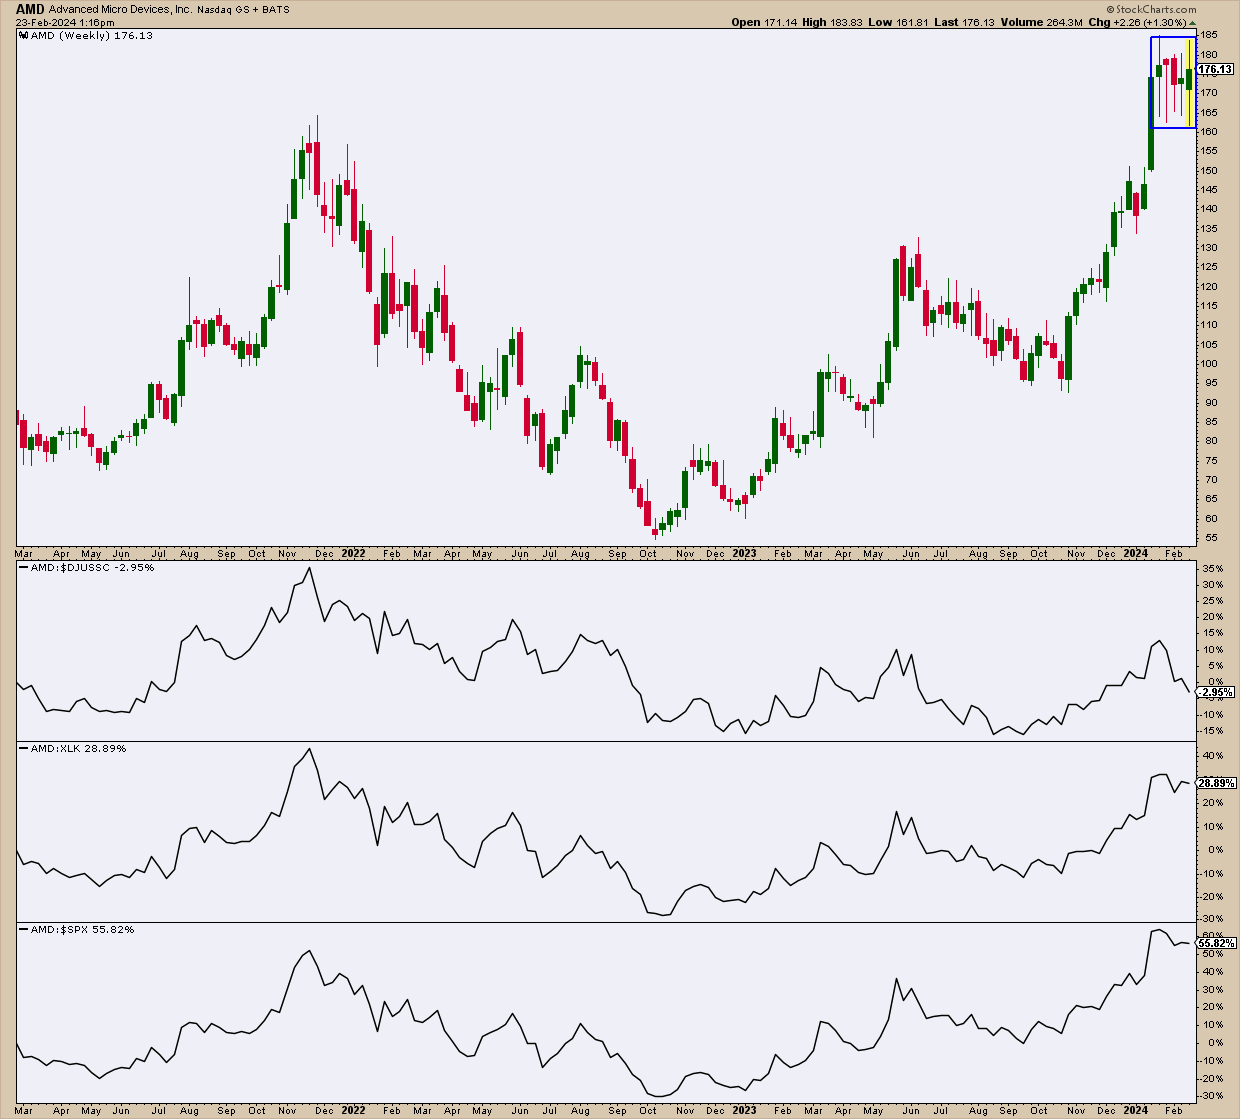
AMD's Sensational Halt — What You Need to Watch
by Karl Montevirgen,
The StockCharts Insider
KEY TAKEAWAYS
* Advanced Micro Devices (AMD) recovered quickly from a post-earnings slump
* Its longer term price action suggests indecision and the current pattern can also break either way
* This can either be a short-term trade or an investment; both scenarios will require different strategies
If you ran a StockCharts Gap...
READ MORE
MEMBERS ONLY

The Best Technical Indicator for Long-Term Investors
by David Keller,
President and Chief Strategist, Sierra Alpha Research
In this edition of StockCharts TV'sThe Final Bar, Dave drops an all-mailbag episode featuring viewer questions on the Hindenburg Omen, ascending triangle patterns, Fibonacci Retracements, projecting upside targets for stocks like NVDA, and the best technical indicator long-term investors should use!
This video originally premiered on February 23,...
READ MORE
MEMBERS ONLY
3 Unique RSI Techniques to Maximize Your Investments
by Joe Rabil,
President, Rabil Stock Research
On this week's edition of Stock Talk with Joe Rabil, Joe dives into the world of technical analysis by sharing three unique ways to utilize the RSI indicator alongside MACD and ADX -- the Pullback Trade, Confirming a Breakout and 2nd Chance Entry. He then covers the symbol...
READ MORE
MEMBERS ONLY
The Hoax of Modern Finance - Part 9: Market Facts — Bull and Bear Markets
by Greg Morris,
Veteran Technical Analyst, Investor, and Author
Note to the reader: This is the ninth in a series of articles I'm publishing here taken from my book, "Investing with the Trend." Hopefully, you will find this content useful. Market myths are generally perpetuated by repetition, misleading symbolic connections, and the complete ignorance of...
READ MORE
MEMBERS ONLY

The Titanic Syndrome Indicator Issues a WARNING!
by David Keller,
President and Chief Strategist, Sierra Alpha Research
In this edition of StockCharts TV'sThe Final Bar, Dave focuses on AAPL which closed below its 200-day moving average as it tests key price support. Guest Jesse Felder of The Felder Report reports on the Titanic Syndrome, a market breadth indicator similar to the Hindenburg Omen that suggests...
READ MORE
MEMBERS ONLY

Capturing the Momentum Phenomenon - Nvidia vs Tesla
by Arthur Hill,
Chief Technical Strategist, TrendInvestorPro.com
The momentum phenomenon has been a fixture in the US equity markets for decades. There are two types of momentum to consider: absolute momentum and relative momentum. Absolute momentum refers to the underlying trend, up or down. Relative momentum quantifies the strength of the uptrend and compares it to other...
READ MORE
MEMBERS ONLY

What to Do With NVDA (And Others Like It)
by David Keller,
President and Chief Strategist, Sierra Alpha Research
In this edition of StockCharts TV'sThe Final Bar, Dave answers viewer questions on the Money Flow Index, using RSP vs. SPY for relative strength analysis, strategies for names in extended uptrends like NVDA, applying Fibonacci retracements to charts like KRE, and more.
This video originally premiered on February...
READ MORE
MEMBERS ONLY

Discover the Power of These 2 Cutting-Edge Tools!
by Grayson Roze,
Chief Strategist, StockCharts.com
It's all about groups on this week's edition of StockCharts TV'sStockCharts in Focus! In this video, Grayson shows you how to take your market analysis to the next with level with some of the latest enhancements on the StockCharts platform -- new features added...
READ MORE
MEMBERS ONLY

DraftKings' Stock Overheating? Here's What You Need to Do Now
by Karl Montevirgen,
The StockCharts Insider
KEY TAKEAWAYS
* DraftKings has demonstrated significant revenue growth following a lengthy period of outperformance relative to the S&P 500 and its respective sector and industry
* DraftKings' stock is overbought, with a declining RSI suggesting near term market correction
* Set a price alert to measure an anticipated pullback...
READ MORE
MEMBERS ONLY
SMCI Breaks $1,000 Level - What's Next?
by David Keller,
President and Chief Strategist, Sierra Alpha Research
In this edition of StockCharts TV'sThe Final Bar, Bob Lang of Explosive Options shares three charts he's following as the S&P 500 continues to hold the crucial 5,000 level. Host David Keller, CMT highlights key stocks on the earnings list, including DKNG, COIN,...
READ MORE
MEMBERS ONLY
Identifying Powerful Trends with This Game-Changing ADX Setup
by Joe Rabil,
President, Rabil Stock Research
On this week's edition of Stock Talk with Joe Rabil, Joe shares the criteria for his favorite ADX setup. He explains what he needs to see on 2 different timeframes to put a stock into position for a powerful trend that can last a long time. Joe closes...
READ MORE