MEMBERS ONLY
Financials Light up Market Carpet
by Arthur Hill,
Chief Technical Strategist, TrendInvestorPro.com
The Financial sector lit up the Market Carpet on Monday with the most green. Three of the top five gainers came from the Financial sector. The consumer discretionary sector was second with two of the top five gainers on Monday.
Click this chart for more details....
READ MORE
MEMBERS ONLY
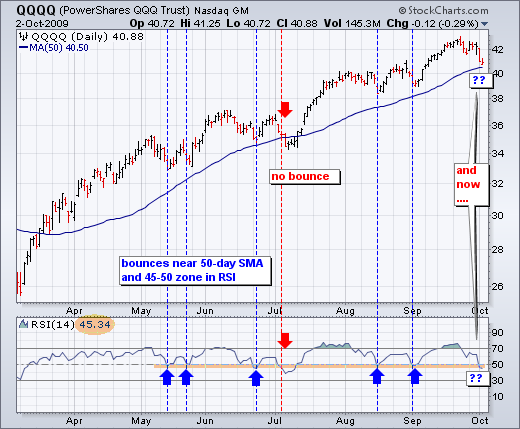
QQQQ Tests the 50-day
by Arthur Hill,
Chief Technical Strategist, TrendInvestorPro.com
With a sharp decline over the last eight days, the Nasdaq 100 ETF (QQQQ) is testing support from the rising 50-day moving average and RSI is testing support around 45-50. QQQQ broke the 50-day moving average briefly in July, but held the 50-day during the May,...
READ MORE
MEMBERS ONLY
Dow Tests 50-day Moving Average
by Arthur Hill,
Chief Technical Strategist, TrendInvestorPro.com
With a sharp decline the last seven days, the Dow Industrials is testing is 50-day moving average, which is currently at 9457. This is the first test of the moving average since the Dow surged in mid July.
Click this chart for details....
READ MORE
MEMBERS ONLY
Make-or-Break Time for Key Indicators
by Arthur Hill,
Chief Technical Strategist, TrendInvestorPro.com
-Medium-term evidence remains bullish
-Wave 4 Hits the 50% Retracement
-Key Supports for SPY, QQQQ and IWM
-SPY is Already Short-term Oversold
-Volatility Indices Surge to Resistance
-Momentum Indicators Remain Bullish Overall
-McClellan Oscillators Turn Bearish
-Stocks and Bonds Disconnect
-China and Japan Lag
-Stocks: ADSK, AMZN, ANF,...
READ MORE
MEMBERS ONLY
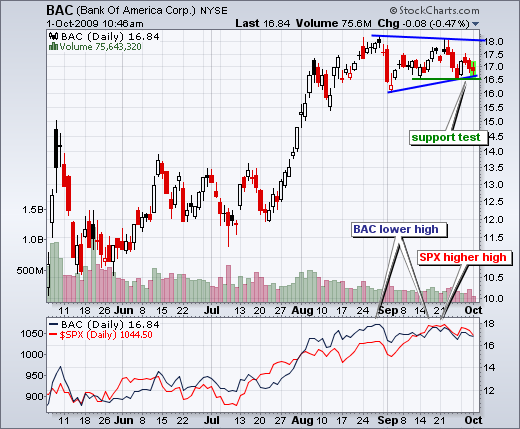
BAC Tests Support
by Arthur Hill,
Chief Technical Strategist, TrendInvestorPro.com
Bank of America (BAC) is testing support around 16.5 as the stock starts showing relative weakness. Support around 16.5 stems from the mid September lows and triangle trendline. BAC shows relative weakness because the stock failed to exceed its August high, but the S&P 500 formed...
READ MORE
MEMBERS ONLY
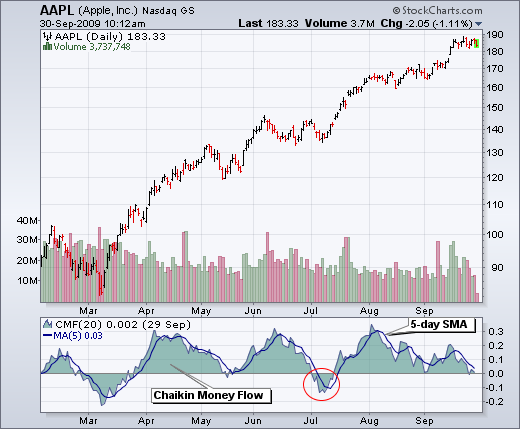
Money Flows Near Zero for Apple
by Arthur Hill,
Chief Technical Strategist, TrendInvestorPro.com
Chaikin Money Flow for Apple (AAPL) has been positive from mid July to late September. There was a brief dip into negative territory last week, but Chaikin Money Flow recovered on Monday. Nevertheless, the 5-day SMA of the indicator is perilously close to turning negative for the time since...
READ MORE
MEMBERS ONLY
A Bullish PnF Chart for Activision
by Arthur Hill,
Chief Technical Strategist, TrendInvestorPro.com
This long-term PnF chart for Activision extends back to 2003 when the stock was trading in the low single digits. After rising above 19, the stock went into corrective mode in 2008 and broke out in 2009. With the May-June (5-6 on the chart) breakout, ATVI has...
READ MORE
MEMBERS ONLY
SPY Bounces, But Hits Key Retracement
by Arthur Hill,
Chief Technical Strategist, TrendInvestorPro.com
-SPY Bounces After Indecision
-SPY Hits Key retracement on Intraday Chart
-China and Japan Lag
-Net Advancing Volume Not that Strong
-Transport ETF Tests Broken Resistance
-Bollinger Bands Tighten for SMH
-Autonation (AN) Hits Support
-Ford (F) Breaks Wedge Resistance
-Gilead (GILD) Maintains Uptrend
-Intuit (INTU) Bounces off Support
-Lowe&...
READ MORE
MEMBERS ONLY
China and Japan Lag
by Arthur Hill,
Chief Technical Strategist, TrendInvestorPro.com
Since early July, the Shanghai Composite ($SSEC) and the Nikkei 225 ($NIKK) have been lagging western European stock markets and the US. The PerfChart below shows the Shanghai Composite is actually down since July and the Nikkei is barely positive. In contrast, the US and western European indices are up...
READ MORE
MEMBERS ONLY
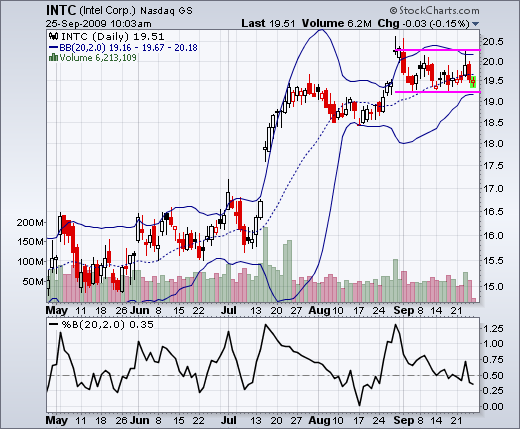
A Bollinger Band Contraction for Intel
by Arthur Hill,
Chief Technical Strategist, TrendInvestorPro.com
Bollinger Bands have been contracting as Intel (INTC) consolidates over the last few weeks. The theory behind Bollinger Bands is that volatility contractions often give way to volatility expansions. Look for a range break to trigger the next directional signal.
Click this chart for details....
READ MORE
MEMBERS ONLY
A Post-Fed Blip in the Uptrend
by Arthur Hill,
Chief Technical Strategist, TrendInvestorPro.com
-Bulk of the Evidence Remains Bullish
-A Blip in the Uptrend
-Playing Short-term Pullbacks
-Big Picture Review
-Nasdaq McClellan Oscillator Lags
-Volatility Indices Testing Lows
-Dollar Gets Oversold Bounce
-Crude Breaks Support
-Gold Slips as Dollar Bounces
-Bonds Firm as Stocks Fall
-Breakouts Not Holding (ERTS and AZO)
-Click...
READ MORE
MEMBERS ONLY
An Outside Reversal Day for SPY
by Arthur Hill,
Chief Technical Strategist, TrendInvestorPro.com
The bears were given something to chew on with an outside reversal day for SPY. First, a reversal formed when Wednesday's high was above Tuesday's high and Wednesday's close was below Tuesday's close. Second, an outside day occurred because Wednesday's...
READ MORE
MEMBERS ONLY
New Highs Outpacing New Lows
by Arthur Hill,
Chief Technical Strategist, TrendInvestorPro.com
The predefined scan page provides a quick glimpse of underlying strength or weakness in the stock market. At the top of this page, new 52-week highs are comfortably outpacing new 52-week lows. Click the number (129 Nasdaq and 163 NYSE) to see a list of market leading stocks....
READ MORE
MEMBERS ONLY
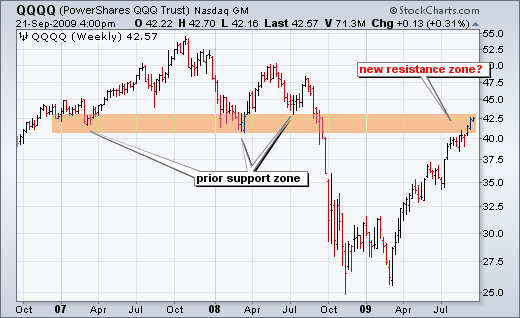
QQQQ Hits Prior Support Zone
by Arthur Hill,
Chief Technical Strategist, TrendInvestorPro.com
Broken support turns into resistance. This basic tenet of technical analysis will be getting a test as the Nasdaq 100 ETF (QQQQ) reached broken support. For now, I would consider this "potential" resistance because the trend since March is clearly up.
Click this chart for details....
READ MORE
MEMBERS ONLY
Uptrend and Dollar Dominate Stocks
by Arthur Hill,
Chief Technical Strategist, TrendInvestorPro.com
-Medium-term uptrend dominates decisions
-SPY is short-term overbought
-SPY forms bull flag on 60-minute chart
-Euro and stocks zigzag together
-Oil falls from resistance
-Bonds cue from commodities
-ATVI surges off support
-ERTS stalls at key retracement
-DYN breaks channel resistance
-HBAN battles breakout
-KEY pulls back...
READ MORE
MEMBERS ONLY
XLY Becomes Overbought and Stalls
by Arthur Hill,
Chief Technical Strategist, TrendInvestorPro.com
The Consumer Discretionary SPDR (XLY) surged over 10% this month and then stalled with two doji at the end of last week. These candlesticks signal indecision that can foreshadow a short-term pullback. Also notice that 14-day RSI moved above 70 to become overbought for the first time since...
READ MORE
MEMBERS ONLY
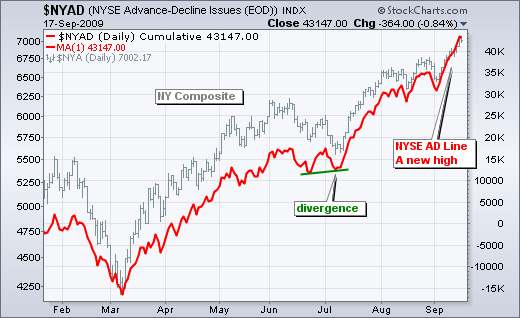
Breadth Remains Bullish
by Arthur Hill,
Chief Technical Strategist, TrendInvestorPro.com
With a surge over the last two weeks, the AD Line and AD Volume Line for the NYSE hit new reaction highs. The first chart shows the NYSE AD Line moving above its August highs with a sharp advance this month. The AD Line is a cumulative measure of Net...
READ MORE
MEMBERS ONLY
Precious Metals Lead Rydex Funds
by Arthur Hill,
Chief Technical Strategist, TrendInvestorPro.com
The Rydex Mutual Funds Market Carpet focuses on the 17 sector funds. September is all about hard assets. The leading sector funds are precious metals, energy services, basic materials and energy. Consumer produces, utilities and healthcare show the smallest gains.
Click this chart for details....
READ MORE
MEMBERS ONLY
Wave 4 Uptrend Remains in Place
by Arthur Hill,
Chief Technical Strategist, TrendInvestorPro.com
-Evidence Remains Bullish For Stocks
-Wave 4 is Still Possible (me thinks)
-Current Uptrend is Still Actual (me knows)
-Net New Highs Expand Further
-Tech Sector0 Shows Relative Weakness
-AD Lines and AD Volume Lines Hit New Highs
-Volatility Indices Hit New Reaction Lows
-Stocks: XOM, APOL, AZO
-Video Link...
READ MORE
MEMBERS ONLY
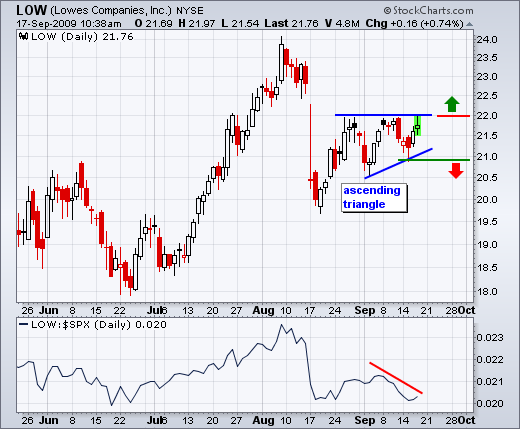
Lowe's is Lagging
by Arthur Hill,
Chief Technical Strategist, TrendInvestorPro.com
While the stock market moved higher the last two weeks, Lowe's (LOW) failed to break above resistance at 22 and showed relative weakness. A potentially bullish ascending triangle is taking shape, but a breakout is needed for confirmation. Conversely, a break below this week's low would...
READ MORE
MEMBERS ONLY
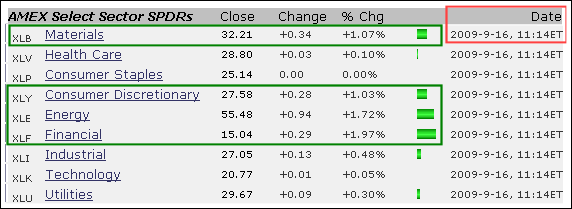
A Bullish Start on Wednesday
by Arthur Hill,
Chief Technical Strategist, TrendInvestorPro.com
A look at the Market Summary page on Wednesday, September 16th, at 11:14AM ET shows a bullish start for some key sector SPDRs. The Materials SPDR (XLB), Consumer Discretionary SPDR (XLY), Energy SPDR (XLE) and Financials SPDR (XLF) are all up over 1% in early trading. At the top...
READ MORE
MEMBERS ONLY
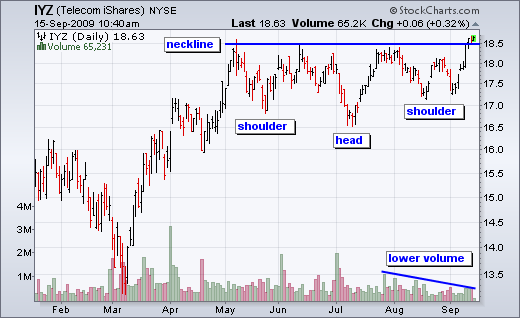
IYZ Challenges Resistance
by Arthur Hill,
Chief Technical Strategist, TrendInvestorPro.com
The iShares Telecom ETF (IYZ) is challenging neckline resistance of an inverse head-and-shoulders pattern. The head-and-shoulders represents a big consolidation and the break to new highs is positive. However, declining volume on the Aug-Sep advance is a concern.
Click this chart for details....
READ MORE
MEMBERS ONLY
Moving into a Zigzag Uptrend
by Arthur Hill,
Chief Technical Strategist, TrendInvestorPro.com
-SPY Zigzags After July Surge
-SPY Stochastic is Short-term Overbought
-Stocks and Dollar Do Inverse Dance
-Oil Fails to Capitalize on Dollar Weakness
-XLE and OIH Hit Resistance Zones
-XOM Forms Triangle with Relative Weakness
-Falling Agriculture Prices Could Affect ADM
-Stocks: BG, GENZ, IMN, LMT and MOS
-Click...
READ MORE
MEMBERS ONLY
PnF Objective is Bullish for Gold
by Arthur Hill,
Chief Technical Strategist, TrendInvestorPro.com
The Point&Figure chart for the Gold ETF (GLD) is bullish with an upside target at 105. PnF Charts at Stockcharts.com show bullish or bearish price objectives above the chart on the left. GLD broke above its prior highs and clearly shows strength.
Click this chart for details....
READ MORE
MEMBERS ONLY
FXB Gets A Momentum Surge
by Arthur Hill,
Chief Technical Strategist, TrendInvestorPro.com
The British Pound ETF (FXB) came across the Commodity Channel Index scan as the indicator surged above 100. While some may consider CCI overbought when above 100, it is also a show of strength when CCI moved from -100 to +100 in less than two weeks.
Click this chart for...
READ MORE
MEMBERS ONLY
Breadth & Dollar Keep Stocks in Bull Mode
by Arthur Hill,
Chief Technical Strategist, TrendInvestorPro.com
-Evidence Remains Bullish For Stocks
-Weak Dollar Helps Stocks and Commodities
-Major index ETFs Hit New Reaction Highs
-Breadth Remains Bullish Overall
-Small-caps Leading Large-caps
-Nasdaq Lagging NY Composite
-Stocks: ACS, ADSK, APD, ATVI, DVN, HRB, RTN, S, VZ
-Link to today's video (click here)
-Next...
READ MORE
MEMBERS ONLY
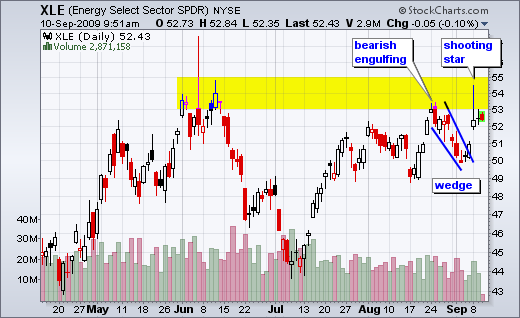
XLE Hits Resistance
by Arthur Hill,
Chief Technical Strategist, TrendInvestorPro.com
The Energy SPDR (XLE) broke above wedge resistance with a big gap on Tuesday, but formed a shooting star candlestick on the day. Notice the spike and failure to hold above 54 intraday. Resistance in the 53-55 area is also confirmed by a bearish engulfing in late August.
Click...
READ MORE
MEMBERS ONLY
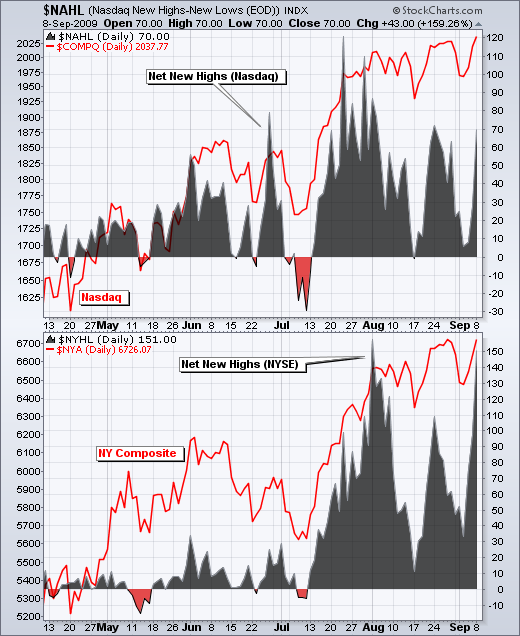
Net New Highs Stay Positive
by Arthur Hill,
Chief Technical Strategist, TrendInvestorPro.com
Net New Highs for both the Nasdaq and the NYSE remain positive. Net New Highs equals new 52-week highs less new 52-week lows. The last dip into negative territory occurred in early July. With Tuesday's surge, Net New Highs on the NYSE hit +151 and Net...
READ MORE
MEMBERS ONLY
A Cup-with-Handle for SLX
by Arthur Hill,
Chief Technical Strategist, TrendInvestorPro.com
After a big advance from March to June, the Market Vectors Steel ETF (SLX) formed a classic cup-with-handle pattern. This is a bullish continuation pattern that would be confirmed with a break above rim resistance. Conversely, a break below the August lows would call for a reassessment.
Click...
READ MORE
MEMBERS ONLY
August-September Lows Mark Key Support
by Arthur Hill,
Chief Technical Strategist, TrendInvestorPro.com
-Market Overview
-RSI Holds for QQQQ
-August Lows Mark Key Support
-Defensive Sectors and Technology Lagging
-XLB and XLY Hold Breakouts
-OIH forms Falling Flag
-KRE Hits Key Retracement
-IYT and IYR Bounce off August Lows
-Stocks: AA, DRI, DRYS, EXPD, RIG, SLE, XTO
-Link to today's video....
READ MORE
MEMBERS ONLY
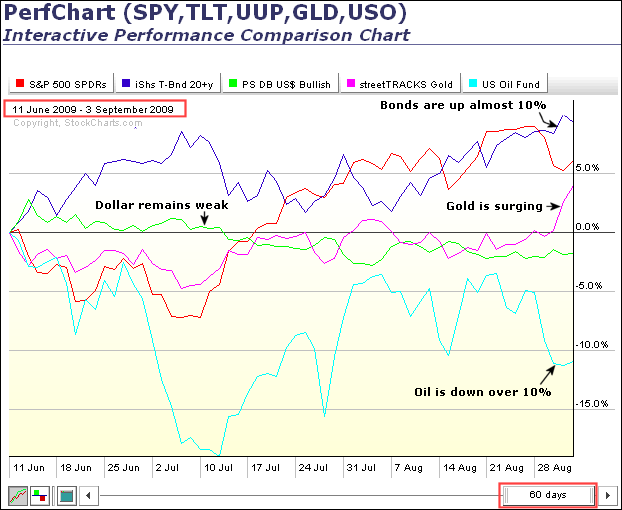
BONDS AND GOLD LEAD THE WAY HIGHER
by Arthur Hill,
Chief Technical Strategist, TrendInvestorPro.com
Intermarket analysis shows strength in bonds and gold, but weakness in the Dollar and oil. Strange days indeed. The Intermarket Perfchart below shows performance over the last sixty days, from June 11th to September 3rd. Relative strength in bonds is the first thing that jumps out. Performance for the 20+...
READ MORE
MEMBERS ONLY
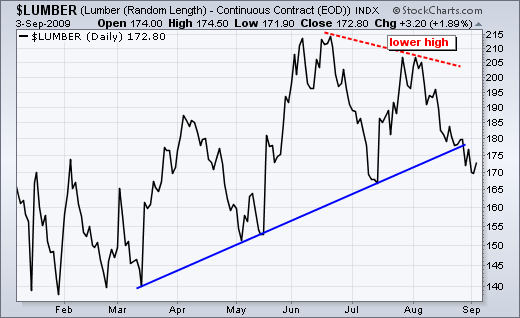
Lumber Forms Lower High
by Arthur Hill,
Chief Technical Strategist, TrendInvestorPro.com
Lumber Continuous Futures ($LUMBER) did not have a good August. Lumber formed a lower high in early August and moved lower throughout the month. As a key component in housing, lumber should be watched for clues on the homebuilders and the economy. Other futures contracts available at Stockcharts.com include...
READ MORE
MEMBERS ONLY
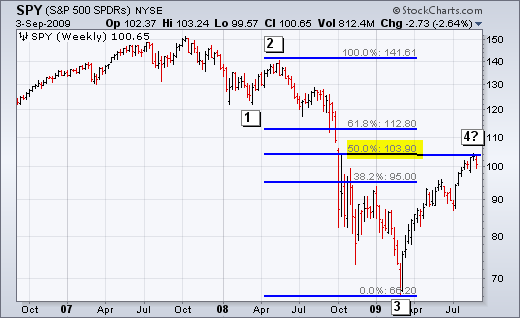
Wave 4 Continues Up for SPY
by Arthur Hill,
Chief Technical Strategist, TrendInvestorPro.com
-SPY Nears Long-term Retracement
-Current Advance Looks Like Wave 4
-Momentum Wanes on Daily SPY Chart
-Net New Highs Form Negative Divergence
-AD Lines and AD Volume Lines Remain Bullish
-McClellan Oscillator Turn Bearish
-Volatility Indices Break Resistance
-Link to today's video
-Next update: September 8th (Tuesday)...
READ MORE
MEMBERS ONLY
XLB Tests Support
by Arthur Hill,
Chief Technical Strategist, TrendInvestorPro.com
After breaking above resistance in July, the Materials SPDR (XLB) moved into a holding pattern as broken resistance turned into support. Notice how the ETF bounced off 28.5 in mid August and is testing this level again in early September. A move below support would show weakness.
Click this...
READ MORE
MEMBERS ONLY
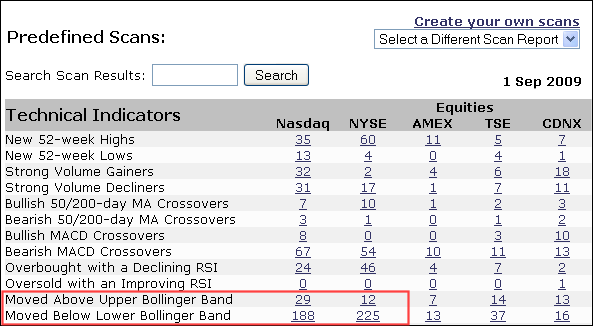
Info from the Bollinger Band Scan
by Arthur Hill,
Chief Technical Strategist, TrendInvestorPro.com
Stockcharts.com provides a number of pre-defined scans using classic indicators. In particular, I always keep an eye on the Bollinger Band scan that shows stocks moving above their upper band and stocks moving below their lower band. Selling pressure is picking up as many more stocks moved below...
READ MORE
MEMBERS ONLY
Financials Back in Spotlight
by Arthur Hill,
Chief Technical Strategist, TrendInvestorPro.com
A look at the Market Carpet on Tuesday (11AM ET) shows the finance sector with the most red. In addition, four of the top five losers in the S&P 500 come from the finance sector. Notice the numbered red squares (2-5). Technology is holding up the best...
READ MORE
MEMBERS ONLY
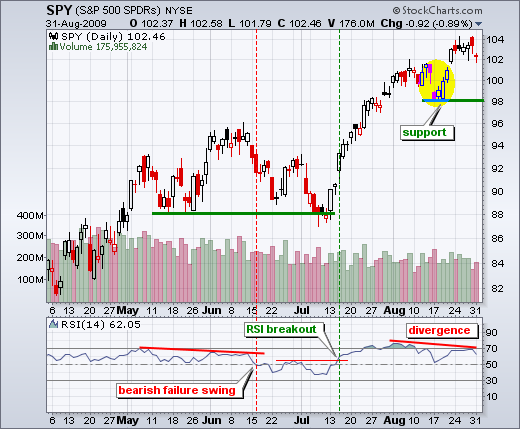
Negative Divergences and Weakness in China
by Arthur Hill,
Chief Technical Strategist, TrendInvestorPro.com
-Back in the Saddle
-RSI Negative Divergence for SPY
-China Could Foreshadow Market Top
-Nasdaq Lagging NY Composite
-Interest Rates Continue to Fall
-Dollar Remains in Quiet Downtrend
-Gold Stalls Around 950
-Video Includes some Stock Setups
-Link to today's video
The next update will be September 4th...
READ MORE
MEMBERS ONLY
Hang Seng Lagging S&P 500
by Arthur Hill,
Chief Technical Strategist, TrendInvestorPro.com
While the S&P 500 sports a small gain for the month of August, the Hong Kong Hang Seng Index ($HSI) is actually down and lagging. The S&P 500 (black) moved above its early August high last week, but the Hang Seng Index (red) formed a lower...
READ MORE
MEMBERS ONLY
When to Ignore Gaps
by Arthur Hill,
Chief Technical Strategist, TrendInvestorPro.com
Nokia is a $49 billion company that trades on the NYSE - as an ADS (American Depository Shares). Nokia also happens to trade on the Nasdaq OMX Helsinki. Yes, Nasdaq bought the Helsinki exchange. Anyhow, this means Nokia starts trading long before the NYSE opens. Because prices have already moved in...
READ MORE
MEMBERS ONLY
Combining Factors
by Arthur Hill,
Chief Technical Strategist, TrendInvestorPro.com
Candlesticks are more powerful when combined with other aspects of technical analysis. Noble Energy (NE) gapped down and formed a hammer in early July. Over the next two days, a piercing pattern formed to further affirm support around 28. The catalyst came when the stock surged above 29 with good...
READ MORE