MEMBERS ONLY
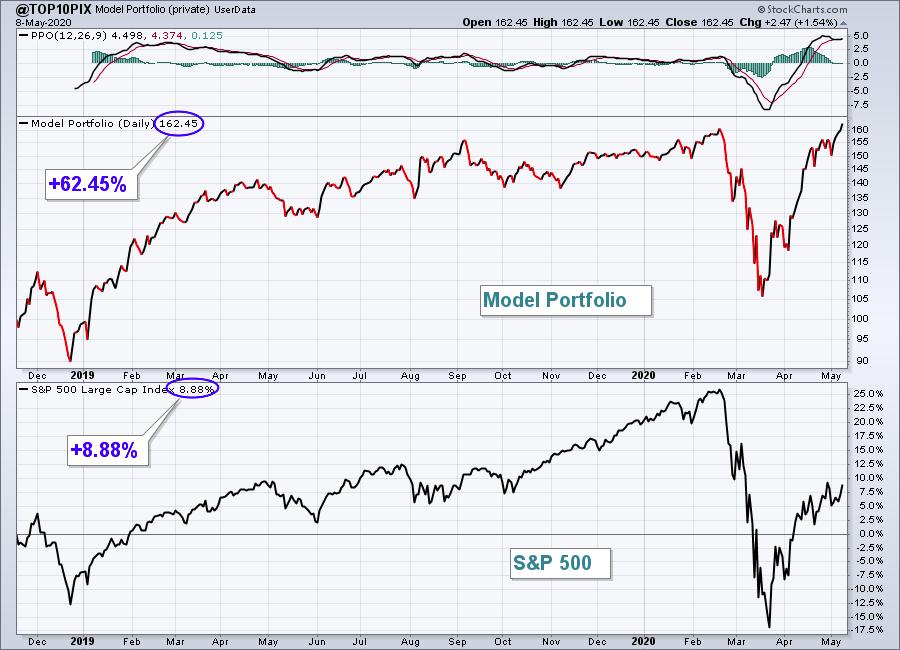
My Model Portfolio Hit an All-Time High Friday - Here are its 10 Component Stocks

by Tom Bowley,
Chief Market Strategist, EarningsBeats.com
The S&P 500 closed at an all-time high on February 19, 2020 when it reached 3386.15. At its Friday close of 2929.80, the benchmark index remained 456.35 points, or 13.48%, shy of that high. February 19th was also the date that I announced our...
READ MORE
MEMBERS ONLY
Three Traits that Will Tell You Your Stock is Poised To Trade Much Higher

by Mary Ellen McGonagle,
President, MEM Investment Research
It's been quite a week for the markets, as a gradual reopening from a global lockdown has investors hopeful that economic damage from the pandemic might be stemmed.
And while the S&P 500 posted a healthy gain for the week, it's the Tech-heavy Nasdaq...
READ MORE
MEMBERS ONLY
Breadth Improves as Uptrend Persists

by David Keller,
President and Chief Strategist, Sierra Alpha Research
Most of my guests in recent weeks on The Final Barhave embraced the "we're due for a pullback" thesis. From the very bullish (S&P 3600) to the quite bearish (S&P 2000) and everyone in between, it seems most people feel that the...
READ MORE
MEMBERS ONLY

How to Take Advantage of Global Paradigm Shifts
by Mary Ellen McGonagle,
President, MEM Investment Research
In this episode of StockCharts TV'sThe MEM Edge, Mary Ellen reviews outperforming growth areas of the market. She also shares ways to easily spot money flows into newer areas and the characteristics that point to further upside.
This video was originally recorded on May 7th, 2020. Click on...
READ MORE
MEMBERS ONLY
This Reliable Long-Term Indicator Could Go Bullish at the End of the Month

by Martin Pring,
President, Pring Research
Sixty-Five Year Record of Success
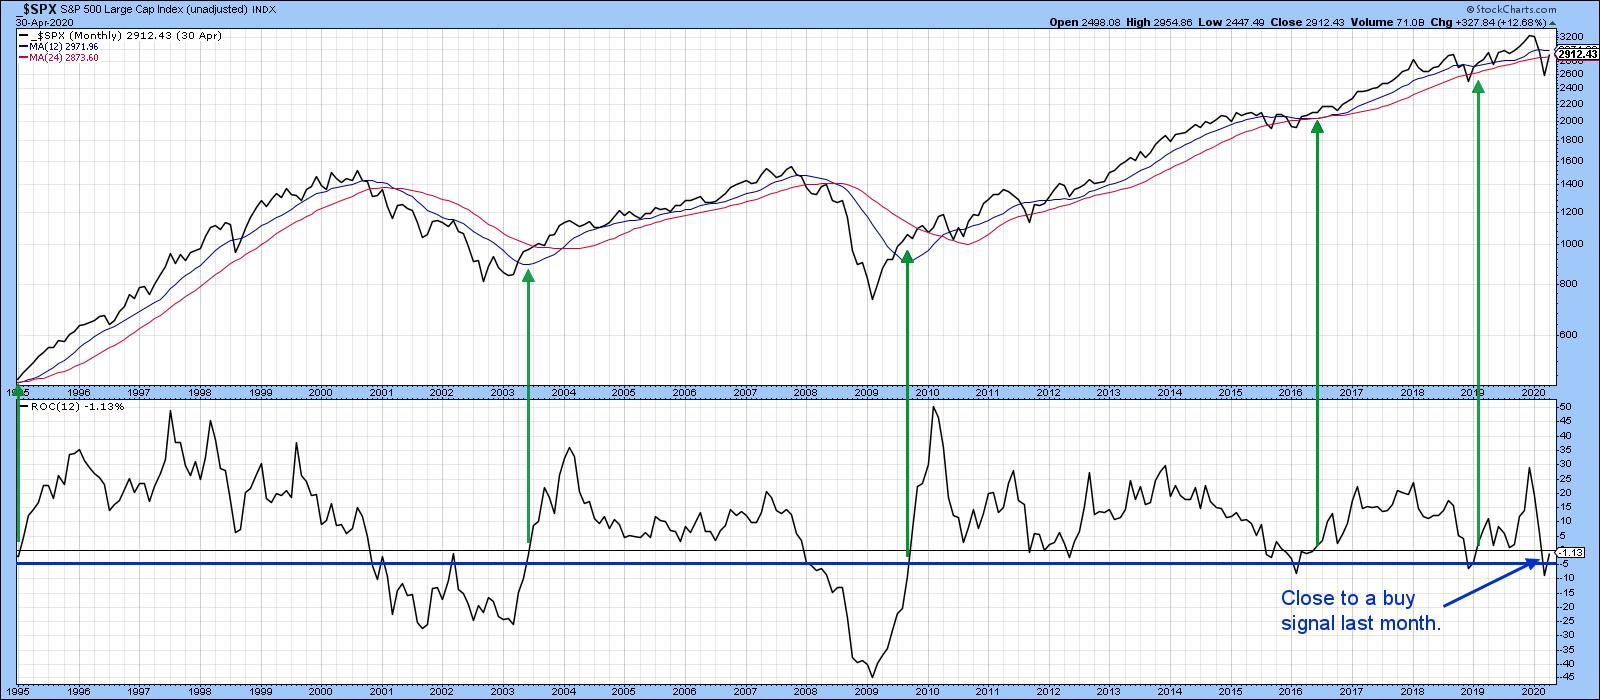
One of my favorite long-term indicators involves the 12-month ROC of the S&P Composite falling below the -5% level and subsequently rallying back above zero. This approach is shown in Chart 1, which illustrates the period from 1995 through April 30 of this...
READ MORE
MEMBERS ONLY

Why the Bullish Dollar Theory is Wrong (+ Video)
Maybe I just love a contrarian view.
My Dollar theory differs from so many analysts. First, I know that the traditional relationship between the Dollar, commodities and the stock market holds for a while, then completely shifts according to each economic cycle. I have experienced it during my trading career...
READ MORE
MEMBERS ONLY

The Alignment of Daily and Weekly Relative Rotation Graphs

by Julius de Kempenaer,
Senior Technical Analyst, StockCharts.com
Sometimes it is unclear how daily and weekly RRGs align with each other.
Just to be clear, this is not the same as the difference between daily and weekly RRGs. With regard to that difference, there is a ChartSchool article that explains it in detail.
What we are talking about...
READ MORE
MEMBERS ONLY

CONSUMER DISCRETIONARY SPDR MAY BE NEXT TO CHALLENGE 200-DAY LINE -- EBAY IS ONE OF ITS BEST PERFORMERS -- SO ARE CHIPOTLE, TRACTOR SUPPLY, AND ROLLINS -- AND HOME IMPROVEMENT STOCKS

by John Murphy,
Chief Technical Analyst, StockCharts.com
CONSUMER DISCRETIONARY SPDR NEARS 200-DAY LINE... Yesterday's message showed the Communication Services SPDR (XLC) trying to clear its 200-day moving average which it has done. The next in line may be consumer cyclicals. Chart 1 shows the Consumer Discretionary SPDR (XLY) nearing a test of its red line....
READ MORE
MEMBERS ONLY

This Reliable Long-Term Indicator Could Go Bullish at the End of the Month
by Martin Pring,
President, Pring Research
Sixty-Five Year Record of Success
One of my favorite long-term indicators involves the 12-month ROC of the S&P Composite falling below the -5% level and subsequently rallying back above zero. This approach is shown in Chart 1, which illustrates the period from 1995 through April 30 of this...
READ MORE
MEMBERS ONLY

COMMUNICATION SPDR STILL TESTING 200-DAY LINE -- INTERNET STOCKS ARE LEADING IT HIGHER -- USING SCTR RANKINGS TO FIND STOCK LEADERS
by John Murphy,
Chief Technical Analyst, StockCharts.com
XLC CONTINUES TO TEST 200-DAY LINE... Tuesday's message showed the Communication Services SPDR (XLC) challenging its 200-day moving average. Chart 1 shows that test still in progress. Its relative strength line in the lower box has also been rising. Internet stocks are the main driver behind recent XLC...
READ MORE
MEMBERS ONLY

PFE For The Win?
by Julius de Kempenaer,
Senior Technical Analyst, StockCharts.com
The above chart shows the daily and weekly tails for PFE overlaid on the same Relative Rotation Graph.
And before you ask... NO, you cannot do this on the site. I did need to be a little bit creative with cutting-copying-pasting-etc. But I thought it was worth it. A bit...
READ MORE
MEMBERS ONLY

DP Show: 20% of SPX Stocks May Be Cut Next Year

by Erin Swenlin,
Vice President, DecisionPoint.com

by Carl Swenlin,
President and Founder, DecisionPoint.com
In this episode of DecisionPoint, Carl and Erin's topic of the day was bankruptcy and the S&P 500. They discuss the difference between Chapter 11 and Chapter 7 bankruptcies and how that could affect the make up of the S&P 500. They discussed the...
READ MORE
MEMBERS ONLY
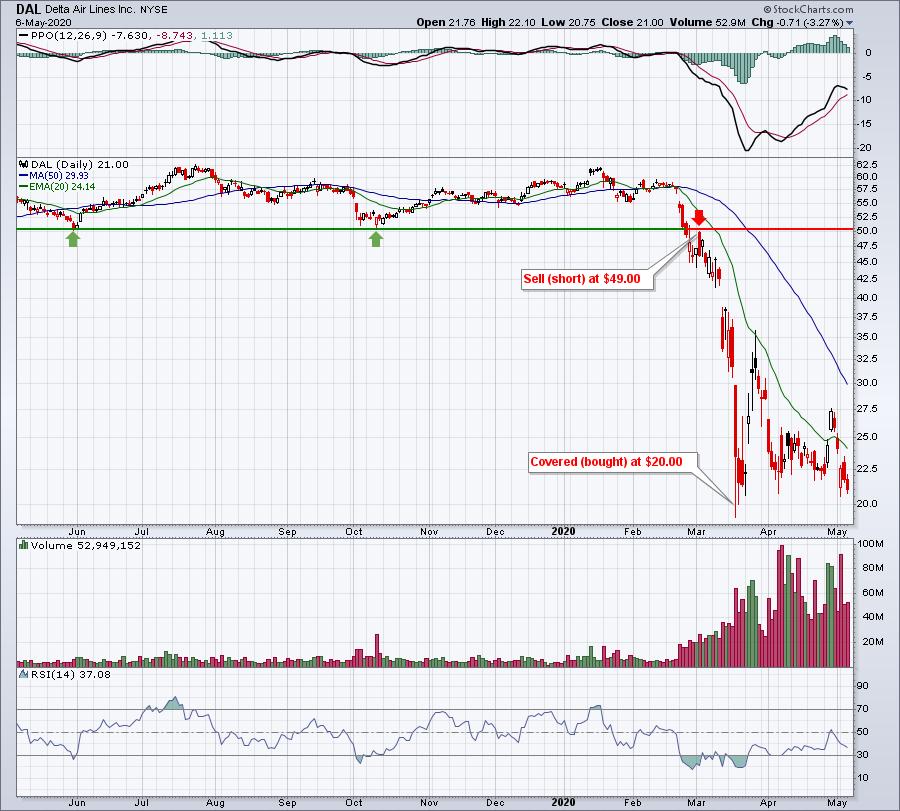
Another Explosive Move Due To Extreme Short Squeeze
by Tom Bowley,
Chief Market Strategist, EarningsBeats.com
Trading success, to some degree, is simply understanding the laws of supply and demand. There is a finite supply of shares available to buy of every stock traded on the various public exchanges. When the demand to buy those shares exceeds the supply available, price rises. Many of those involved...
READ MORE
MEMBERS ONLY

Random Thoughts: Take These Simple Steps to Overcome Your Trading Temptations

by Dave Landry,
Founder, Sentive Trading, LLC
Below, I explore some of my more recent discoveries into trading psychology, with a focus on the importance of resisting short-term temptations - the micro is so much more important than the macro. I explain how this applies to you (and me!). And, most importantly, I discuss what we can...
READ MORE
MEMBERS ONLY

How's the Market? Depends on Whose Room You Visit
To follow up on the daily article featuring the weekly channel in Biotechnology (IBB):
Since this is a weekly chart, what matters most is the weekly close. That means that, intra-week, we can consider price movements, but cannot consider a legitimate channel break up or down until the closing price...
READ MORE
MEMBERS ONLY

Bear Market Update, Trading Rules Part 4
by Dave Landry,
Founder, Sentive Trading, LLC
In this edition of Trading Simplified, Dave gives a bear market update including tools you can use for this time, and the next. He then continues on with his Trading Rules and coverage of the "Battle Within," trading psychology and how it all relates to you as a...
READ MORE
MEMBERS ONLY

The Beauty of the Biotechnology ETF Channel
If there is one area to watch should the market have another run up, it is Biotechnology (IBB).
The channel lines that are perfectly parallel, going back to 2015. Since this is a weekly chart, what matters most is the weekly close. That means that, intraweek, we can consider price...
READ MORE
MEMBERS ONLY

Sector Spotlight: Seasonality and Sector Rotation in US Stocks
by Julius de Kempenaer,
Senior Technical Analyst, StockCharts.com
On this episode of Sector Spotlight, I walk through asset classes and US sectors using RRG in combination with monthly charts. Afterwards, I answer a question from the mailbag regarding the alignment of weekly and daily RRGs. In the seasonality segment, I highlight two sectors that are showing a strong...
READ MORE
MEMBERS ONLY

Exponential Averages: Sometimes the More Rational Choice
by Carl Swenlin,
President and Founder, DecisionPoint.com
I was indoctrinated into using exponential moving averages (EMAs) out of necessity, back when I was generating data for the old DecisionPoint.com website. I was generating and maintaining data on Excel spreadsheets, and, if I wanted a 200-day simple moving average (SMA), I would need to keep 200 days...
READ MORE
MEMBERS ONLY
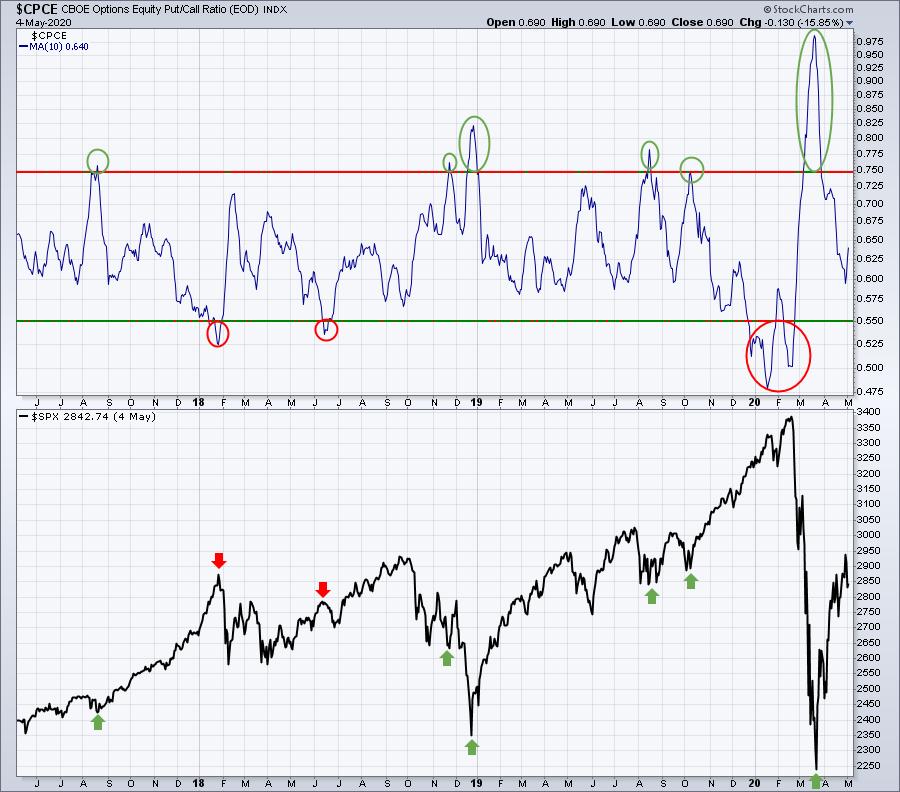
Here's The Most Proven Method I Know To Catch Key Market Tops And Bottoms
by Tom Bowley,
Chief Market Strategist, EarningsBeats.com
Happy Cinco de Mayo to all! Below is my Daily Market Report that is sent out every day to EarningsBeats.com members. If you'd like to subscribe, I'd love to have you join our growing community! Here's a link:
Fully refundable $7 30-day trial...
READ MORE
MEMBERS ONLY

STOCKS OPEN HIGHER -- NASDAQ CONTINUES TO LEAD -- CHIPS REGAIN 200-DAY LINE -- MICROSOFT AND APPLE REMAIN STRONG -- ALHPABET AND FACEBOOK LEAD COMMUNICATION SERVICES SPDR HIGHER
by John Murphy,
Chief Technical Analyst, StockCharts.com
STOCKS OPEN ON A STRONG NOTE... Stock prices opened much higher this morning. And all three major stock indexes are bouncing off some moving average lines. Chart 1 shows the Dow Industrials bouncing off their 20- and 50-day moving averages which is usually their first line of support. Chart 2...
READ MORE
MEMBERS ONLY

Current Sector Rotation for These Two Sectors is Lining Up with Their Seasonality!
by Julius de Kempenaer,
Senior Technical Analyst, StockCharts.com
At the end of the month, or the beginning of a new month, I like to look at the expected strength for sectors based on seasonality.
The chart above visualizes the seasonal strength for US sectors in one 3D image. The numbers in the table represent the % of occurrences for...
READ MORE
MEMBERS ONLY

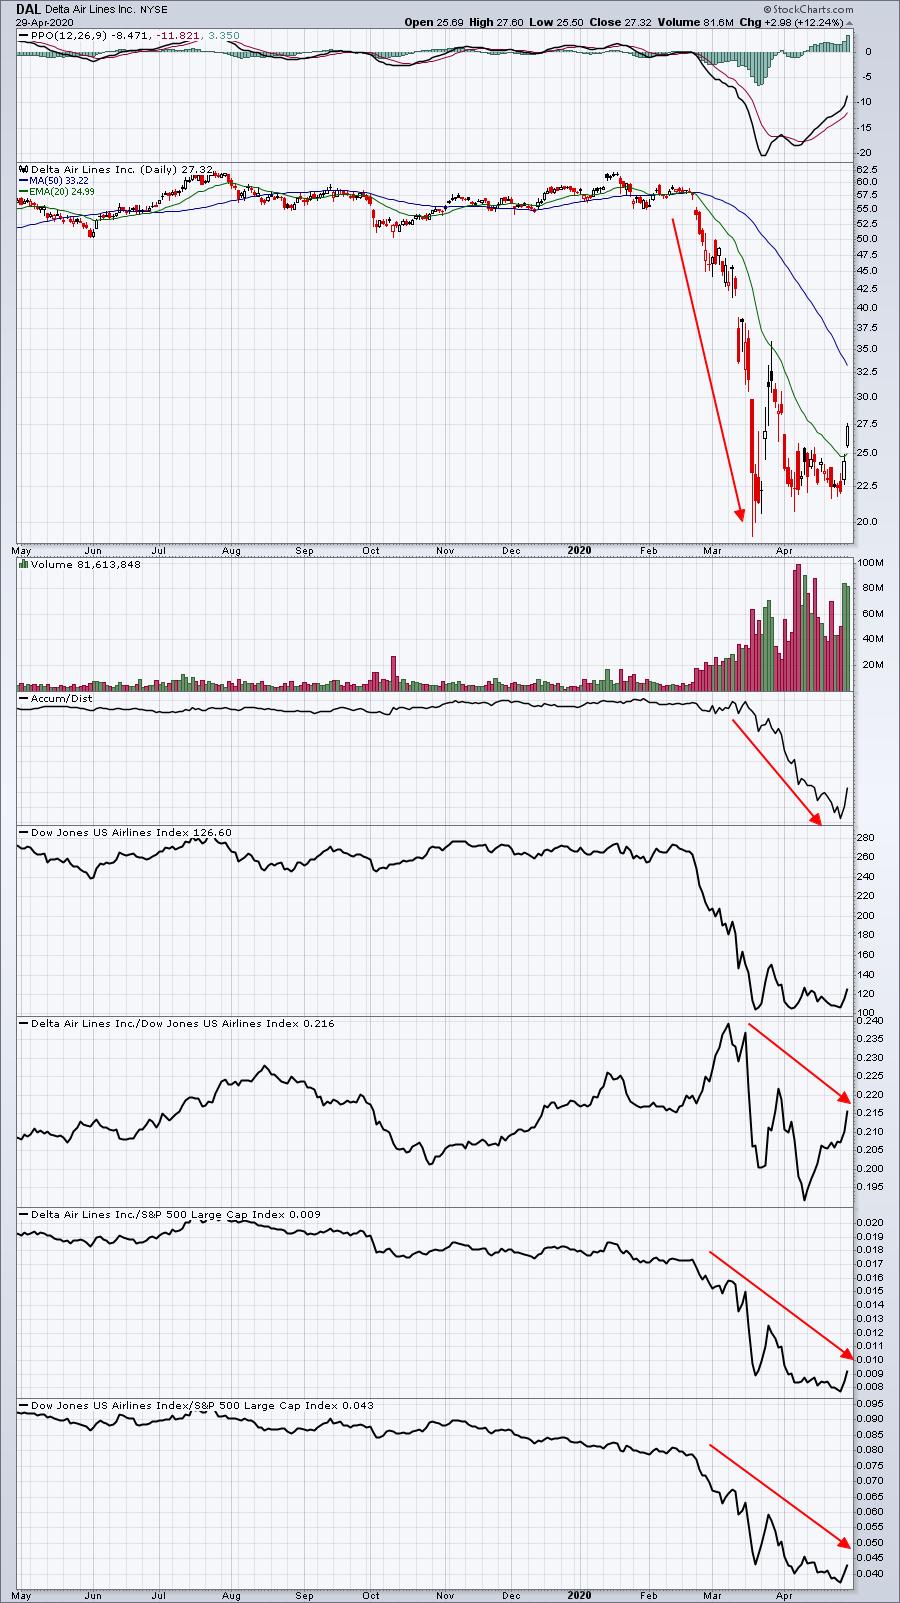
Big Earnings Tuesday in Two Different Megatrends
In the transportation sector, which is weakening partly because of Buffett's weekend comments, there is one area that is doing a lot better.
Want to fly coast to coast? Not so much.
Want to go to outer space? Sign me up!
Virgin Galactic (SPCE) reports May 5th. The...
READ MORE
MEMBERS ONLY

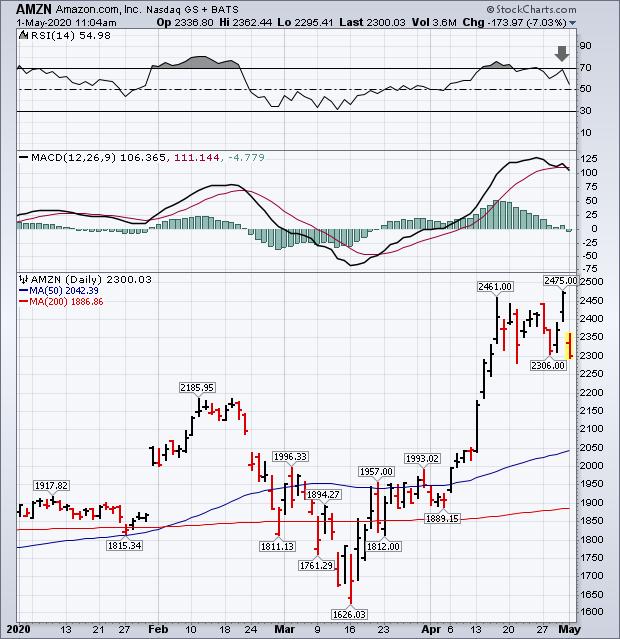
This Big League Stock Just Received A Buy Recommendation From 12 Wall Street Firms
by Mary Ellen McGonagle,
President, MEM Investment Research
When the CEO of a major corporation states: "You may want to take a seat" during their quarterly earnings report, you can bet that some serious news is about to be shared. And indeed, Jeff Bezos of Amazon (AMZN) dropped a bomb when he stated that the company...
READ MORE
MEMBERS ONLY

STOCK INDEXES MAY HAVE PEAKED -- THE QUESTION IS HOW MUCH WILL THEY RETRACE -- FALLING CHIP STOCKS THREATEN NASDAQ UPTREND -- AMAZON IS THE FIRST OF BIG FIVE TO BE SOLD
by John Murphy,
Chief Technical Analyst, StockCharts.com
STOCK RALLY MAY HAVE PEAKED... A number of short-term technical indicators suggest that the spring rebound in stocks may have peaked this past week. The daily bars in Chart 1 show the S&P 500 selling off on Thursday and Friday after touching its 62% Fibonnaci retracement line (purple...
READ MORE
MEMBERS ONLY

Week Ahead: NIFTY Not Moving Past this Level, May Form Lower Top; RRG Suggests Underperformance May Continue in These Sectors

by Milan Vaishnav,
Founder and Technical Analyst, EquityResearch.asia and ChartWizard.ae
The previous week saw the markets trading on a much better-than-expected note as the headline index continued to surge higher, ending with strong gains. The markets had seen a loss of momentum in the week before this one; however, the truncated week saw the resumption of the technical rebound, which...
READ MORE
MEMBERS ONLY
Amazon Weighs on Consumer Cyclicals
by John Murphy,
Chief Technical Analyst, StockCharts.com
Stocks in general are undergoing some profit-taking today. And consumer cyclicals are one of the day's weakest groups. A big reason for that is today's big drop in Amazon.com (AMZN). Chart 1 shows that influential stock dropping -7% today on last evening's reported...
READ MORE
MEMBERS ONLY

Bull Rally Under Pressure?
by Mary Ellen McGonagle,
President, MEM Investment Research
In this episode of StockCharts TV'sThe MEM Edge, Mary Ellen reviews the impact of a late-week selloff on the broader markets. She also discusses the move within various sectors, with a spotlight on Gold stocks.
This video was originally recorded on May 1st, 2020. Click on the above...
READ MORE
MEMBERS ONLY
Don't Let the Disconnect Between Wall Street and Main Street Derail You

by John Hopkins,
President and Co-founder, EarningsBeats.com
Last Wednesday, the NASDAQ got within just a few very strong sessions of reaching its all-time high. Let me repeat; it's All-Time High! Notwithstanding the much-needed pullback on Friday, how is this even possible, with millions of people out of work, most of America shut down and most...
READ MORE
MEMBERS ONLY
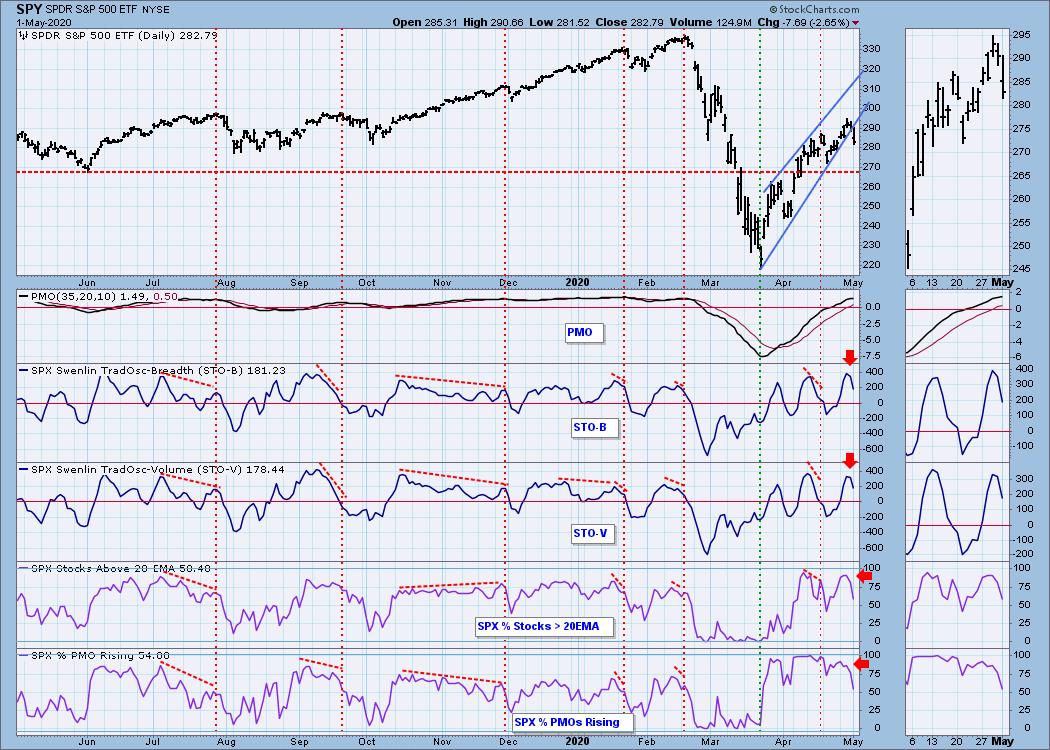
Swenlin Trading Oscillators Gave Warning... Again!
by Erin Swenlin,
Vice President, DecisionPoint.com
Yet again, the Swenlin Trading Oscillators gave our readers early warning for today's decline. I have written about their previous successes in ChartWatchers, but I wanted to report back to you that they are continuing to be leading indicators. Below is an excerpt from yesterday's DecisionPoint...
READ MORE
MEMBERS ONLY

A Trip to the 70s Using Old-School Charting (+ Video)
In my April 31st presentation on StockCharts (which aired earlier today on StockCharts TV), I begin by walking you through the Economic Modern Family (Russell 2000, Retail, Biotechnology, Regional Banks, Transportation, Semiconductors) using nothing but pure price. I used trendlines and channels I learned from my days trading on the...
READ MORE
MEMBERS ONLY

Pro Sports Drafts: 7 Essential Lessons Investors Should Learn From The NFL, NBA, MLB and NHL

by Gatis Roze,
Author, "Tensile Trading"
In a recent survey of serious investors, it was uncovered that a majority are earnest sports fans. Count me guilty. As I write this, we just completed the National Football League's (NFL) draft. But the focus here is not on simply one sport. All the major pro sports...
READ MORE
MEMBERS ONLY

Putting the Big Bounces into Perspective

by Arthur Hill,
Chief Technical Strategist, TrendInvestorPro.com
Despite a massive advance the last six weeks, the bulk of the evidence indicates that we are still in a bear market environment. The advance off the March low, while impressive on its own, still pales in comparison to the prior decline. The S&P 500 SPDR retraced around...
READ MORE
MEMBERS ONLY

AMAZON WEIGHS ON CONSUMER CYCLICALS -- LAM RESEARCH LEADS SEMIS LOWER -- EXCEPT FOR AMAZON, BIG TECH STOCKS ARE HAVING A RELATIVELY STRONG WEEK
by John Murphy,
Chief Technical Analyst, StockCharts.com
AMAZON SELLOFF HURTS CONSUMER CYCLICALS... Stocks in general are undergoing some profit-taking today. And consumer cyclicals are one of the day's weakest groups. A big reason for that is today's big drop in Amazon.com (AMZN). Chart 1 shows that influential stock dropping -7% today on...
READ MORE
MEMBERS ONLY
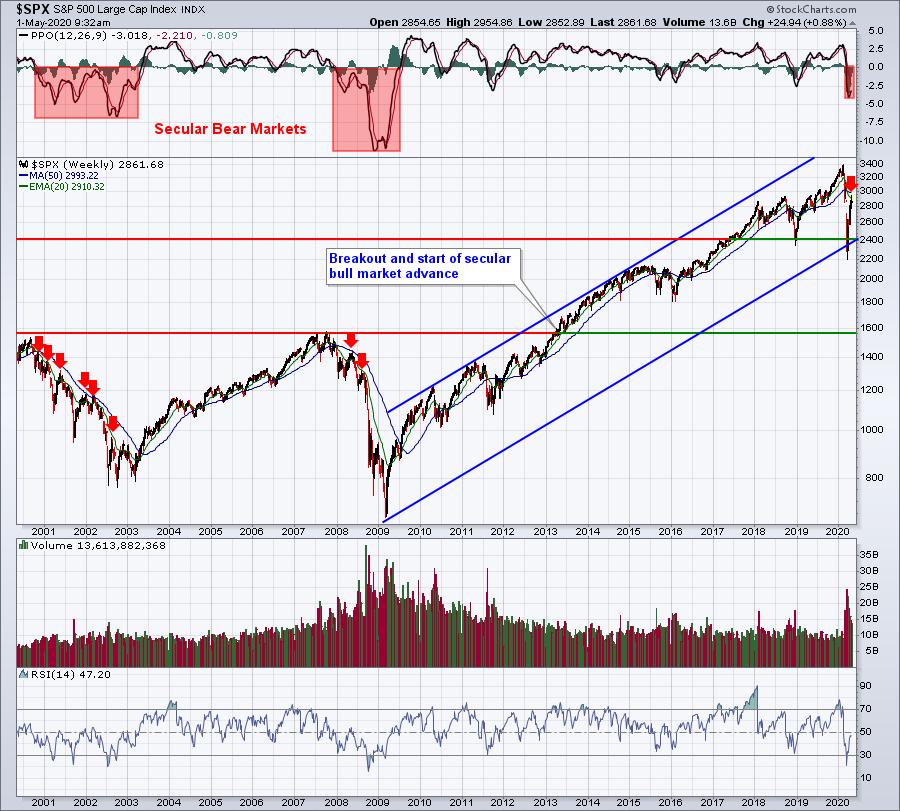
Will The S&P 500 Be Able To Clear This Key Level? And What Will Next Week's Big Winner Be?
by Tom Bowley,
Chief Market Strategist, EarningsBeats.com
The S&P 500 has rallied more off the March 23rd bottom than just about anyone could have predicted and it's done it in record time. I've remained bullish from a longer-term perspective, relying on the secular bull market advance that began in 2013 when...
READ MORE
MEMBERS ONLY

Is It Time For a Commodity Rally?
by Martin Pring,
President, Pring Research
Commodities have been badly beaten up in the last few months, but no market goes down for ever, so it's natural to ask the question of whether it's time for an upside reversal. The evidence for that is not conclusive yet, but there are some very...
READ MORE
MEMBERS ONLY
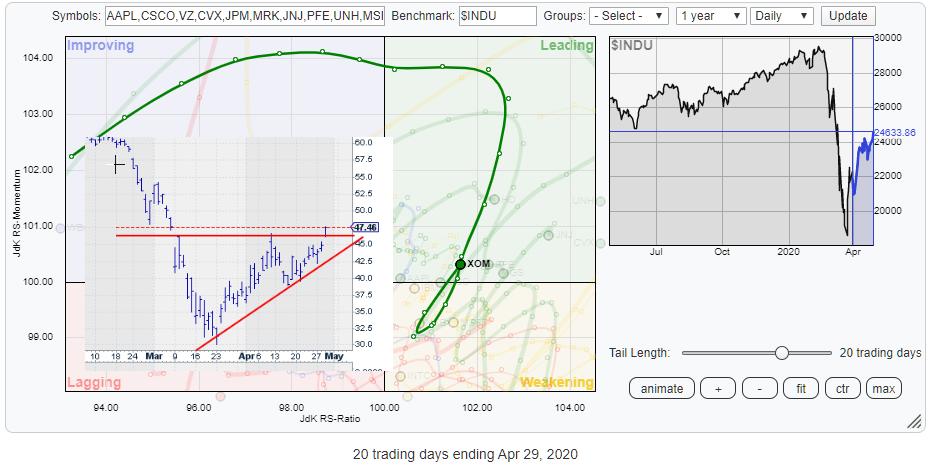
XOM is Turning Around Back Into Leading vs. $INDU
by Julius de Kempenaer,
Senior Technical Analyst, StockCharts.com
The Energy sector keeps coming back on my radar as a sector that's potentially turning around. The sector has been in a relative downtrend for ages already and, from a long-term perspective, things still do not look very good. However, things never look good just before or in...
READ MORE
MEMBERS ONLY
Creating A ChartList To Identify Excellent Reward To Risk Trading Candidates
by Tom Bowley,
Chief Market Strategist, EarningsBeats.com
I haven't abandoned my philosophy of trading stocks of companies whose recent quarterly revenues and EPS beat Wall Street consensus estimates. Such companies are included on my Strong Earnings ChartList (SECL), which up until recently, I traded from exclusively. I still believe it's incredibly important for...
READ MORE
MEMBERS ONLY

DP Show: Eye-Popping Rally on Possible Treatment
by Erin Swenlin,
Vice President, DecisionPoint.com
by Carl Swenlin,
President and Founder, DecisionPoint.com
In this episode of DecisionPoint, Carl and Erin reviewed everything from the Case-Schiller Home Price Index to SPX Earnings Estimates and Gilead Sciences (GILD). Erin covered brand new scan results that uncovered a few names you might want to consider. Big-name companies reported earnings today, so they revealed the charts...
READ MORE
MEMBERS ONLY

12+1 Trading Rules - Part 3
by Dave Landry,
Founder, Sentive Trading, LLC
In this edition of Trading Simplified, Dave begins with a bear market update, then continues his discussion of the 12+1 trading rules he follows and the trading psychology behind them. For this episode, Dave focuses on the final rule, namely "The Battle is Within".
This video was...
READ MORE
