MEMBERS ONLY
Applying Dow Theory to Today's Market: Are We in a Reversal or a New Trend?

by Karl Montevirgen,
The StockCharts Insider
KEY TAKEAWAYS
* Despite being over 100 years old, Dow Theory can still help you identify major turning points in the market.
* Like market breadth and sentiment indicators, many tools might enhance Dow's basic tenets.
* Secondary trends are vulnerable to geopolitical risk, so continue monitoring what's happening...
READ MORE
MEMBERS ONLY
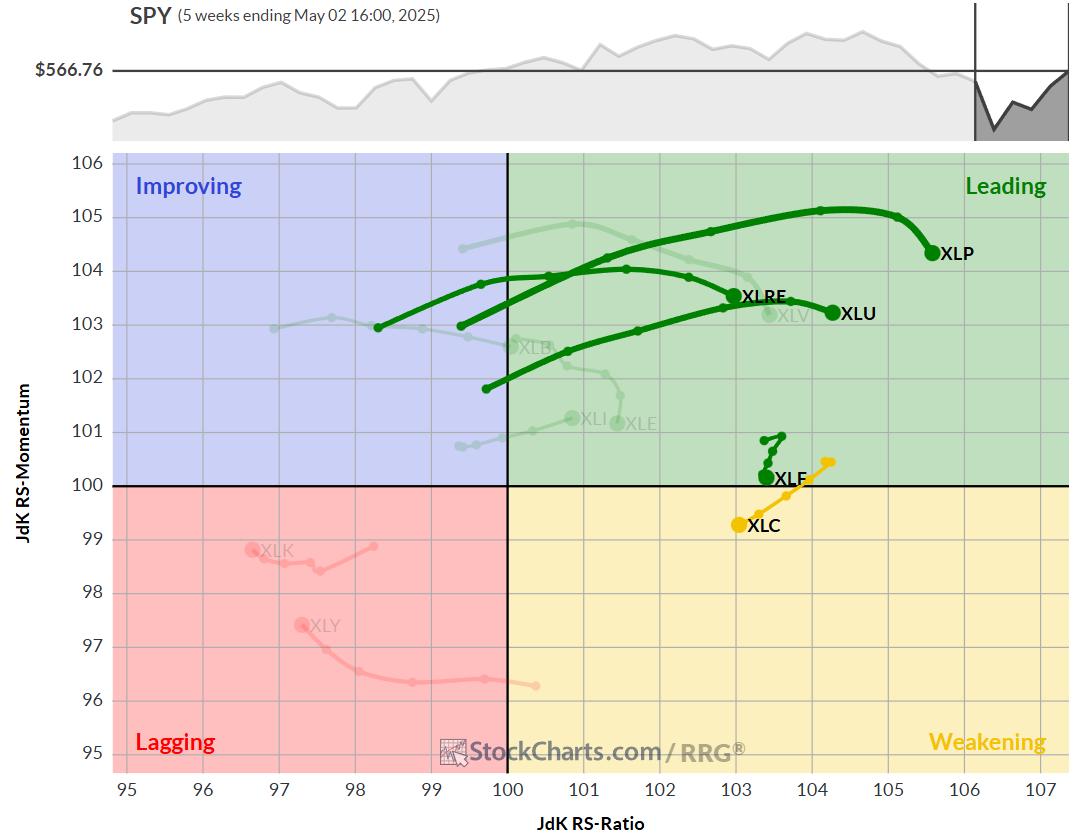
What Sector Rotation Says About the Market Cycle Right Now

by Julius de Kempenaer,
Senior Technical Analyst, StockCharts.com
Where are we in the market cycle? In this video, Julius reviews the sector rotation and asset class performance from the past 2-3 weeks to provide an objective take on where we stand in the current market cycle. Using his signature Relative Rotation Graphs (RRG), he uncovers shifts in momentum...
READ MORE
MEMBERS ONLY

SMCI Stock Rebounds: Why Its SCTR Score is Screaming for Attention

by Jayanthi Gopalakrishnan,
Director of Site Content, StockCharts.com
KEY TAKEAWAYS
* SMCI stock shows strong bullish momentum and is in the Top 10 in the Large Cap stocks category.
* SMCI stock broke above its 200-day moving average and is showing indications of a potential uptrend continuation.
* Using StockCharts tools such as SCTR Score, RSI, and PPO can help identify...
READ MORE
MEMBERS ONLY

The S&P 500 Snapped Back Hard: Now What?

by Frank Cappelleri,
Founder & President, CappThesis, LLC
KEY TAKEAWAYS
* The S&P 500's 14-week RSI hit its lowest point since the 2008 financial crisis.
* Sector ETFs like XLK (Technology) and XLI (Industrials) are showing bullish patterns.
* While the stock market's rapid reversal is encouraging, historical trends show that pullbacks often follow oversold...
READ MORE
MEMBERS ONLY
How to Use Relative Strength in a Volatile Market

by Joe Rabil,
President, Rabil Stock Research
Want to know how to find strong stocks in a volatile market? In this video, Joe uses Relative Strength (RS), Fibonacci retracements, and technical analysis to spot top sectors and manage downside risk.
Follow along as Joe breaks down how to use the Relative Strength indicator to separate outperforming stocks...
READ MORE
MEMBERS ONLY

Tariff Tensions Ease, Nasdaq Soars — But is SMH the Emerging Leader?
by Karl Montevirgen,
The StockCharts Insider
KEY TAKEAWAYS
* The Nasdaq 100 leads with a strong show of breadth.
* Semiconductors are showing signs of recovery, despite lagging major indices.
* SMH's price action may be reaching a turning point.
For months, investors have been on edge over U.S.-China tariff tensions, bracing for everything from...
READ MORE
MEMBERS ONLY

Is It Time for Emerging Markets to Emerge?

by Martin Pring,
President, Pring Research
The US market has been recovering nicely since the April low, but it has actually been outperformed by the rest of the world this year so far. In that respect, Chart 1 shows that a major shift away from the US could well be in the cards.
It is evident...
READ MORE
MEMBERS ONLY
Bullish Breadth Improvement Suggests Further Upside for Stocks

by David Keller,
President and Chief Strategist, Sierra Alpha Research
KEY TAKEAWAYS
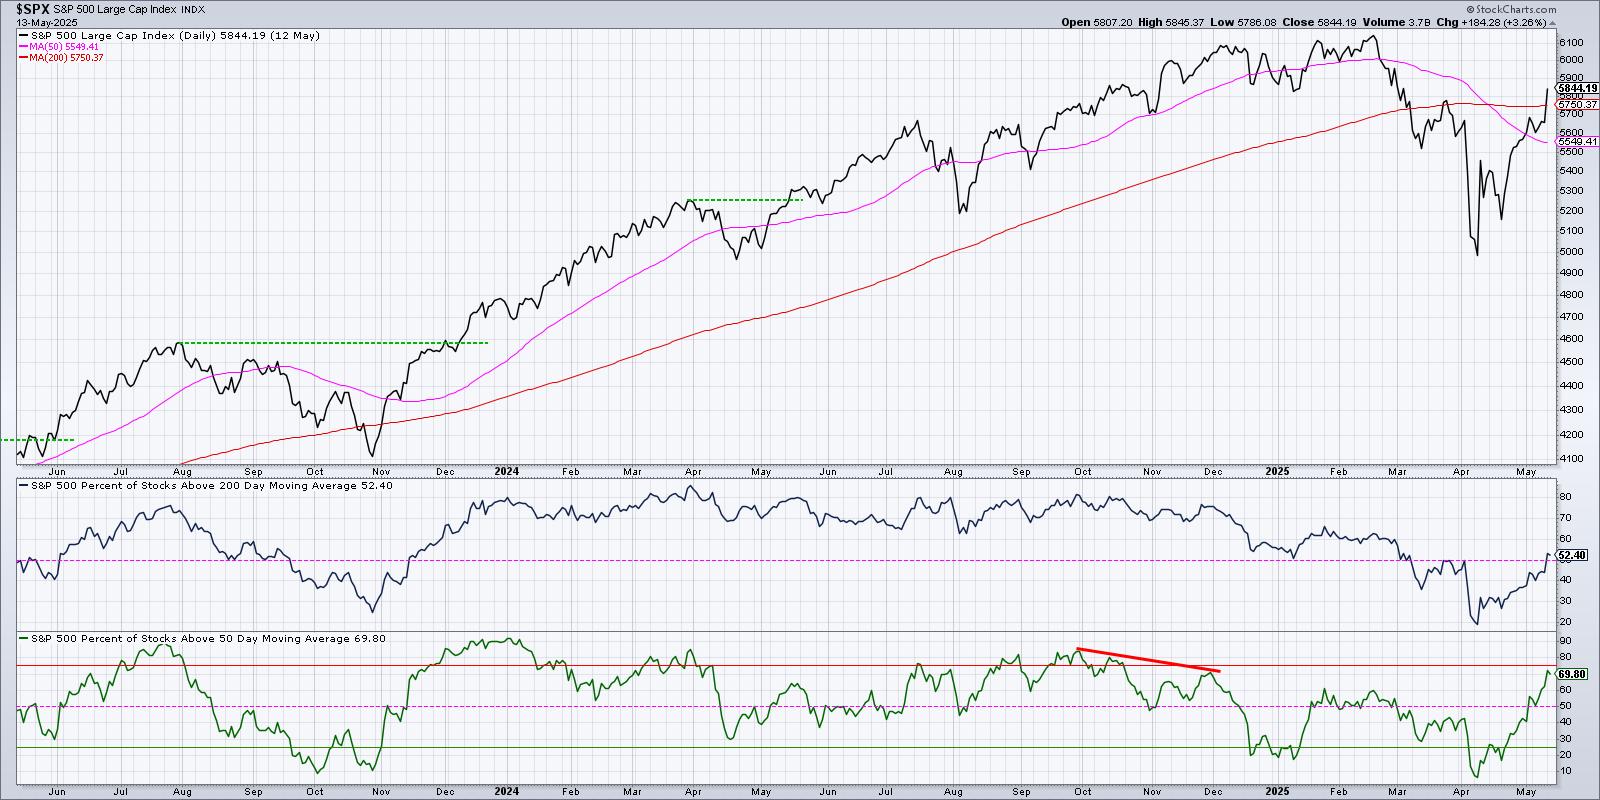
* For the first time since early March, over 50% of S&P 500 members are above their 200-day moving average.
* When this long-term breadth indicator has gone from below 25% to above 50%, forward 12-month returns have been positive.
* Investors should keep a watchful eye on the...
READ MORE
MEMBERS ONLY
50% of S&P 500 Stocks Just Turned Bullish – What Happens Next?
by David Keller,
President and Chief Strategist, Sierra Alpha Research
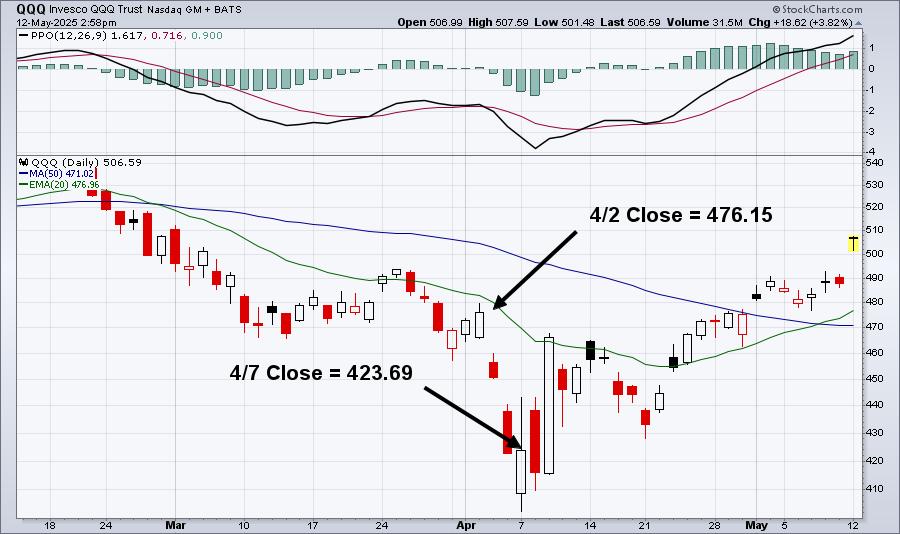
Bullish signal alert! Over 50% of S&P 500 stocks are now above their 200-day moving average.
In this video, Dave explains this key market breadth indicator and what it means for stock market trends. He shows how moving average breadth has reached a bullish milestone, what this means...
READ MORE
MEMBERS ONLY
Market Maker Manipulation; Oops, They Did It Again!

by Tom Bowley,
Chief Market Strategist, EarningsBeats.com
Let's be honest. Did anyone think a little more than a month ago that the S&P 500 was primed for a 1000-point rebound? I turned bullish at that April 7th bottom a month ago, but I did not see this type of massive recovery so quickly....
READ MORE
MEMBERS ONLY

Unlock the Power of StockCharts' NEW Market Summary Dashboard | Walkthrough & Tips

by Grayson Roze,
Chief Strategist, StockCharts.com
In this in-depth walkthrough, Grayson introduces the brand-new Market Summary Dashboard, an all-in-one resource designed to help you analyze the market with ease, speed, and depth. Follow along as Grayson shows how to take advantage of panels, mini-charts, and quick scroll menus to maximize your StockCharts experience.
This video originally...
READ MORE
MEMBERS ONLY

Navigating Earnings: Three Stocks, Three Different Stories

by Jay Woods,
Chief Global Strategist, Freedom Capital Markets
KEY TAKEAWAYS
* Short-term traders may find an opportunity in Under Armour stock if the price breaks above key resistance.
* Walmart earnings could reveal how retail spending is trending.
* Alibaba's stock price sits in a volatile range with trade tensions and AI investments playing a critial role in its...
READ MORE
MEMBERS ONLY

The Best Five Sectors, #18
by Julius de Kempenaer,
Senior Technical Analyst, StockCharts.com
KEY TAKEAWAYS
* All 11 sectors changed positions, but the top-5 / bottom-6 composition remained the same.
* Utilities now strongest sector, despite overall market strength.
* Communication Services jumped from 5th to 2nd place.
* Portfolio still 3% behind the S&P 500 YTD, unchanged from last week.
Sector Shuffle: Same Players, New...
READ MORE
MEMBERS ONLY
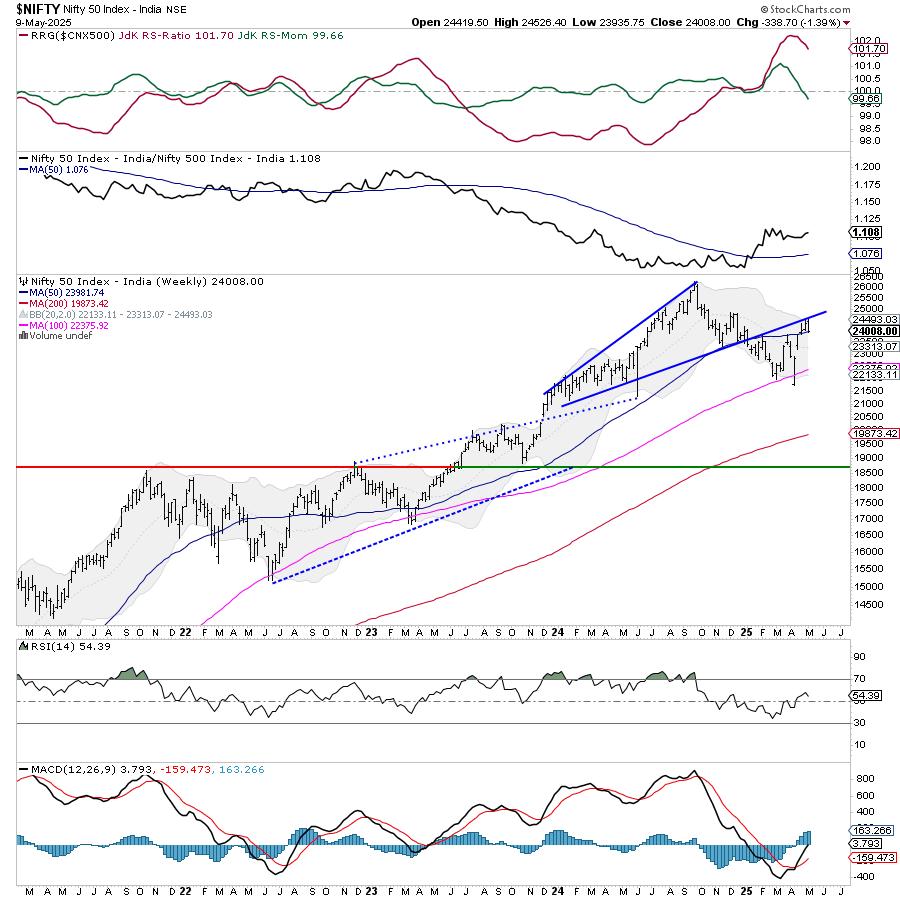
Week Ahead: NIFTY Stays in Technically Challanging Environment; Price Action Against These Levels Crucial

by Milan Vaishnav,
Founder and Technical Analyst, EquityResearch.asia and ChartWizard.ae
Amid ever-increasing uncertainties on the global front and similarly rising geopolitical tensions between India and Pakistan, the Indian equity markets demonstrated strong resilience, consolidating before ending the week on just a modestly negative note. The trading range remained modest; the Nifty oscillated in a 590-point range. While the markets defended...
READ MORE
MEMBERS ONLY

Recession Ahead? Sector Rotation Model Warns of Rising Risk
by Julius de Kempenaer,
Senior Technical Analyst, StockCharts.com
Is a recession coming? In this video, Julius breaks down the latest updates to his powerful Sector Rotation Model, analyzing four key macroeconomic indicators and their impact on sector performance.
This video was originally published on May 9, 2025. Click on the icon above to view on our dedicated page...
READ MORE
MEMBERS ONLY
Where the Market Goes Next: Key Resistance Levels + Top Bullish Stocks to Watch Now

by Mary Ellen McGonagle,
President, MEM Investment Research
Want to know where the stock market is headed next? In this week's market update, Mary Ellen McGonagle analyzes key resistance levels and reveals what's fueling the current uptrend. She highlights top bullish setups among U.S. leadership stocks, plus global names showing strength.
This video...
READ MORE
MEMBERS ONLY

Investment Portfolio Feeling Stagnant? Transform Your Path Today
by Jayanthi Gopalakrishnan,
Director of Site Content, StockCharts.com
KEY TAKEAWAYS
* Tariffs and trade talks add to investor uncertainty with short-lived rallies.
* Frequent shifts between offensive and defensive sectors indicate ongoing stock market volatility.
* Mid-cap and small-cap stocks are gaining momentum and worth monitoring.
When your investment portfolio isn't gaining ground, it's natural to feel...
READ MORE
MEMBERS ONLY
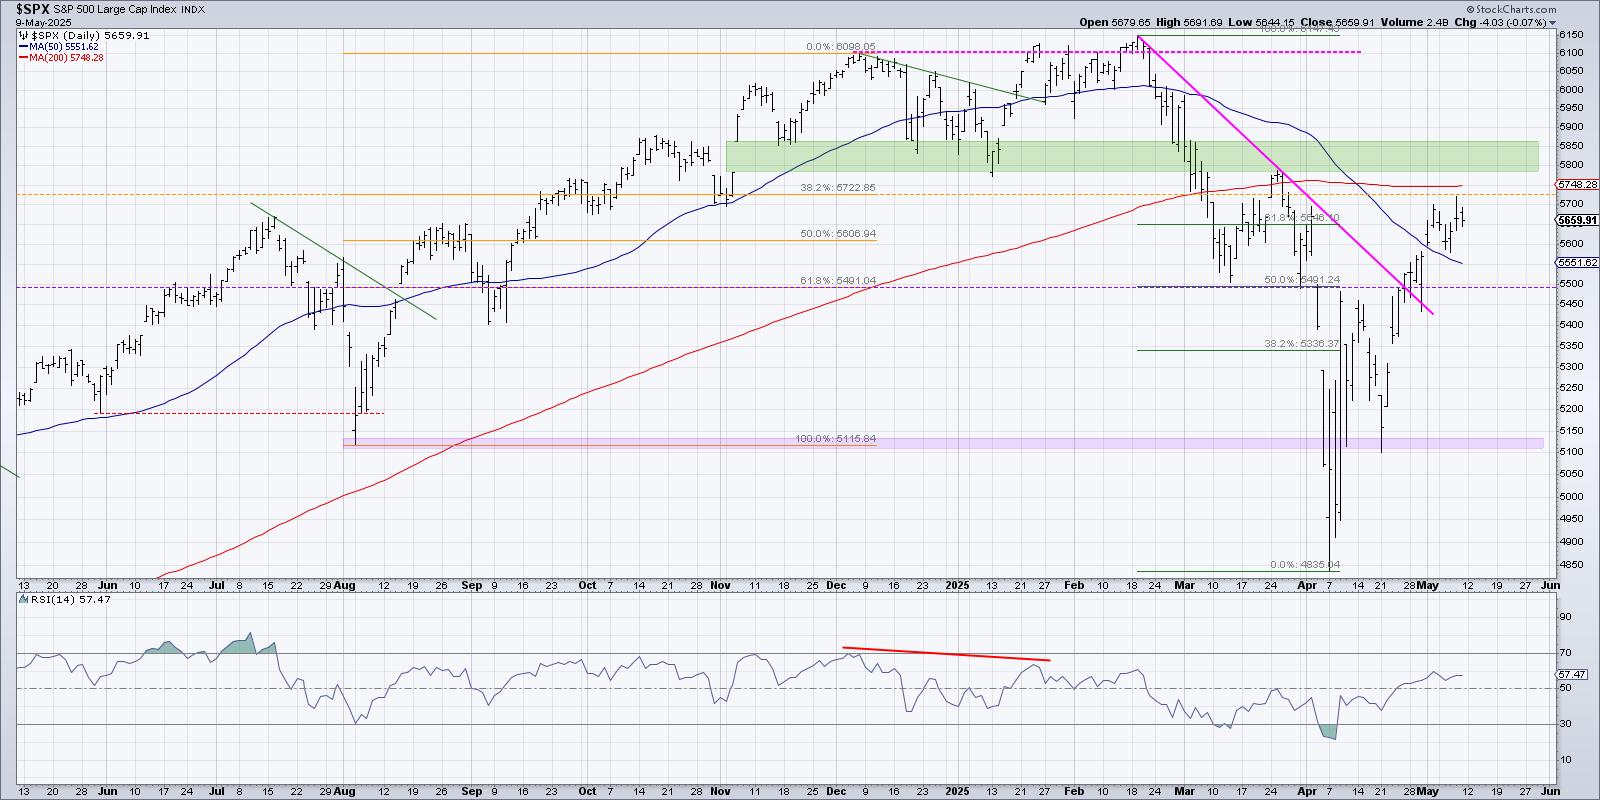
Which Will Hit First: SPX 6100 or SPX 5100?
by David Keller,
President and Chief Strategist, Sierra Alpha Research
Last Friday, the S&P 500 finished the week just below 5700. The question going into this week was, "Will the S&P 500 get propelled above the 200-day?" And as I review the evidence after Friday's close, I'm noting that the...
READ MORE
MEMBERS ONLY
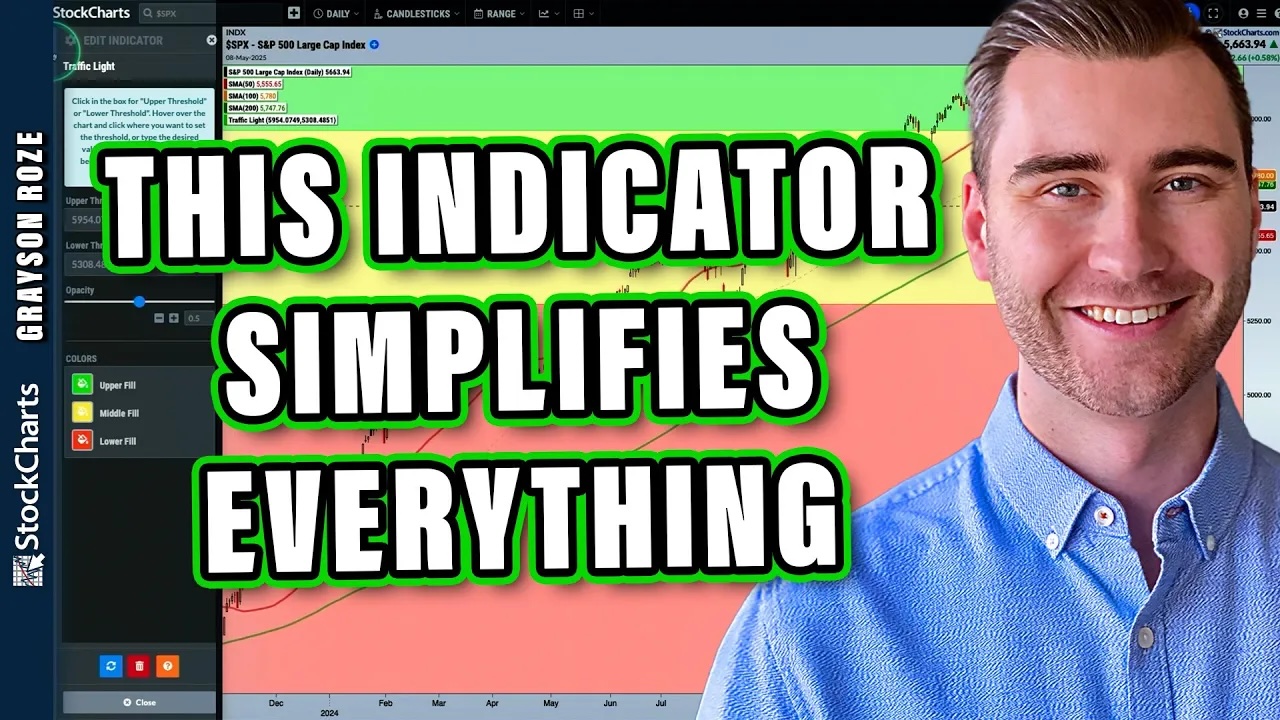
Confused by the Market? Let the Traffic Light Indicator Guide You
by Grayson Roze,
Chief Strategist, StockCharts.com
In this insightful session, Grayson introduces the Traffic Light indicator, a unique tool available exclusively on the Advanced Charting Platform (ACP). Amidst the current volatility of the S&P 500, Grayson demonstrates how this indicator can help investors clarify trend directions and make more confident decisions.
This video originally...
READ MORE
MEMBERS ONLY

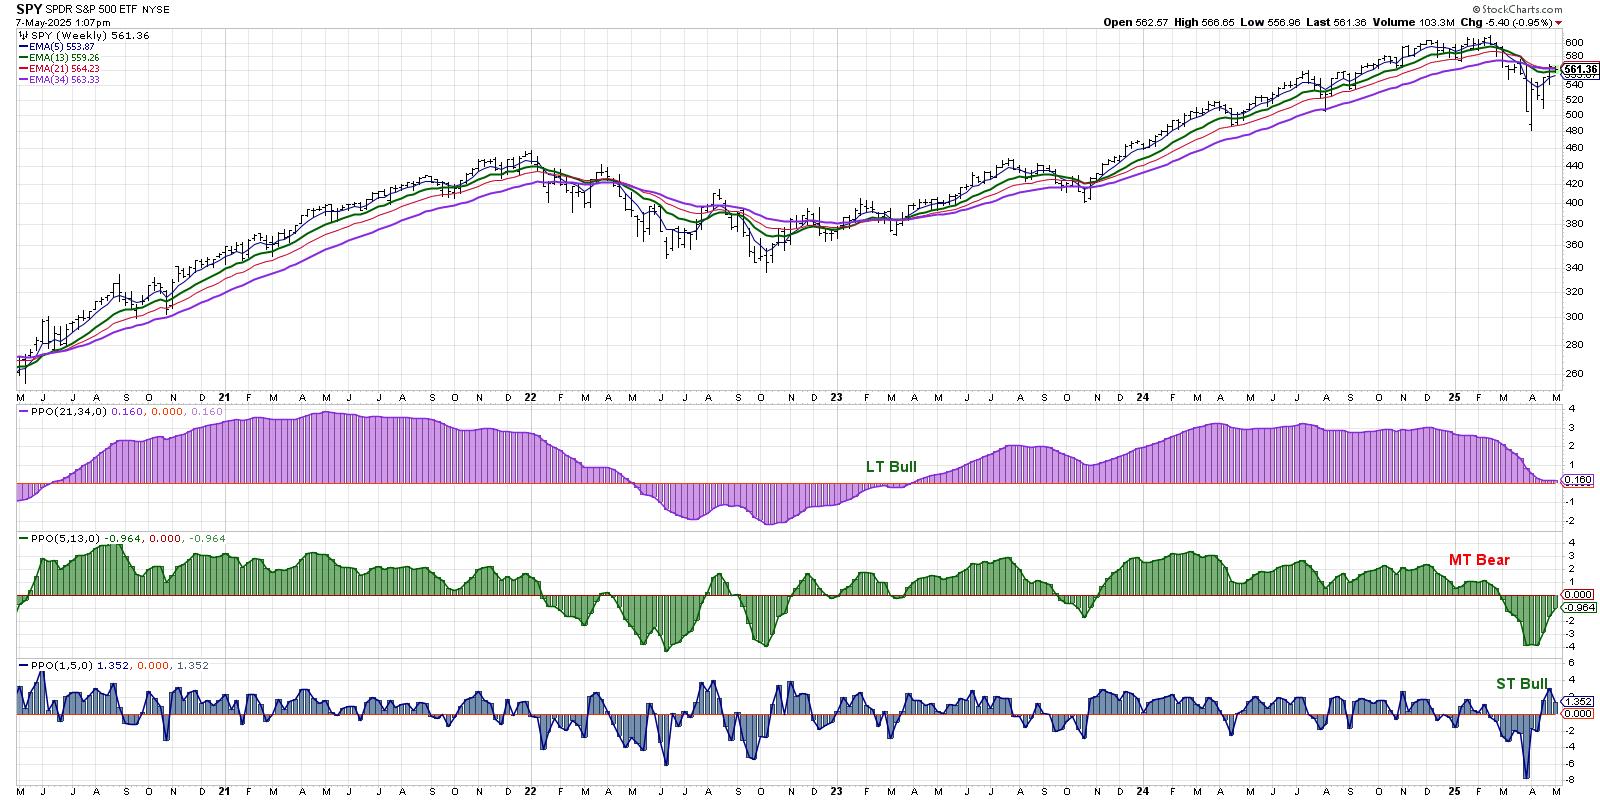
The V Reversal is Impressive, but is it Enough?

by Arthur Hill,
Chief Technical Strategist, TrendInvestorPro.com
KEY TAKEAWAYS
* SPY broke down in March, plunged into early April and surged into early May.
* This V bounce is impressive, but it is not enough to reverse the March breakdown.
* A significant increase in upside participation is needed to move from bear market to bull market.
Stocks plunged into...
READ MORE
MEMBERS ONLY

Don't Buy Robinhood Stock... Until You See This Chart Setup
by Karl Montevirgen,
The StockCharts Insider
KEY TAKEAWAYS
* Robinhood's stock price is outpacing its sector and the broader market.
* The Financials sector looks bullish, and HOOD has outperformed it by 250% over 3 years.
* Does HOOD have room to run, or is it running on fumes and FOMO?
Robinhood Markets, Inc. (HOOD) is back...
READ MORE
MEMBERS ONLY

The Unpredictable Stock Market: How to Make Sense of It
by Jayanthi Gopalakrishnan,
Director of Site Content, StockCharts.com
KEY TAKEAWAYS
* The S&P 500 is struggling to break above key resistance levels.
* It's a headline-driven market out there, with stocks reacting quickly to geopolitical and policy changes.
* The Cboe Volatility Index (VIX) indicates investors are still uncertain.
The stock market's action on Wednesday...
READ MORE
MEMBERS ONLY
Use This Multi-Timeframe MACD Signal for Precision Trades
by Joe Rabil,
President, Rabil Stock Research
In this video, Joe shares how to trade MACD signals using multiple timeframes, and how to spot stock market pullback setups that can help to pinpoint a great entry off a low. He then reviews sector performance to identify market leadership, covers key chart patterns, and discusses a looming bearish...
READ MORE
MEMBERS ONLY
Three Charts to Watch for an "All Clear" Signal
by David Keller,
President and Chief Strategist, Sierra Alpha Research
KEY TAKEAWAYS
* If our medium-term Market Trend Model turns bullish this Friday, that would mean the first bullish reversal since October 2023.
* Less than 50% of S&P 500 members are above their 200-day moving average, and any reading above 50% could confirm bullish conditions.
* Offensive sectors like Consumer...
READ MORE
MEMBERS ONLY

Fed Watch: Key Bullish Patterns in the S&P 500, Utilities, and Crypto
by Frank Cappelleri,
Founder & President, CappThesis, LLC
KEY TAKEAWAYS
* Bullish chart patterns, such as the inverse head-and-shoulders and cup with handle, are in play in the S&P 500.
* Utilities are breaking to new 50-day highs.
* Bitcoin and Ethereum continue to signal rising risk appetite.
The S&P 500 ($SPX) wrapped up Tuesday just below...
READ MORE
MEMBERS ONLY

Will Trump's Foreign Film Tariffs Crush Streaming Stocks? What You Need To Know Now
by Karl Montevirgen,
The StockCharts Insider
KEY TAKEAWAYS
* Trump's proposed 100% tariffs on foreign films are now disrupting streaming media stocks.
* Pure-play stocks are responding differently, with Netflix, the most exposed to tariff risk, outperforming all others.
* Any technical or fundamental trade setup is subject to geopolitical dynamics; so be cautious!
Trump's...
READ MORE
MEMBERS ONLY
Four Charts to Track a Potential Market Top
by David Keller,
President and Chief Strategist, Sierra Alpha Research
In this video, Dave reveals four key charts he's watching to determine whether the S&P 500 and Nasdaq 100 will be able to power through their 200-day moving averages en route to higher highs. Using the recently updated StockCharts Market Summary page, he covers moving average...
READ MORE
MEMBERS ONLY

Gold Is Showing Signs of Exhaustion, But Is It Enough to Call a Top?
by Martin Pring,
President, Pring Research
Chart 1 shows that inflation-adjusted gold recently broke above a 45-year line of resistance. Since the third leg of the secular bull market began in 2023, the price of the yellow metal has been moving up sharply, thereby propelling the long-term KST to the edge of its overbought zone. It...
READ MORE
MEMBERS ONLY
The Best Five Sectors, #18
by Julius de Kempenaer,
Senior Technical Analyst, StockCharts.com
KEY TAKEAWAYS
* Top 5 sectors remain unchanged, with minor position shifts
* Leading sectors showing signs of losing momentum
* Daily RRG reveals top sectors in weakening quadrant
* Communication services at risk of dropping out of top 5
Communication Services Drops to #5
The composition of the top five sectors remains largely...
READ MORE
MEMBERS ONLY

Two Down and Two to Go - Capitulation and Thrust are just a Start
by Arthur Hill,
Chief Technical Strategist, TrendInvestorPro.com
KEY TAKEAWAYS
* Stocks are halfway after capitulation in early April and a Zweig Breadth Thrust.
* SPY is still below its 200-day SMA and late March high.
* Follow through is needed to trigger the medium and long term signals.
The market does not always follow the same script or sequence, but...
READ MORE
MEMBERS ONLY

Week Ahead: While NIFTY Continues To Consolidate, Watching These Levels Crucial
by Milan Vaishnav,
Founder and Technical Analyst, EquityResearch.asia and ChartWizard.ae
In the truncated week due to one trading holiday, the markets extended their gains and closed the week on a positive note. While remaining largely within a defined range, the Nifty continued consolidating above its 200-DMA while not adopting any sustainable directional bias. Though the Index continued defending its key...
READ MORE
MEMBERS ONLY

Three Stocks With Post-Earnings Upside Potential
by David Keller,
President and Chief Strategist, Sierra Alpha Research
With the major averages logging a strong up week across the board, and with the Nasdaq 100 finallyretesting its 200-day moving averagefrom below, it can feel like a challenging time to take a shot at winning charts. You may ask yourself, "Do I really want to be betting on...
READ MORE
MEMBERS ONLY

The Easiest Road to Supercharge Your Investing Reflexes and Reactions!

by Gatis Roze,
Author, "Tensile Trading"
Riches are found in reactions—your reactions to changes in the markets. By this, I mean that if you spot a change in money flowing from one asset class to another, one sector to another, one industry to another, before the masses notice, you will be rewarded handsomely. My experience...
READ MORE
MEMBERS ONLY

Stock Market Wrap: Stocks Rebound as May Kicks Off with a Bang—What Investors Should Know
by Jayanthi Gopalakrishnan,
Director of Site Content, StockCharts.com
KEY TAKEAWAYS
* A strong jobs report sparked a stock market rally, with major indexes closing the week higher.
* Positive earnings from Microsoft and Meta Platforms took the Nasdaq Composite above its 50-day moving average.
* Financials, Industrials, and Technology were the leading sectors this week, with Financials showing technical strength.
We...
READ MORE
MEMBERS ONLY

Here's Why A Short-Term Top Might Be Nearing
by Tom Bowley,
Chief Market Strategist, EarningsBeats.com
I feel like the short-term risk is turning once again and I'll explain why in my analysis below. Please don't misunderstand. I suggested a bottom was in place a few weeks ago and I LOVE what has been happening in terms of manipulation/accumulation and I...
READ MORE
MEMBERS ONLY

Stocks In Focus This Week: Palantir, Uber, and Coinbase
by Jay Woods,
Chief Global Strategist, Freedom Capital Markets
KEY TAKEAWAYS
* Palantir stock nears breakout as AI revenue and government contracts drive growth.
* Uber stock signals strength ahead of earnings report.
* Coinbase eyes reversal as crypto trading volume increases.
This week, we're watching three high-profile names--Palantir (PLTR), Uber (UBER), and Coinbase (COIN)--as they gear up for...
READ MORE
MEMBERS ONLY
Top 10 Stock Charts For May 2025: Breakouts, Trends & Big Moves!
by David Keller,
President and Chief Strategist, Sierra Alpha Research
by Grayson Roze,
Chief Strategist, StockCharts.com
Discover the top 10 stock charts to watch this month with Grayson Roze and David Keller, CMT. They break down breakout strategies, moving average setups, and technical analysis strategies using relative strength, momentum, and trend-following indicators. This analysis covers key market trends that could impact your trading decisions. You don&...
READ MORE
MEMBERS ONLY

The Hidden Meaning Behind the Tech Sector's Rally (And How to Spot It)
by Karl Montevirgen,
The StockCharts Insider
KEY TAKEAWAYS
* Technology stocks are back in the lead, with ETFs like XLK showing notable performance.
* MarketCarpets gives you a quick snapshot of sector trends and market breadth.
* Indicators like the Bullish Percent Index and CMF suggest XLK may be approaching overbought territory, highlighting the need to be cautious.
When...
READ MORE
MEMBERS ONLY
Master the 18/40 MA Strategy: Spot Trend, Momentum & Entry
by Joe Rabil,
President, Rabil Stock Research
In this video, Joe demonstrates how to use the 18-day and 40-day moving averages to identify trade entry points, assess trend direction, and measure momentum. He breaks down four key ways these MAs can guide your trading decisions—especially knowing when to be a buyer. Joe also analyzes commodities, noting...
READ MORE
MEMBERS ONLY

If Non-US Equities Continue to Outperform the S&P, Will Europe or Asia Benefit Most?
by Martin Pring,
President, Pring Research
Since the tariff war first broke out, there have been widespread reports in the financial press telling us that investors have decided to cash in on their U.S. profits and move their capital abroad. The U.S., they tell us, is no longer regarded as a safe haven. Indeed,...
READ MORE