MEMBERS ONLY
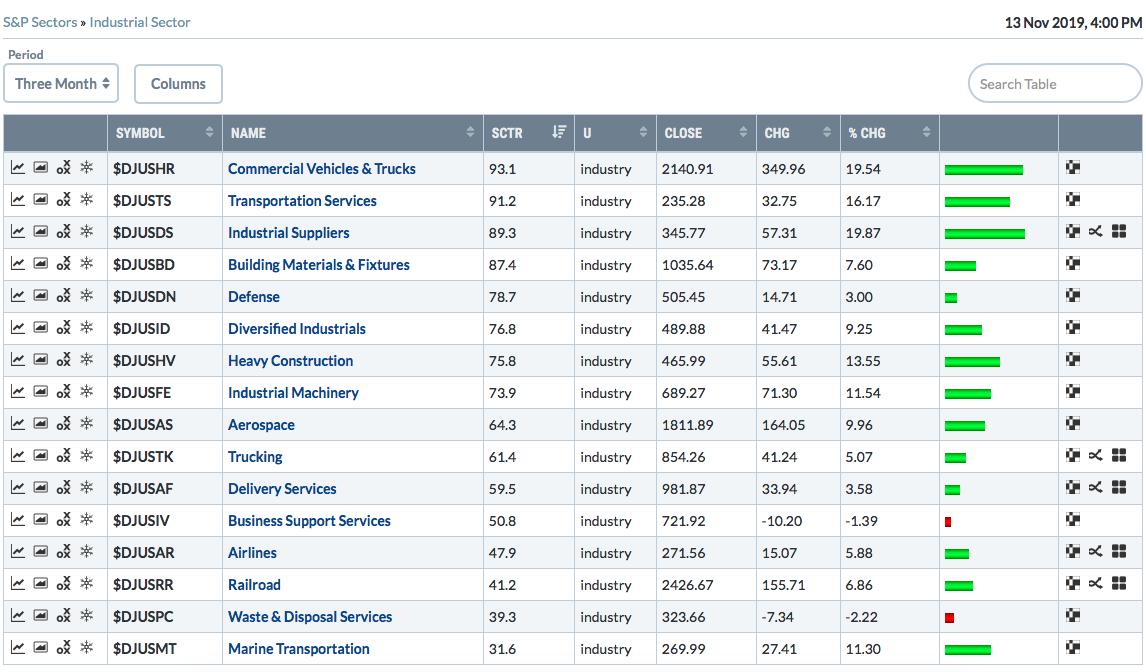
New Leadership In The Industrials, But How Do We Break Down The Group For Winners?

by Tom Bowley,
Chief Market Strategist, EarningsBeats.com
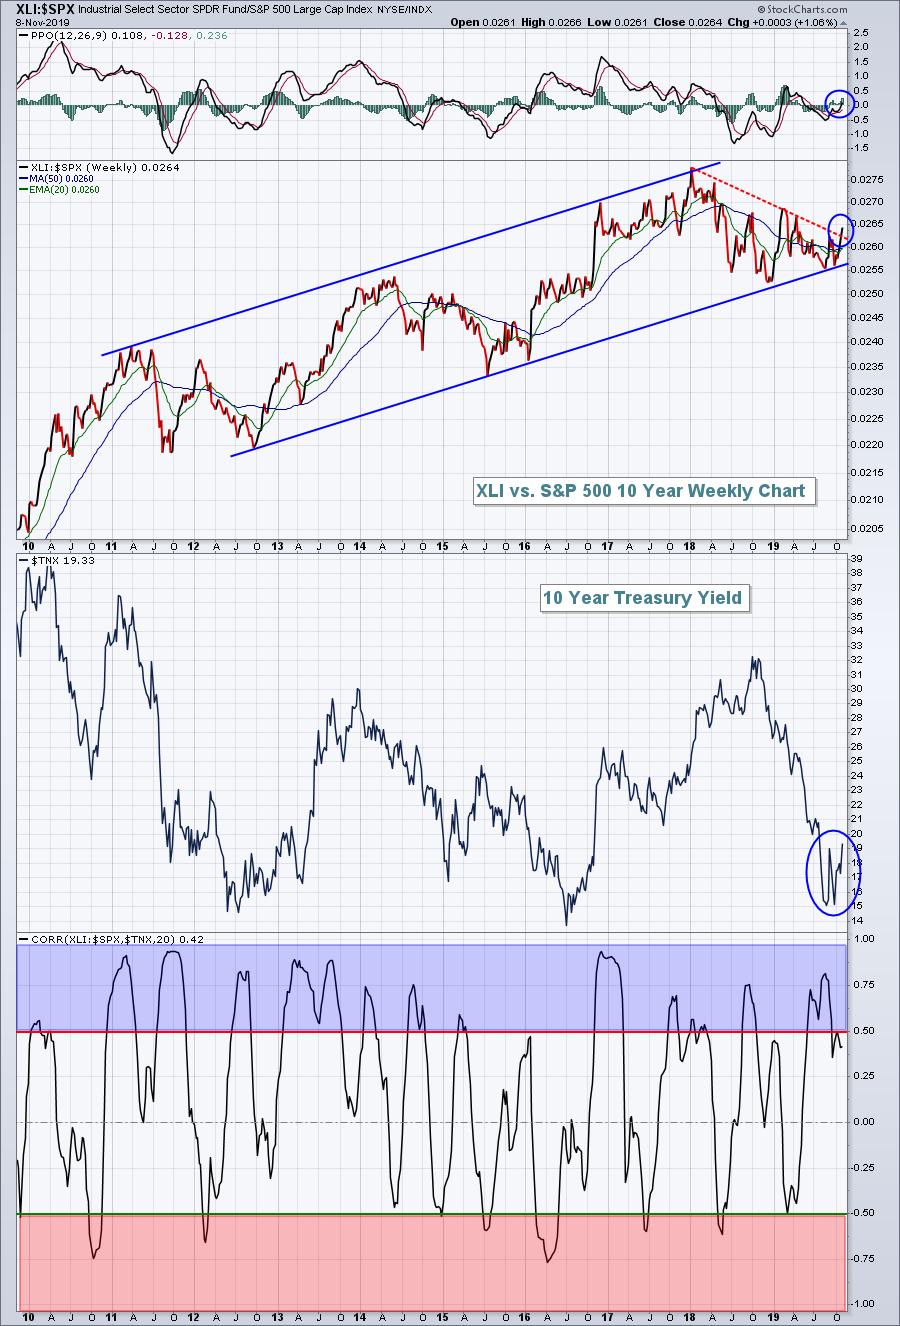
In my last article, I illustrated the relative breakout in industrials vs. the benchmark S&P 500. The market goes through cycles and leadership rotates - even during the same bull market. StockCharts.com recently added SCTR scores for industry groups, so if you're unsure as to...
READ MORE
MEMBERS ONLY

DP Alert Mid-Week: Intermediate-Term Negative Divergences Warn

by Erin Swenlin,
Vice President, DecisionPoint.com
Another week has passed and the market isn't really showing its hand. Momentum is slowing, but we haven't seen any serious pullbacks. I have been suspicious of this market since the breakout to new all-time highs, given the soft breadth numbers and the lack of positive...
READ MORE
MEMBERS ONLY

DP Daily Diamonds - Does it Bear Repeating?
by Erin Swenlin,
Vice President, DecisionPoint.com
I am finding that I get "repeats" in my scan results of stocks that I've already presented to you in recent Diamond Reports. For example, Microsoft (MSFT) and Deckers Outdoor (DECK) have found their way into today's results, but I wrote about each within...
READ MORE
MEMBERS ONLY

Money & Position Management

by Dave Landry,
Founder, Sentive Trading, LLC
In this edition of Trading Simplified, Dave discusses what you need to hear regarding money and position management, with a special focus on his "secret sauce." In addition, he also talks about last week's Mystery Chart reveal and presents a new Mystery Chart. This episode originally...
READ MORE
MEMBERS ONLY
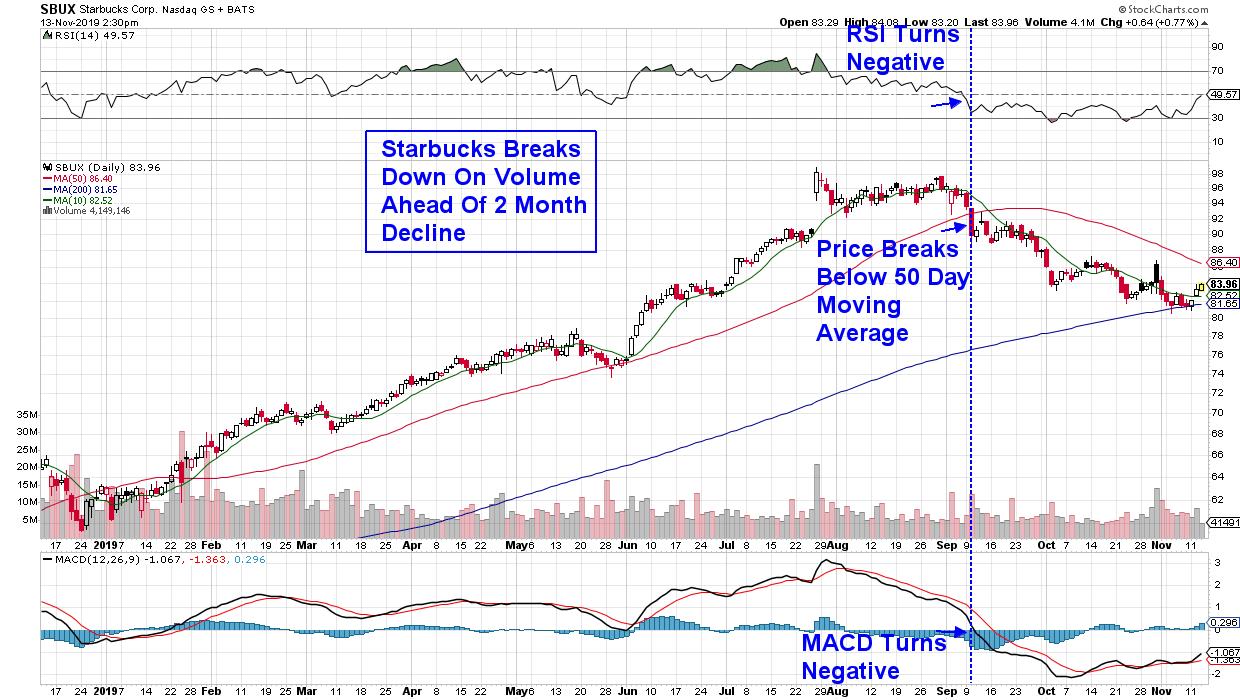
Jumping The Shark – Key Signals That Your Stock is No Longer In An Uptrend

by Mary Ellen McGonagle,
President, MEM Investment Research
Picking the right stock is a lot like catching that perfect wave. You're out there in a sea of possibilities, looking for that perfect setup. Is the stock coming out of a powerful base and ready to crest? And is there enough room for your stock to run?...
READ MORE
MEMBERS ONLY
DP Daily Diamonds - Heavy Financials
by Erin Swenlin,
Vice President, DecisionPoint.com
I would like to thank all of our veterans for their service in recognition of Veterans' Day (which was yesterday), particularly my father, who is a 20-year veteran of the USAF. As a veteran myself, I decided to take yesterday off from writing.
Today's "diamonds in...
READ MORE
MEMBERS ONLY
DP Show: Put/Call Ratios - Breadth - Swenlin Trading Oscillators Still Warn
by Erin Swenlin,
Vice President, DecisionPoint.com

by Carl Swenlin,
President and Founder, DecisionPoint.com
In this episode of DecisionPoint, Carl and Erin review the action of the S&P 500 in depth, covering the climactic and short-term indicator divergences as the market climbs. (There are problems that cannot be ignored, but they are more subtle.) Carl presents his Yield Array and sees activity...
READ MORE
MEMBERS ONLY
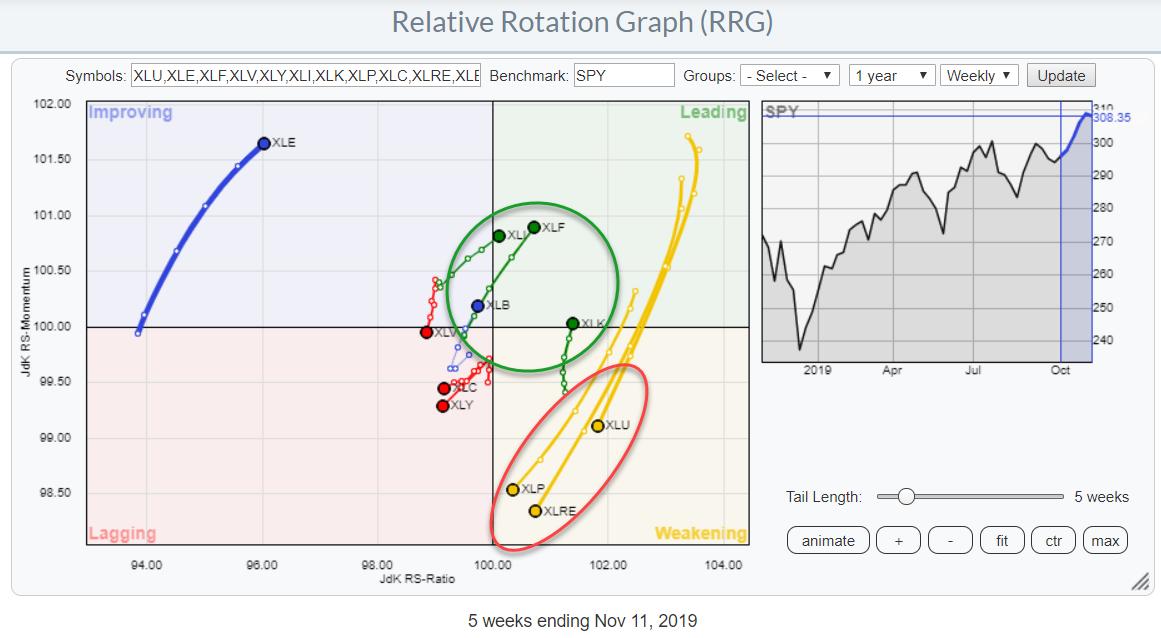
RRG Shows Bullish Sector Rotation!

by Julius de Kempenaer,
Senior Technical Analyst, StockCharts.com
As it turns out, finding an interesting chart for today's DITC article was not very difficult!
The weekly RRG, printed above, shows a very strong rotation in favor of offensive, high BETA sectors. Industrials, Financials, and Technology are already inside the leading quadrant and showing strong RRG headings....
READ MORE
MEMBERS ONLY
A Key New Theme Has Emerged
by Tom Bowley,
Chief Market Strategist, EarningsBeats.com
We've witnessed a major shift in relative strength among sectors and industry groups and in order to prepare for the overall market strength in late-2019 and into 2020, we need to recognize this fundamental shift. Below I've identified a major thematic change in the U.S....
READ MORE
MEMBERS ONLY
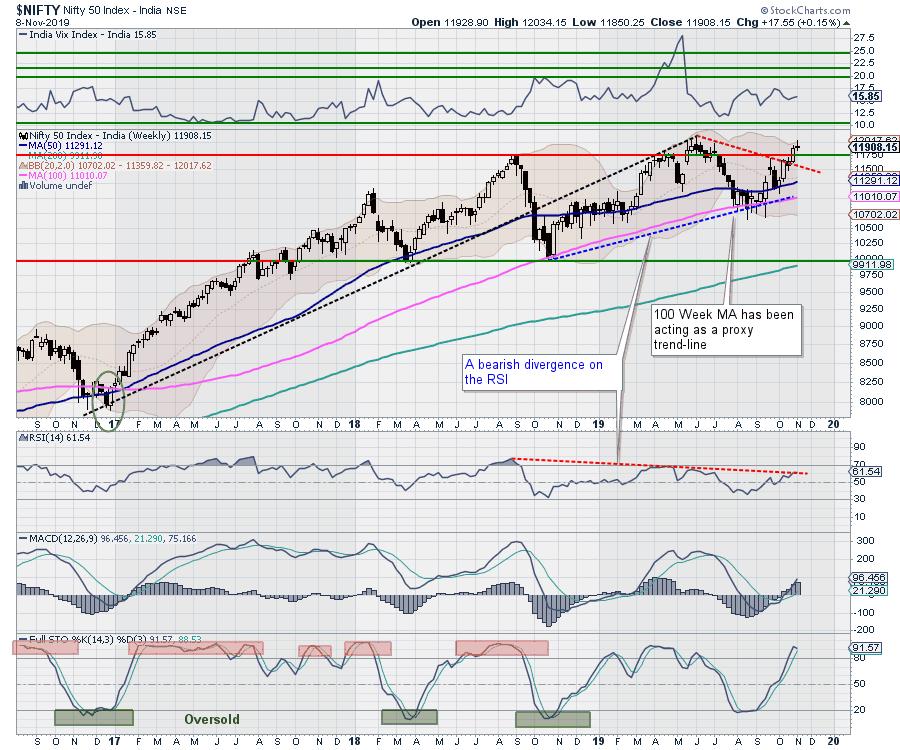
Week Ahead: Higher Levels Sustainable Only If This Bearish Divergence Is Corrected; Caution Advised

by Milan Vaishnav,
Founder and Technical Analyst, EquityResearch.asia and ChartWizard.ae
The previous week played out very much on expected lines. In our last weekly note, we mentioned that NIFTY is facing stiff resistance in the 12000-12100 area and that the bearish divergences are not allowing a clean breakout on the charts. After staying buoyant for a significant part of the...
READ MORE
MEMBERS ONLY

ECONOMICALLY-SENSITIVE STOCKS CONTINUE TO SHOW MARKET LEADERSHIP -- WHILE DEFENSIVE STOCKS FALL BEHIND -- MATERIALS ARE BEING LED HIGHER BY COPPER SHARES -- WHILE GOLD MINERS ARE LOSING GROUND -- DOW JONES NONFERROUS METALS INDEX TURNS UP

by John Murphy,
Chief Technical Analyst, StockCharts.com
WEEKLY SECTOR RANKINGS...Chart 1 lists the eleven stock market sectors in order of relative strength for the past week. There aren't any surprises there; but there is more confirmation of recent rotations within the stock market showing more confidence in the market and the global economy. Financials...
READ MORE
MEMBERS ONLY

Small-Caps Come Alive, but Microcaps Fall Short

by Arthur Hill,
Chief Technical Strategist, TrendInvestorPro.com
The Russell 2000 ETF is finally showing signs of an uptrend with the first higher-low/higher-high sequence in six months. The chart below shows the Russell 1000 ETF (IWB), the Russell 2000 ETF (IWM) and the Russell Microcap ETF (IWC) to compare highs and lows. Chartists can use this technique...
READ MORE
MEMBERS ONLY
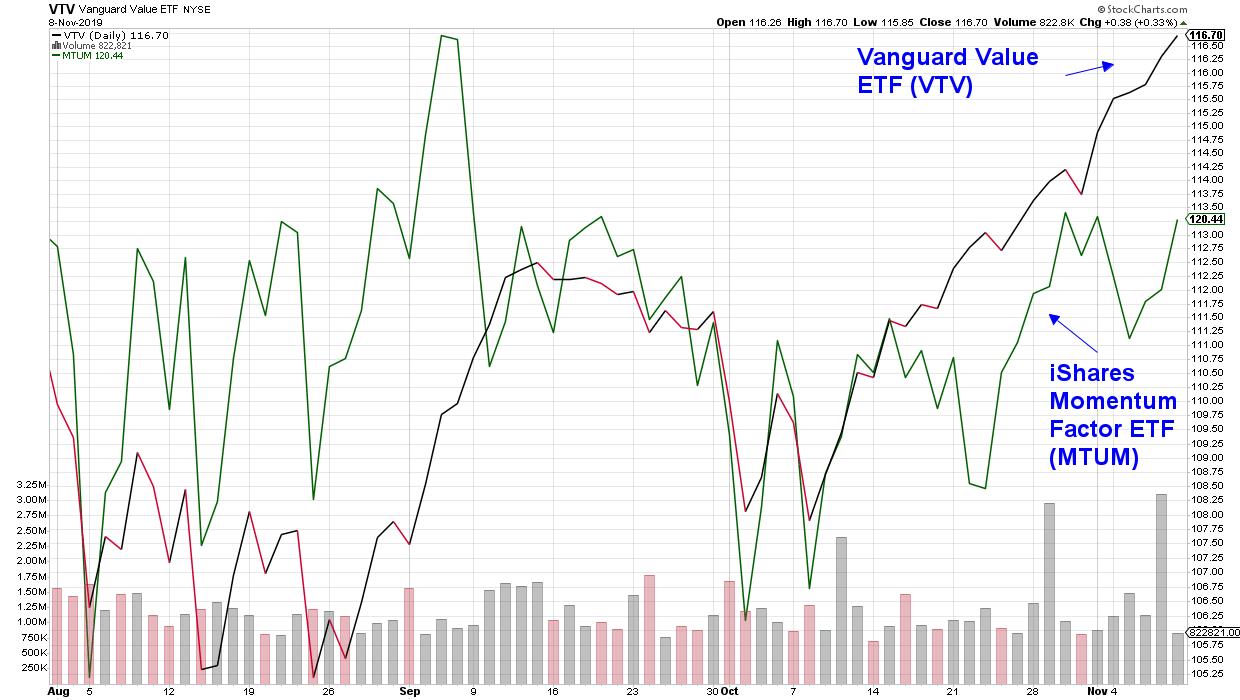
Deep Value Stocks Come Into Favor As Investors Seek Higher Yields - 2 Turnaround Candidates And An ETF For Your Review
by Mary Ellen McGonagle,
President, MEM Investment Research
There's been a rotation in the U.S. markets recently as faster moving, high growth stocks have given way to value within the U.S. As you can see in the chart below, the Vanguard Value ETF has been outpacing momentum stocks for about a month now.
Vanguard...
READ MORE
MEMBERS ONLY
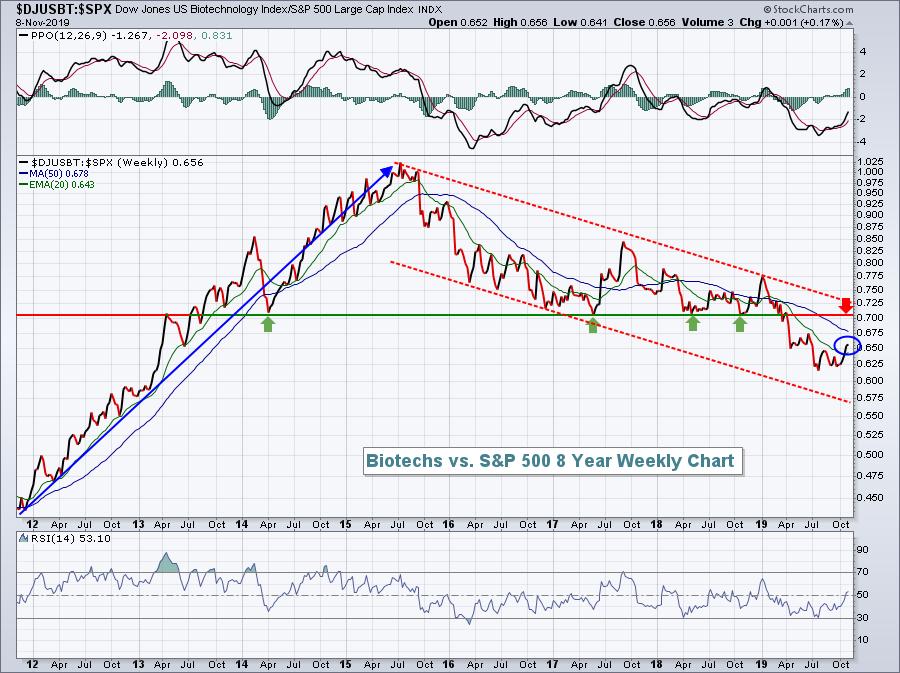
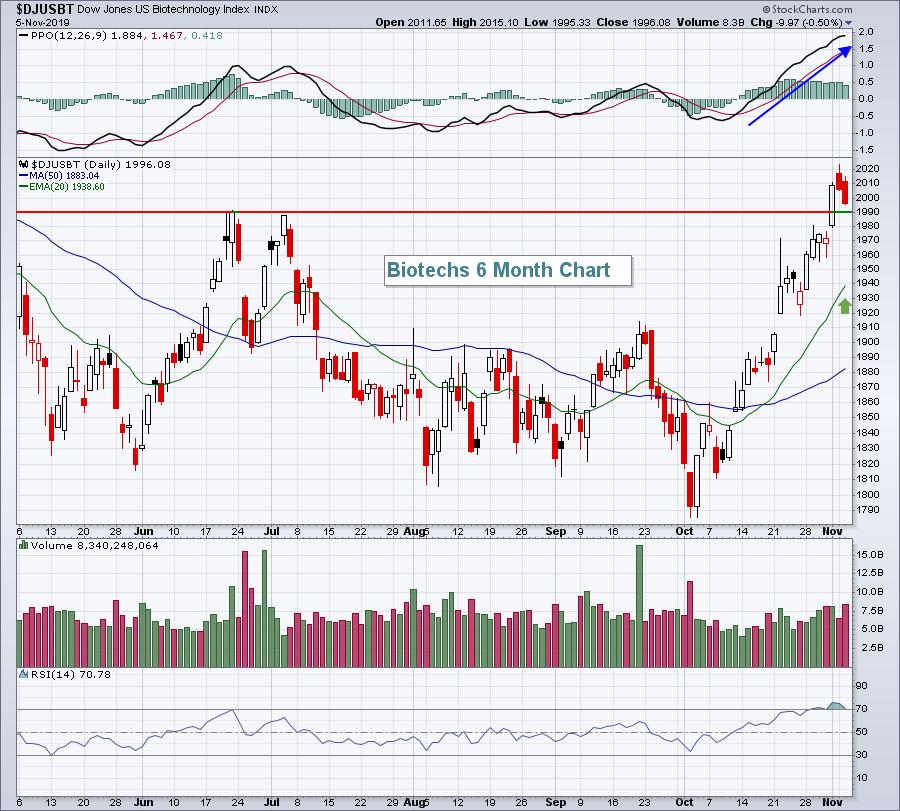
Biotechs Have Finally Caught Fire; Trading Candidates To Consider
by Tom Bowley,
Chief Market Strategist, EarningsBeats.com
When the biotechs ($DJUSBT) get rolling, make sure to jump on board for the ride! The DJUSBT broke out above 600 at the beginning of 2012; by the time the run was over 3 1/2 years later, it had gained 167%! Since the middle of 2015, this same group...
READ MORE
MEMBERS ONLY
MEM Edge TV: Tips to Point You Toward Stocks on the Move
by Mary Ellen McGonagle,
President, MEM Investment Research
On this episode of StockCharts TV'sThe MEM Edge, Mary Ellen gives her review of current markets, including sector and group rotation, before covering using ETFs to capitalize on the move into Biotechs. She also discusses exit strategies and what to look out for when using them. This episode...
READ MORE
MEMBERS ONLY
Three Tips to Upgrade Your Chart Routine

by David Keller,
President and Chief Strategist, Sierra Alpha Research
As of this article's writing, I have just passed the two-month mark after joining StockCharts.com as Chief Market Strategist. Let me tell you, it's been an absolute pleasure getting to know all of the developers that are building and maintaining the powerful set of features...
READ MORE
MEMBERS ONLY
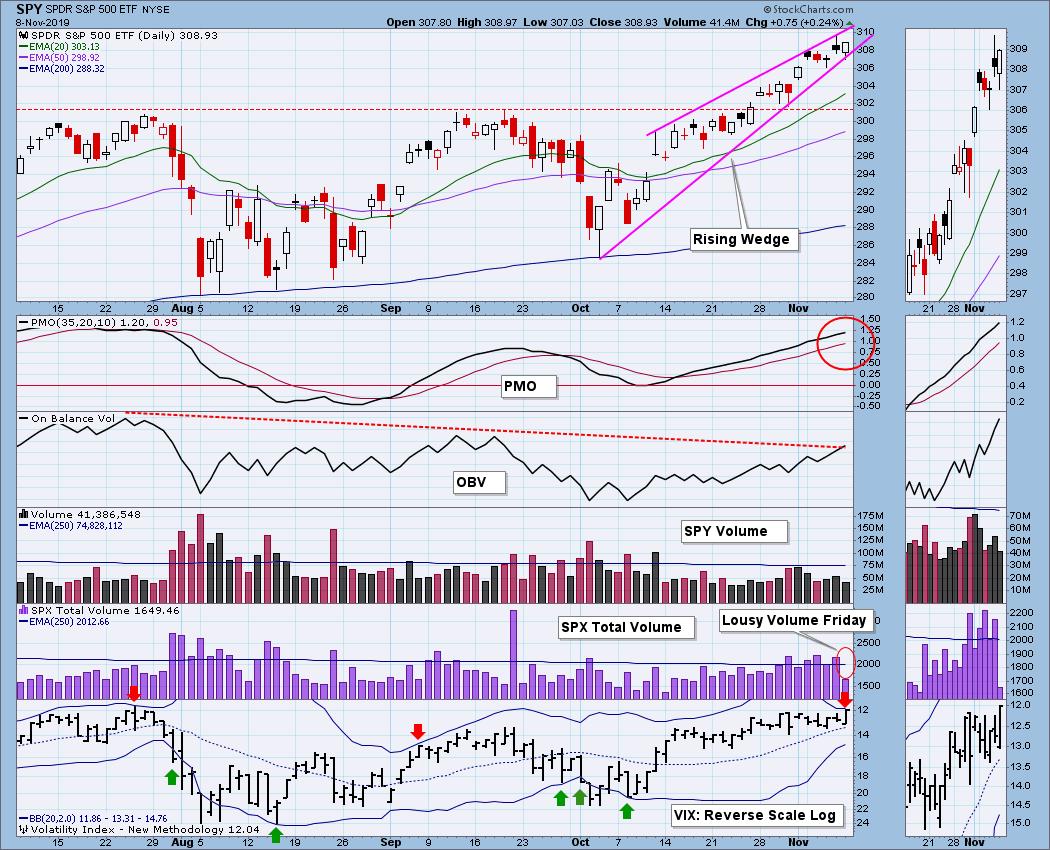
DP WEEKLY WRAP: Three Problems with SPY Chart
by Carl Swenlin,
President and Founder, DecisionPoint.com
These are not huge problems, but they do have negative implications for the short term. First, there is the rising wedge formation, a formation that will most often resolve to the downside -- not always, but most often. Next the VIX is very close to the upper Bollinger Band, which...
READ MORE
MEMBERS ONLY

Crypto Data Is Here! 24/7 Real-Time Coverage And Advanced Charting For Bitcoin, Ethereum, Litecoin And Many More

by Grayson Roze,
Chief Strategist, StockCharts.com
This week, we rolled out new data coverage for the crypto market, with real-time prices updated 24/7 and full integration into all of the tools and features you know and love on StockCharts. You can now create advanced technical charts for Bitcoin, Ethereum, Litecoin, XRP, Monero and many more....
READ MORE
MEMBERS ONLY
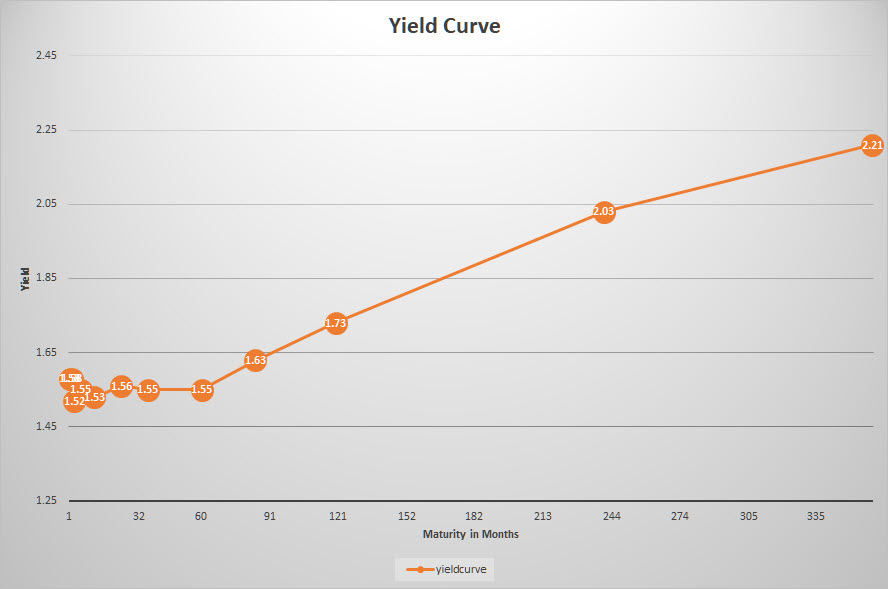
The Yield Curve, What is it? Why is it important? How can we use it?
by Julius de Kempenaer,
Senior Technical Analyst, StockCharts.com
A yield curve is a graphical representation of yields on bonds with different maturities. The most common example is the government bond yield curve, but it is very well possible to render a yield curve for other types of bonds, such as corporate bonds, high yield bonds, etc.
The government...
READ MORE
MEMBERS ONLY

COPPER AND GOLD HAVE BEEN TRENDING IN OPPOSITE DIRECTIONS FOR A YEAR -- BUT THEIR DIRECTION MAY BE CHANGING -- THE COPPER/GOLD RATIO IS BOUNCING OFF LONG-TERM SUPPORT -- RISING BOND YIELDS ALSO FAVOR COPPER OVER GOLD -- THAT'S A SIGN OF GROWING CONFIDENCE
by John Murphy,
Chief Technical Analyst, StockCharts.com
COPPER AND GOLD HAVE BEEN TRENDING IN OPPOSITE DIRECTIONS... A lot of recent intermarket rotations in global markets have started to show more optimism; along with a willingness to favor economically-sensitive and riskier assets at the expense of safe haven defensive ones. That has included the buying of stocks and...
READ MORE
MEMBERS ONLY
Recent Breakouts Say Equities are Headed Significantly Higher in the Next Six Months

by Martin Pring,
President, Pring Research
Editor's Note: This article was originally published in Martin Pring's Market Roundup on Thursday, November 7th at 1:28pm ET.
Back in mid-September, I wrote an article on US equitiesthat pointed out how several short-term indicators had reached extreme overbought levels, a sign of strong underlying...
READ MORE
MEMBERS ONLY
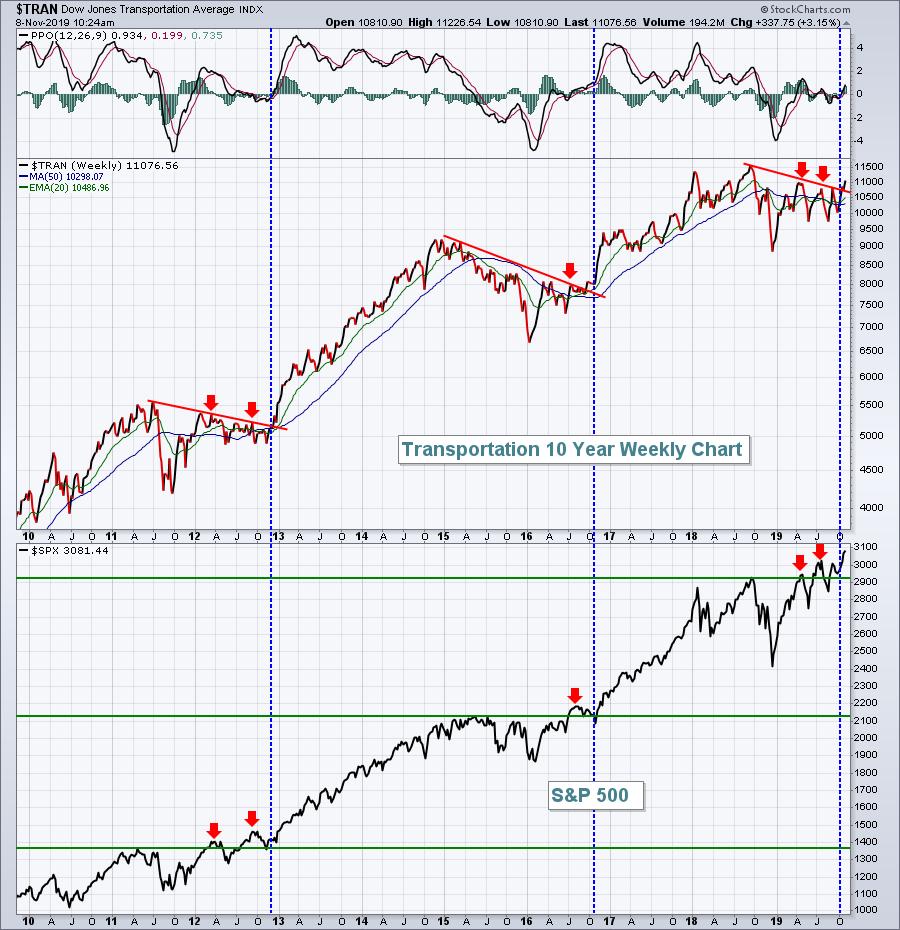
Transports Will Lead A Major Bull Market Rally During Q4 And Throughout 2020
by Tom Bowley,
Chief Market Strategist, EarningsBeats.com
I've maintained a bullish stance throughout the past 21 months of stock market turbulence. My signals simply reminded me to ignore the negative media and all the attempts to take the stock market lower. Don't follow CNBC's rhetoric. If they were right, we'...
READ MORE
MEMBERS ONLY
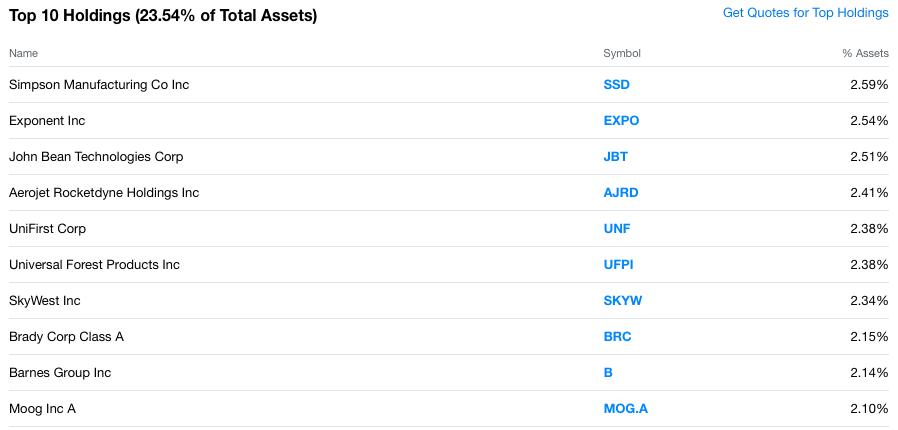
Breaking Down Small Cap Industrials - What To Buy?
by Tom Bowley,
Chief Market Strategist, EarningsBeats.com
I wrote an article earlier this morning in the free EarningsBeats Digest newsletter that showed the Invesco S&P SmallCap Industrials ETF (PSCI) outperforming its larger cap counterpart industrials sector ETF (XLI) over the past few months, a change from what we'd grown accustomed to since August...
READ MORE
MEMBERS ONLY
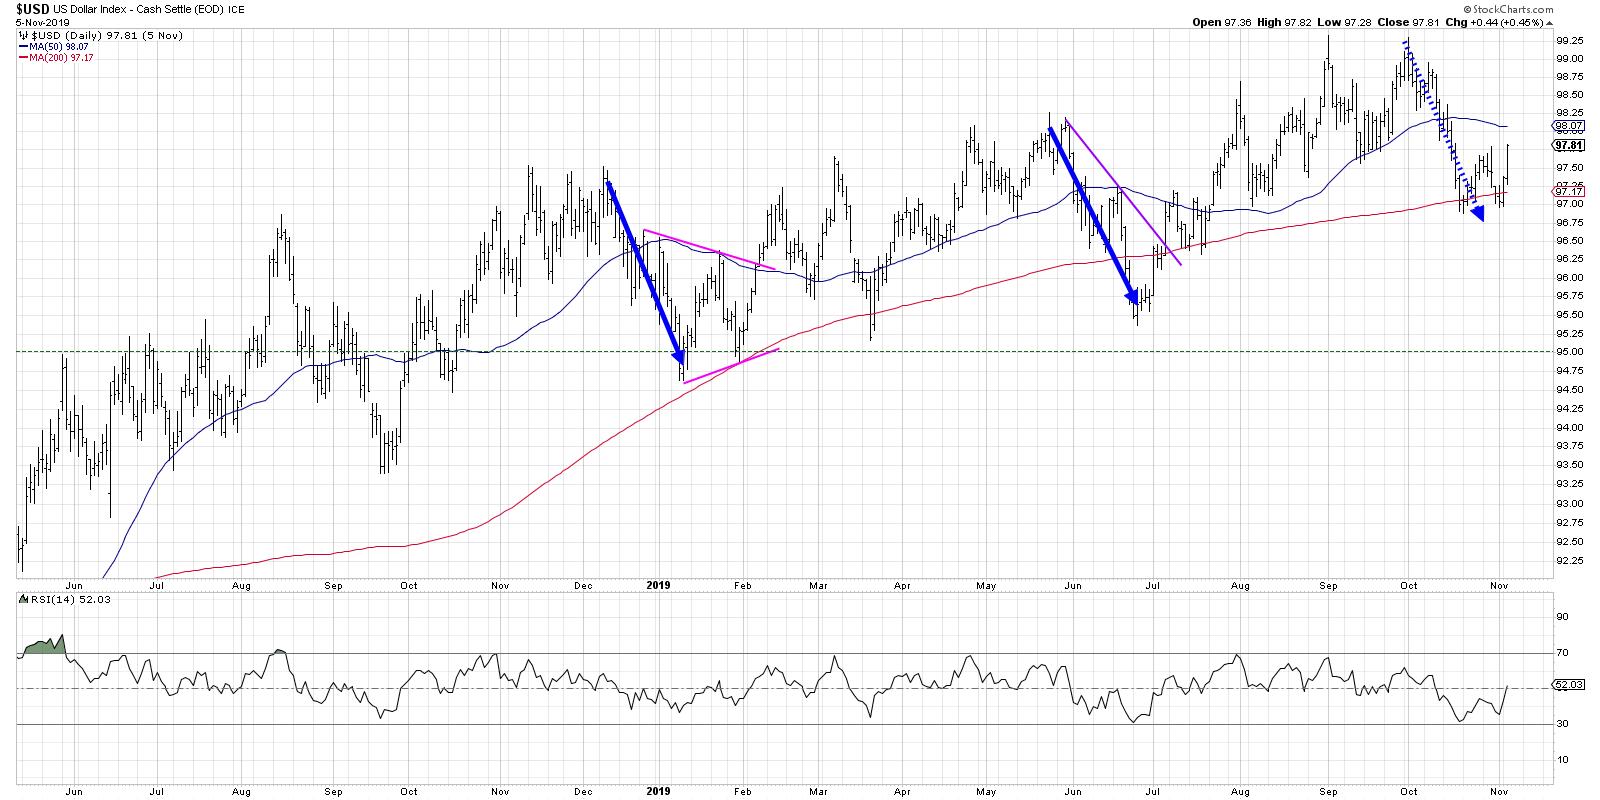
DP Daily Diamonds - Dollar (UUP) Sparkles Along with Retailers
by Erin Swenlin,
Vice President, DecisionPoint.com
I follow the Dollar and UUP, the companion ETF, as part of the "Big Four" in the DecisionPoint Alert. (Carl follows it as well in his Friday Weekly Wrap.) I wrote yesterday that it was looking good; today, it was among my scan results with two new BUY...
READ MORE
MEMBERS ONLY
Bitcoin Forecast

by Larry Williams,
Veteran Investor and Author
On this episode ofReal Trading with Larry Williams, Larry discusses the best seasonal trades of the year for 6 stocks, presents a new Great Unknown Growth Stock and presents his forecast for Bitcoin ($BTCUSD). Additionally, Larry presents a new contest question and answer. This episode originally aired on November 7th,...
READ MORE
MEMBERS ONLY
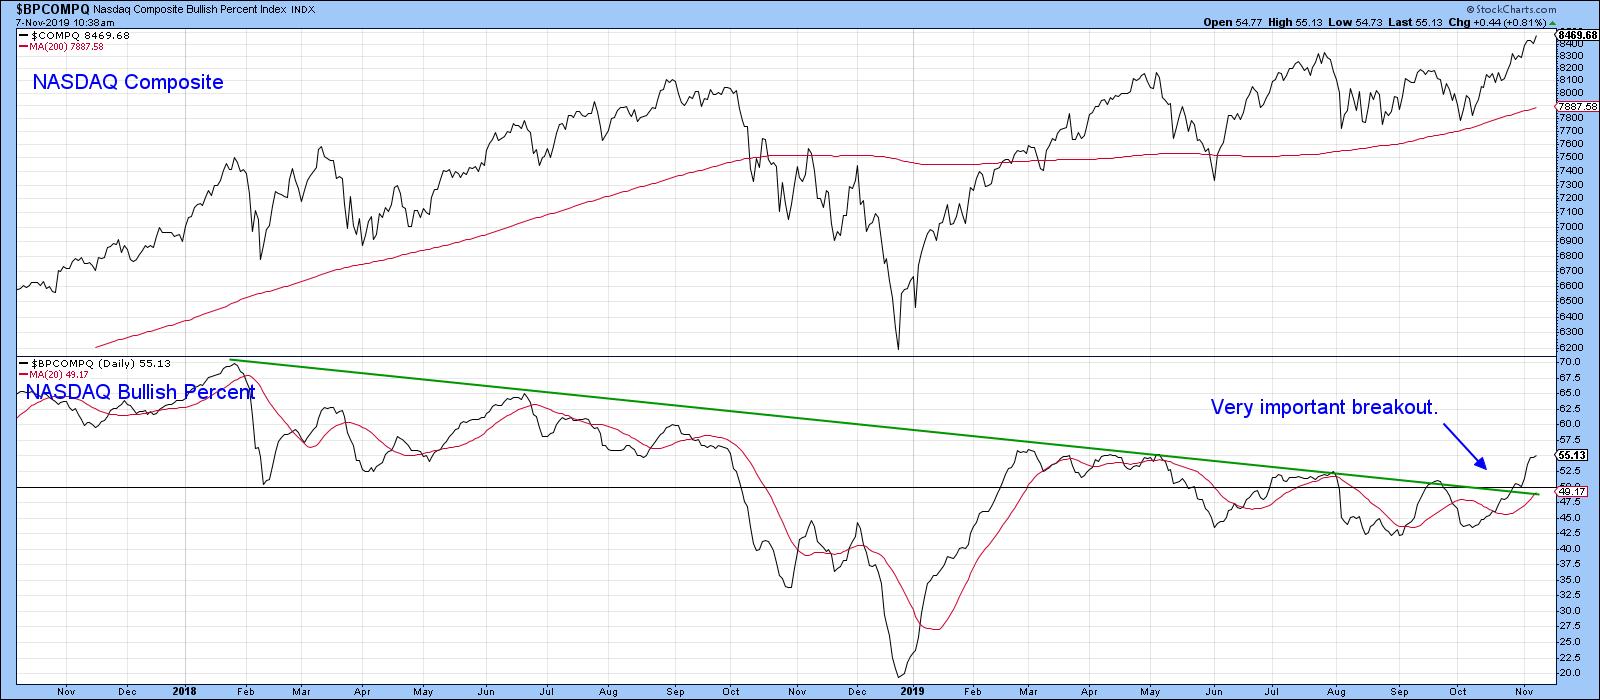
Two Recent Breakouts Say Equities Are Headed Significantly Higher In The Next Six Months
by Martin Pring,
President, Pring Research
* Two Meaningful Breakouts
* One Chart Still to Break Out
Back in mid-September, I wrote an article on US equitiesthat pointed out how several short-term indicators had reached extreme overbought levels, a sign of strong underlying momentum that historically had been followed by higher prices. However, since overbought conditions are typically...
READ MORE
MEMBERS ONLY

TRADE OPTIMISM PUSHES STOCK INDEXES FURTHER INTO RECORD TERRITORY -- SECTOR LEADERS ARE ENERGY, FINANCIALS, INDUSTRIALS, TECHNOLOGY, AND MATERIALS -- TEN-YEAR BOND YIELD TESTS SEPTEMBER HIGH AND PUSHES BOND PROXIES LOWER -- TRANSPORTS HIT 52-WEEK HIGHS
by John Murphy,
Chief Technical Analyst, StockCharts.com
STOCK INDEXES HIT NEW RECORDS... Optimism on trade between the U.S. and China is pushing risk assets higher and defensive ones lower. All three major U.S. stock indexes are hitting new records this morning. Chart 1 shows the S&P 500 in record territory. Eight sector SPDRs...
READ MORE
MEMBERS ONLY
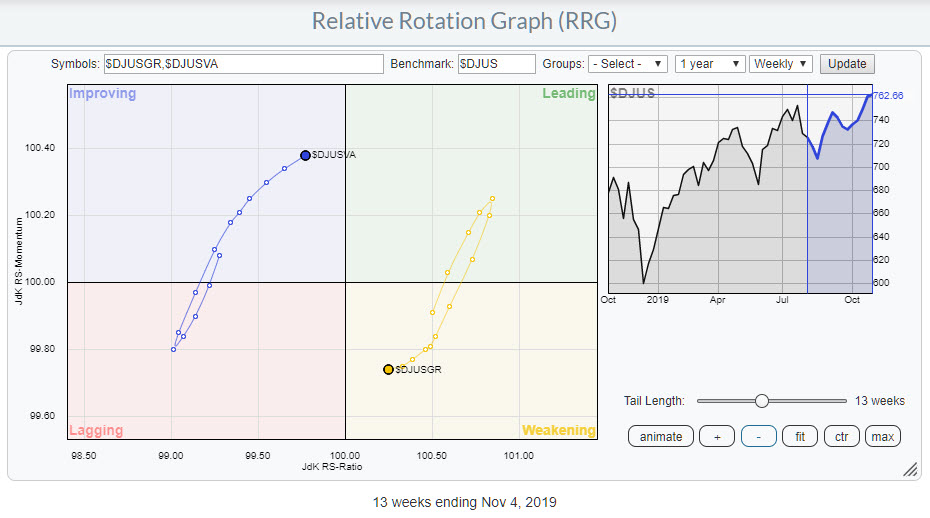
Growth vs Value... a Tough Call At The Moment!
by Julius de Kempenaer,
Senior Technical Analyst, StockCharts.com
The Growth vs. Value relationship is always an interesting topic, as many believe it provides (additional) information or support for directional moves in the general market (S&P 500).
The Relative Rotation Graph above shows the relationship between these two market segments, using the DJ US index as the...
READ MORE
MEMBERS ONLY
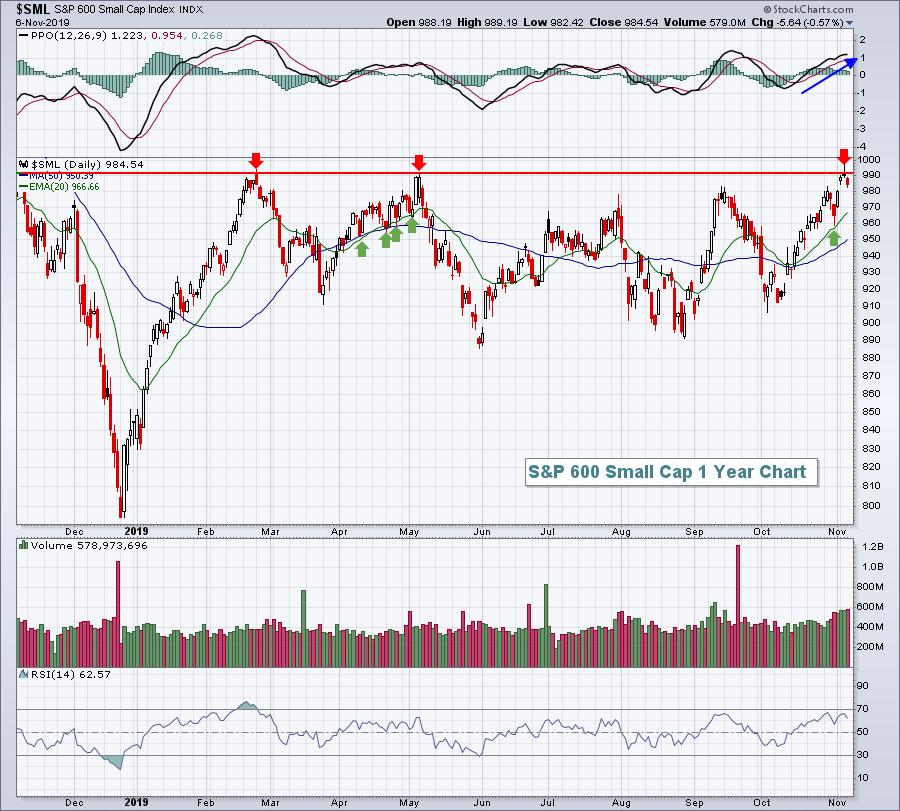
S&P 600 Small Cap Index Fails At Resistance - What Does It Mean?
by Tom Bowley,
Chief Market Strategist, EarningsBeats.com
Well, at first it simply means that there were enough sellers to hold off the bulls on their initial attempt to join the Dow Jones, S&P 500 and NASDAQ in breakout territory. I wouldn't worry a whole lot, however, as I believe it's just...
READ MORE
MEMBERS ONLY
DP Alert Mid-Week: Put/Call Ratios are Overbought - New Perspective on Swenlin Trading Oscillators
by Erin Swenlin,
Vice President, DecisionPoint.com
Last Friday, all four indexes on the Scoreboards had weekly PMO crossover BUY signals. It is hard to argue a Scoreboard that is this positive, but I still see a few problems that I'll talk about further. Carl and I discussed a new version of the Swenlin Trading...
READ MORE
MEMBERS ONLY
DP Daily Diamonds - A Couple of Big Names, Boeing (BA) and Owens Corning (OC)
by Erin Swenlin,
Vice President, DecisionPoint.com
It isn't always the case, but today I had a few "big" large-cap names hit my scans that I think could be "diamonds in the rough." At the same time, though, I had a very low-volume stock hit the radar among these giants. I&...
READ MORE
MEMBERS ONLY
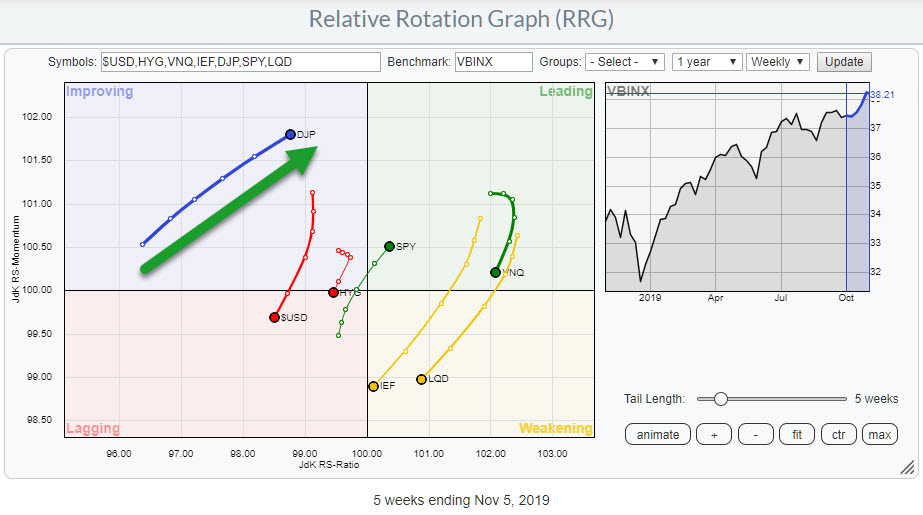
Emerging Commodities?
by Julius de Kempenaer,
Senior Technical Analyst, StockCharts.com
Yesterday, 5 November, was the first Sector Spotlight show of the month. My goal is to use every first show of each month to review the big picture for asset classes and US sectors using monthly charts, and that's exactly what I did yesterday. If you missed the...
READ MORE
MEMBERS ONLY
Trading the Trend Knockout
by Dave Landry,
Founder, Sentive Trading, LLC
In this edition of Trading Simplified, Dave discusses the concept of Trading the Trend Knockout (TKO), a strategy to take advantage of the predicament of other traders. In addition, he brings back the "Mystery Chart" segment, which includes two new TKO mystery charts. This episode originally aired on...
READ MORE
MEMBERS ONLY

New High Parade Extends - What About the Consumer Discretionary SPDR?
by Arthur Hill,
Chief Technical Strategist, TrendInvestorPro.com
The new high parade continued this week with the S&P 500 SPDR and four sector SPDRs hitting new highs. The Technology SPDR (XLK), Industrials SPDR (XLI), Finance SPDR (XLF) and Materials SPDR (XLB) recorded new 52-week highs. The Healthcare SPDR (XLV) recorded a new high for 2019, but...
READ MORE
MEMBERS ONLY
The Emerging Performance of Global Markets
by David Keller,
President and Chief Strategist, Sierra Alpha Research
I wrote a while back about Home Bias, which describes how investors tend to stay "close to home" when making their investment decisions. Not only do US-based investors often invest exclusively in American companies, they also overweight companies that are closer to them geographically within the U.S....
READ MORE
MEMBERS ONLY
This Group Could Be Poised For A 50% Rise Over The Next 1-2 Years
by Tom Bowley,
Chief Market Strategist, EarningsBeats.com
There are two groups, when they get rolling, that you do not want to miss. The first is semiconductors ($DJUSSC), which have exploded through resistance over the past two weeks and are higher by roughly 30% since June. KLA Corp (KLAC), Teradyne (TER), Advanced Micro Devices (AMD), Lam Research (LRCX)...
READ MORE
MEMBERS ONLY
DP Daily Diamonds - Energy Looking Interesting
by Erin Swenlin,
Vice President, DecisionPoint.com
Today, the Energy ETF (XLE) triggered a new Intermediate-Term Trend Model BUY signal for the first time in months. I was already seeing more energy-related stocks in my DecisionPoint scans, so I wasn't totally surprised to see that the sector is appearing to make a comeback. It has...
READ MORE
MEMBERS ONLY

HIGHER BOND YIELDS AND A STEEPER YIELD CURVE PROBABLY ACCOUNT FOR RECENT STOCK ROTATIONS INTO FINANCIALS AND CYCLICAL STOCKS -- THAT MAY ALSO EXPLAIN RECENT BUYING OF SMALL CAPS AND TRANSPORTS -- AND WHY FINANCIALS ARE THE PAST MONTH'S STRONGEST SECTOR
by John Murphy,
Chief Technical Analyst, StockCharts.com
HIGHER BOND YIELDS STARTED ROTATION INTO FINANCIALS AND INDUSTRIALS... My message from two weeks ago (October 25) suggested that the recent rise in bond yields and the steeper yield curve over the last two months may explain several rotations with the stock market. The main focus was on financials which...
READ MORE
MEMBERS ONLY
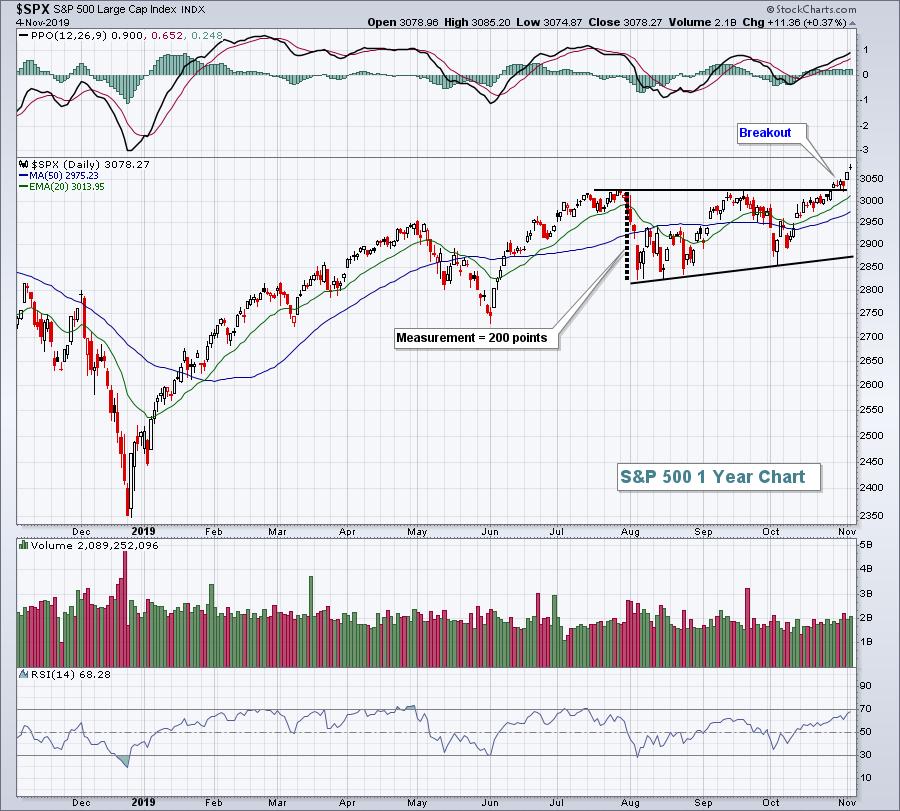
How Can You Spot A Top In All-Time High Territory?
by Tom Bowley,
Chief Market Strategist, EarningsBeats.com
I generally look to prior price highs in determining overhead resistance, but in the case of all-time highs, there are none. So where do we go next? From a bigger picture outlook, we can use pattern measurements. Based on the recent ascending triangle breakout, I'd look to 3225...
READ MORE
MEMBERS ONLY
DP Show: The Passive Investment Bubble
by Erin Swenlin,
Vice President, DecisionPoint.com
by Carl Swenlin,
President and Founder, DecisionPoint.com
In this episode of DecisionPoint, Carl and Erin talk about the negative divergences on the Swenlin Trading Oscillators. Afterwards, they dig into what the believe could be the next "bubble" - ETFs. Despite being excellent vehicles for trading, indexed ETFs could be pushing the stock market toward the...
READ MORE