MEMBERS ONLY
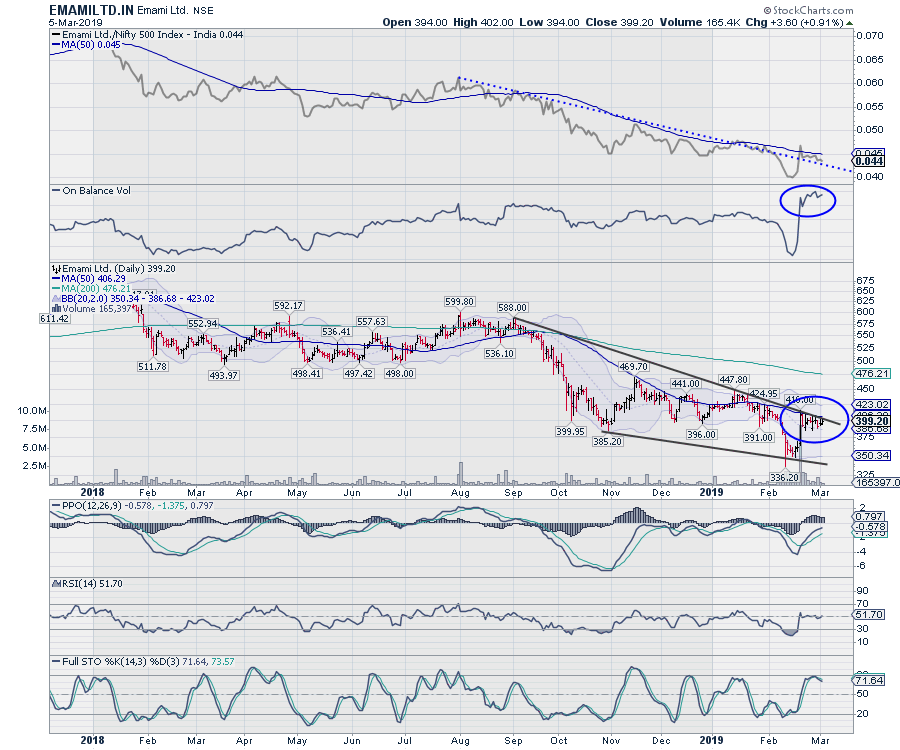
EMAMI Limited - Up for a Trend Reversal?

by Milan Vaishnav,
Founder and Technical Analyst, EquityResearch.asia and ChartWizard.ae
Emami Limited is one of the leading and fastest growing personal and healthcare businesses in India, with an enviable portfolio of household brand names such as BoroPlus, Navratna, Fair and Handsome, Zandu Balm, Mentho Plus Balm, Fast Relief and Kesh King.
The stock price of EMAMILTD.IN has been under-performing...
READ MORE
MEMBERS ONLY
This Financial Sector Group Has Caught Fire

by Tom Bowley,
Chief Market Strategist, EarningsBeats.com
Market Recap for Monday, March 4, 2019
It's really hard for me to say who won yesterday's market battle. Obviously, we finished lower so I guess that would be the determining factor to say the bears won this battle. But it sure felt like at least...
READ MORE
MEMBERS ONLY

S&P 500 Trending

by Bruce Fraser,
Industry-leading "Wyckoffian"
The Wyckoff Method constructs trendlines somewhat differently than other popular technical methods. Mr. Wyckoff’s trendline method is obscure and not in wide usage. The main benefit of this construction technique is to support effective trading setups as the trend is unfolding. Trends (all timeframes) tend to set the rate...
READ MORE
MEMBERS ONLY

Pair Analysis - 4

by Greg Morris,
Veteran Technical Analyst, Investor, and Author
This will wrap up the Pair Analysis series. In this article I will show:
Some basic statistics on the pairs I used in the analysis.
The top 50 pairs based on performance.
The bottom 50 pairs based on performance.
The Sharpe Ratio is a measure of return and risk, with...
READ MORE
MEMBERS ONLY
The NASDAQ Is Showing Little Signs of Topping
by Tom Bowley,
Chief Market Strategist, EarningsBeats.com
Market Recap for Friday, March 1, 2019
U.S. equities rallied strongly at the open on Friday, then gave back most, if not all, of those gains by late morning, and finally rallied once again in the afternoon. While intraday volatility was high and different, the end result was what...
READ MORE
MEMBERS ONLY

Google Goes Gaga

by Arthur Hill,
Chief Technical Strategist, TrendInvestorPro.com
Google, or rather Alphabet, broke out of a short-term consolidation and this could have long-term implications.
The chart below shows GOOGL hitting support in the 980-1000 area from October to December. This support zone extends back to December 2017 and represents a whole lot of demand. Buyers are clearly active...
READ MORE
MEMBERS ONLY
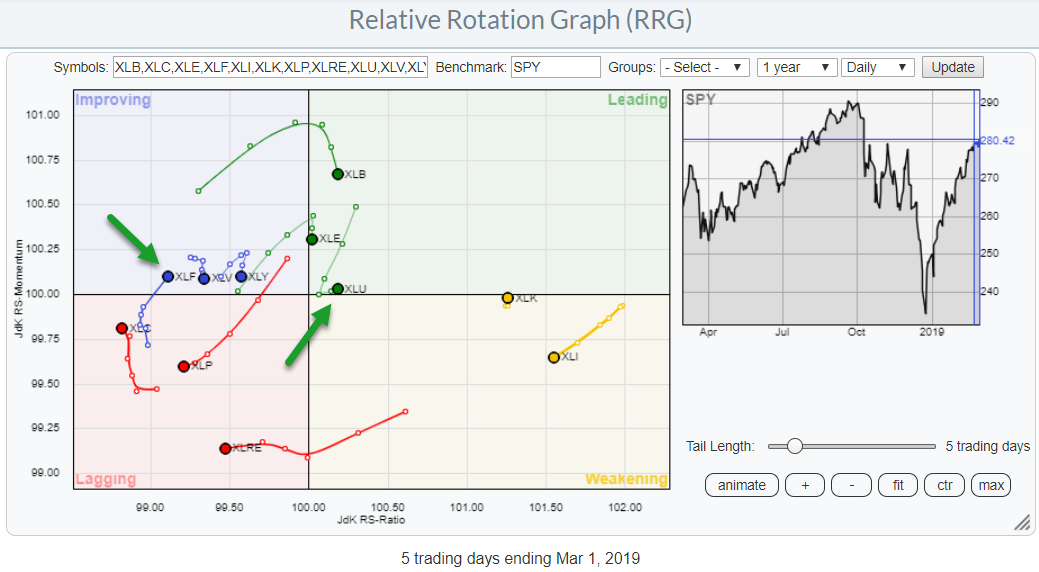
Something that makes me go ...Hmmmmmmm?

by Julius de Kempenaer,
Senior Technical Analyst, StockCharts.com
The daily RRG for US sectors shows a lot of sectors "hooking" lower and only two sectors that are, still, at a positive RRG-Heading, ie rising on both axes.
The chart above is showing a 5-day tail on every sector. if we look at the lengths and trajectories...
READ MORE
MEMBERS ONLY
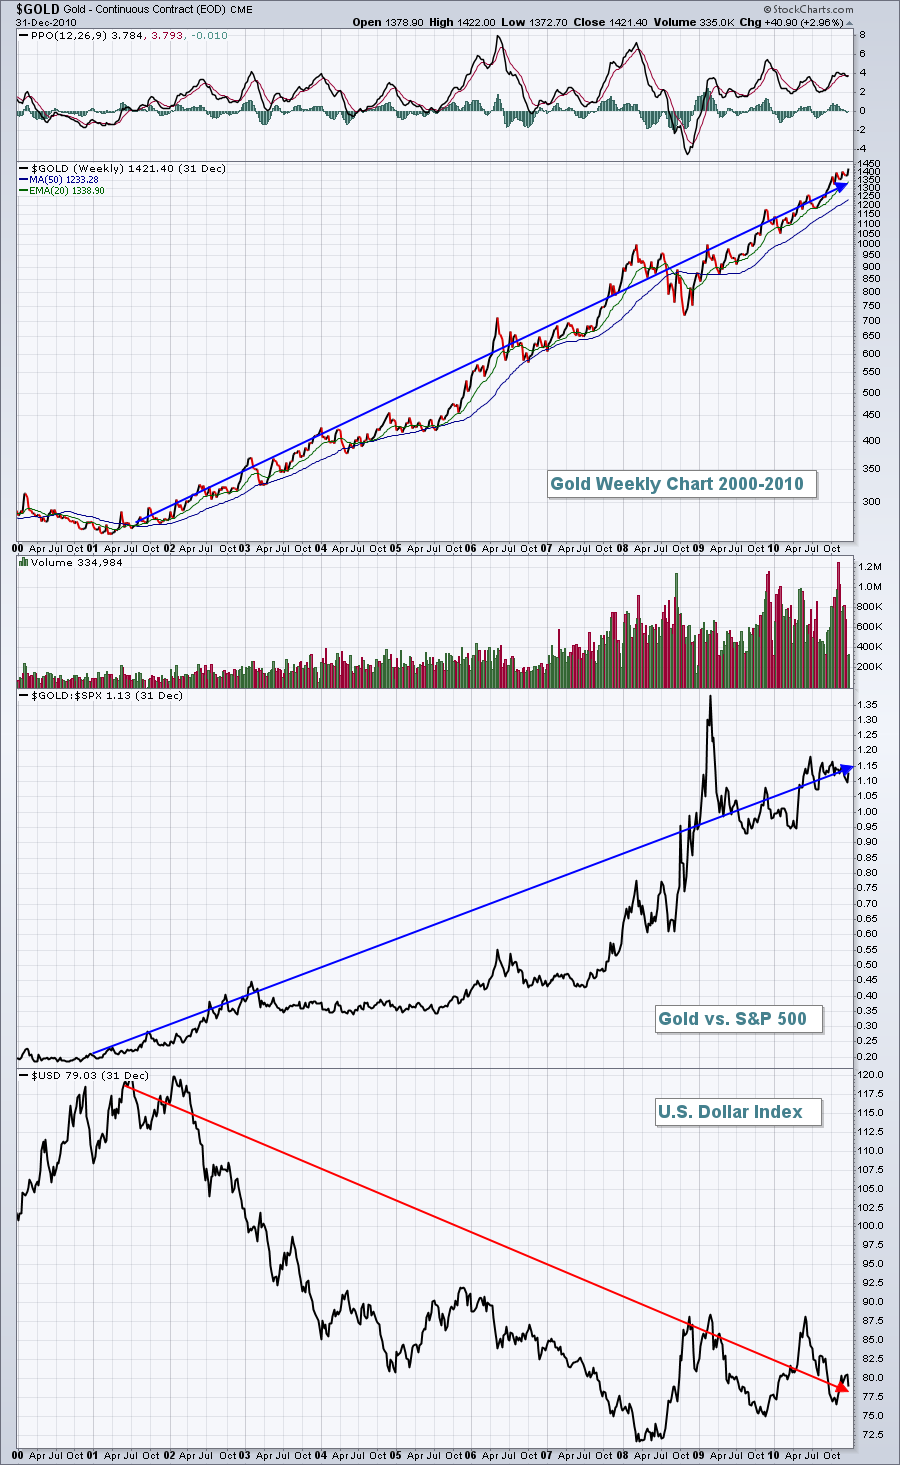
The Gold Rush Is Likely Over
by Tom Bowley,
Chief Market Strategist, EarningsBeats.com
Gold ($GOLD) performs its best in a falling U.S. Dollar ($USD) environment. There is a solid inverse relationship between the direction of GOLD and the direction of the USD that has existed for decades. The following chart illustrates this relationship from 2001 to 2010:
"Gold thrives when the...
READ MORE
MEMBERS ONLY

NIFTY Set-up For The Coming Week: Taking Out Imp Levels Necessary; These Pockets May Relatively Outperform
by Milan Vaishnav,
Founder and Technical Analyst, EquityResearch.asia and ChartWizard.ae
For yet another week, the markets took no directional call, going on to end the week with modest gains. The NIFTY remained within a broadly-defined range throughout the week, making some gains towards the end that halted near the 200-DMA. On the weekly charts, the index continued with its sideways...
READ MORE
MEMBERS ONLY
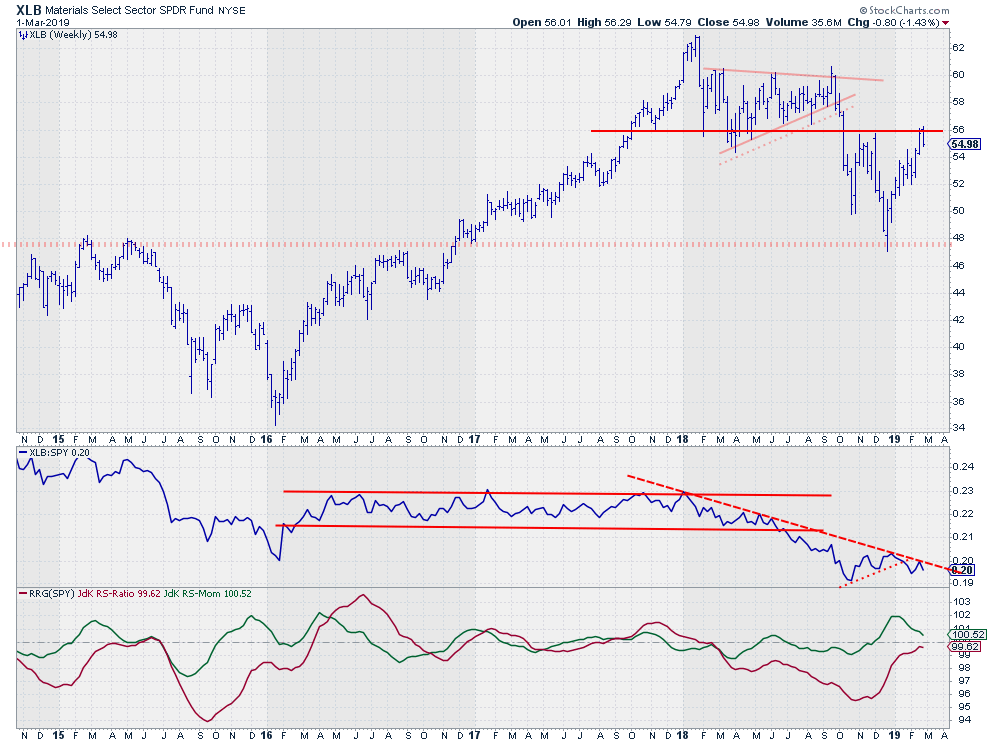
Materials (XLB) Are Failing To Break Resistance And Lose Relative Strength
by Julius de Kempenaer,
Senior Technical Analyst, StockCharts.com
The Materials sector, XLB, is testing overhead resistance around $56. This is the level where lows have been formed in 2017 and 2018 as well as two important highs at the end of 2018. For the time being, the attempt to break is failing, and this is visible on both...
READ MORE
MEMBERS ONLY

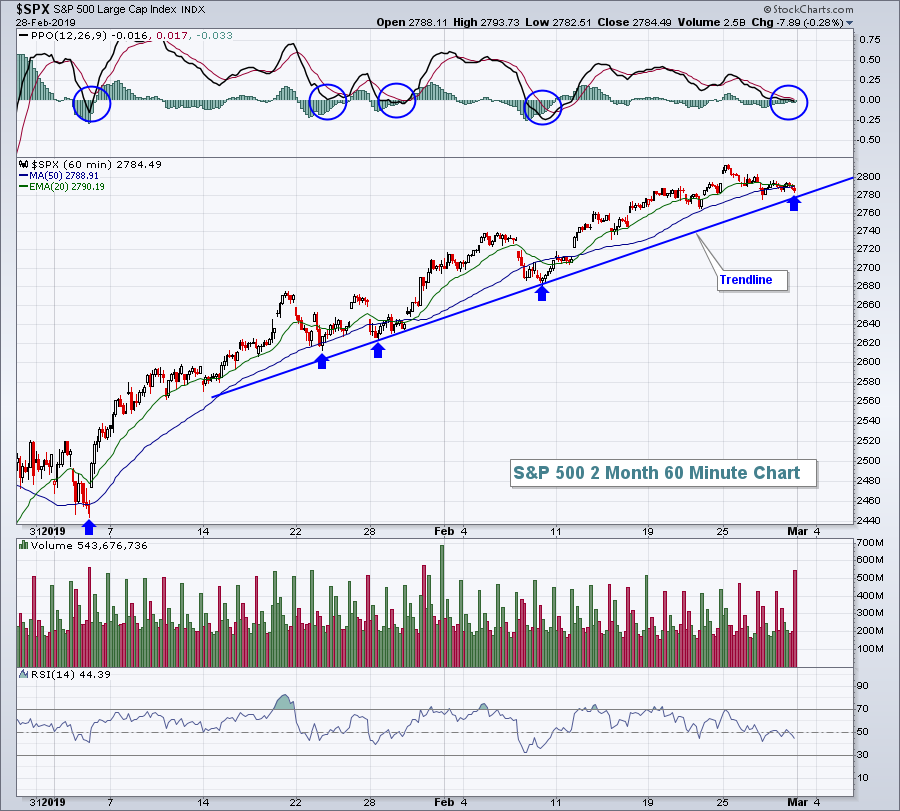
S&P 500 Clears the 200-day. Should we Take the Bait?
by Arthur Hill,
Chief Technical Strategist, TrendInvestorPro.com
We are all well aware of the S&P 500 and the 200-day moving average, but how well does this moving average work for broad market timing? Pretty well, it turns out, but only on the long side.
I put the 200-day moving average to the test for the...
READ MORE
MEMBERS ONLY
Major Stock Indexes Continue to Test Overhead Resistance Near Their November Highs

by John Murphy,
Chief Technical Analyst, StockCharts.com
Editor's Note: This article was originally published in John Murphy's Market Message on Friday, March 1st at 11:55am ET.
After having one of the strongest starts to a new year in history, major stock indexes find themselves testing yet another potential overhead resistance barrier. And...
READ MORE
MEMBERS ONLY
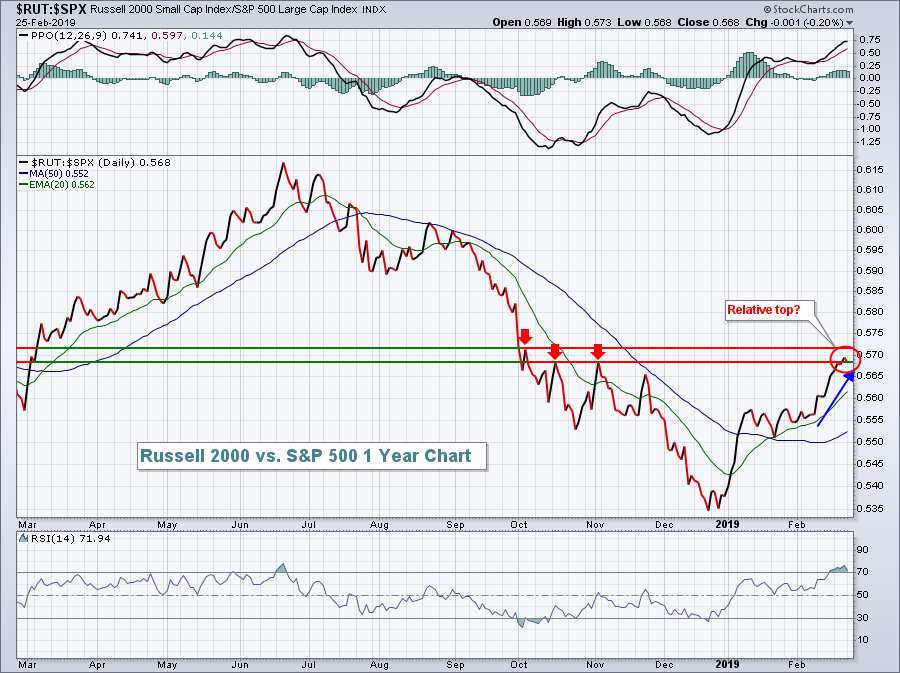
Mid- and Small-Cap Relative Performance Matters! Don't Miss These Crossovers!

by Erin Swenlin,
Vice President, DecisionPoint.com
While comparing the relative performance of the OEX, IJH and IWM to the SPX, I found an attention flag. The market is very overbought, with momentum indicators rolling over in overbought territory. The same thing goes for all the sectors. A CandleGlance of the sector SPDRs and SPX are all...
READ MORE
MEMBERS ONLY
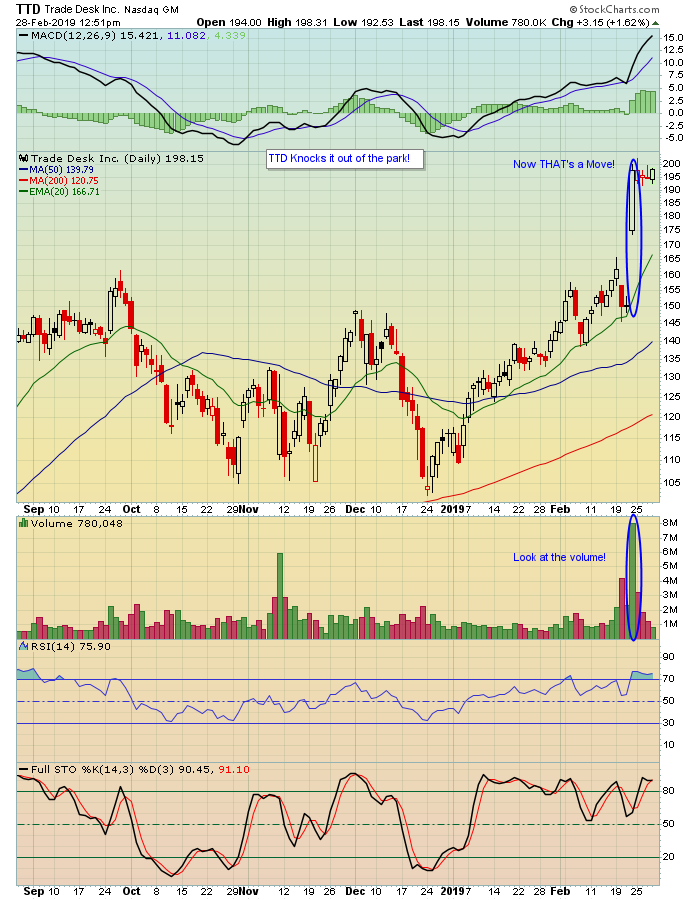
A Treasure Chest Awaits You

by John Hopkins,
President and Co-founder, EarningsBeats.com
SO MANY stocks that recently reported earnings beat expectations and gapped up sharply on very strong volume after their results were released. Those stocks include OLED, TTD, W and PANW, among others. In fact, take a look at the chart below on TTD, which reported its earnings before the bell...
READ MORE
MEMBERS ONLY
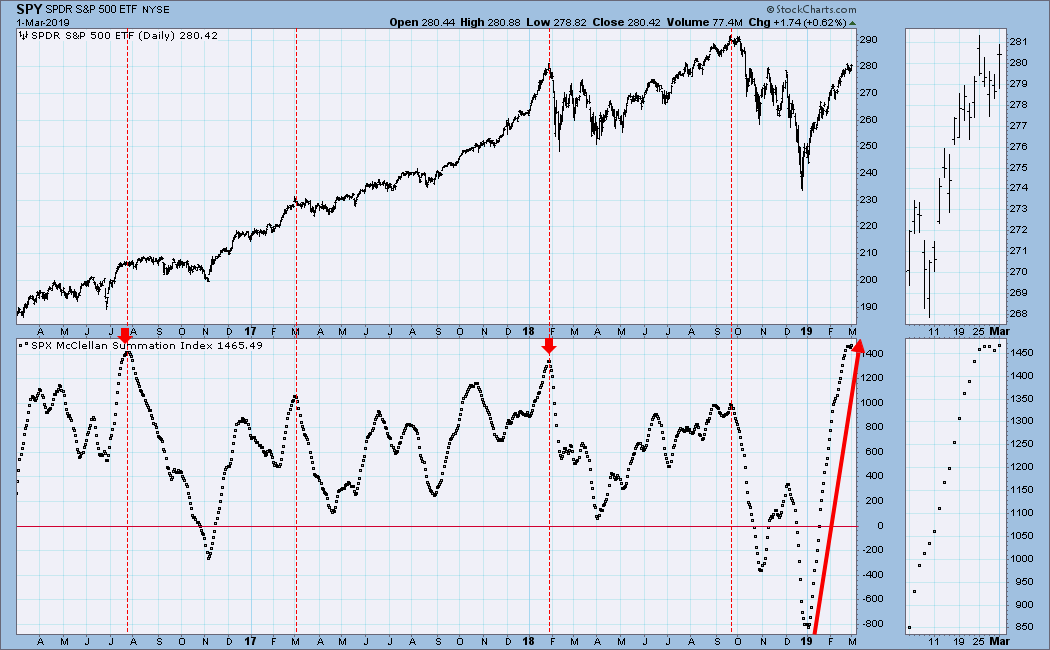
DP WEEKLY/MONTHLY WRAP: Internals Overbought and Topping

by Carl Swenlin,
President and Founder, DecisionPoint.com
The McClellan Summation Index (ratio-adjusted version) has had the longest uninterrupted upside run since 2003, when the market was coming up off of the 2000-2002 bear market lows. The indicator is very overbought and it is trying to top, so we should expect some kind of corrective action over the...
READ MORE
MEMBERS ONLY

Learning From Legends: Gerald Loeb's Timeless Investing Wisdom Stands The Test Of Time

by Gatis Roze,
Author, "Tensile Trading"
I’m sure you’ve heard the expression, “the more things change, the more they stay the same.” Gerald Loeb used this phrase frequently. I’ve always had great respect for Mr. Loeb. True, he was an extraordinary investor and a best-selling author. But what I most respected him for...
READ MORE
MEMBERS ONLY
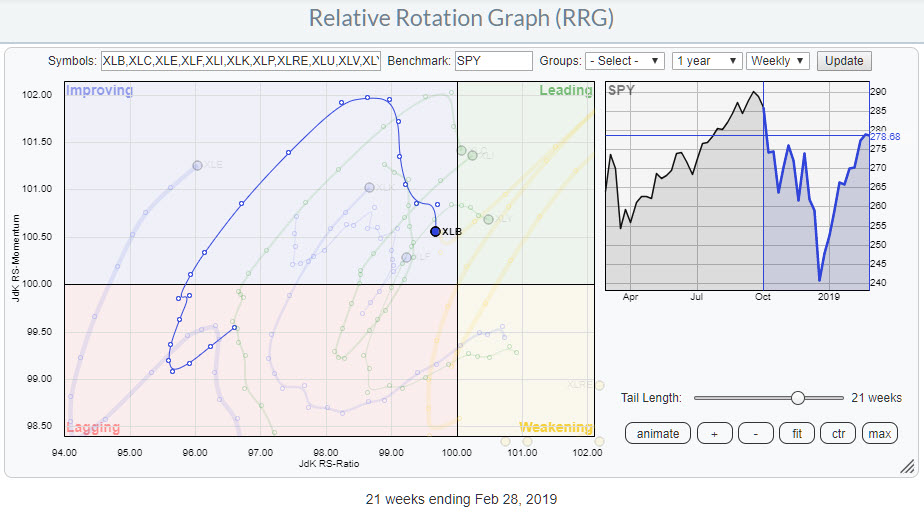
Materials Sector Rolling over On Both The Weekly And The Daily RRG
by Julius de Kempenaer,
Senior Technical Analyst, StockCharts.com
The chart above shows the weekly rotation for the Materials sector, XLB, within the universe of US sectors against SPY. After the tail turned upward inside the lagging quadrant, XLB kept up with the performance of SPY and moderately outperformed the market until the sector started to lose relative momentum...
READ MORE
MEMBERS ONLY

MAJOR STOCK INDEXES CONTINUE TO TEST OVERHEAD RESISTANCE NEAR THEIR NOVEMBER HIGHS -- AND CONTINUE TO LOOK OVER-EXTENDED -- THE S&P 600 SMALL CAP INDEX AND THE DOW TRANSPORTS ARE MEETING SOME SELLING AT THEIR 200-DAY LINES
by John Murphy,
Chief Technical Analyst, StockCharts.com
NOVEMBER HIGH IS BEING TESTED ... After having one of the strongest starts to a new year in history, major stock indexes find themselves testing yet another potential overhead resistance barrier. And they're doing so while in an over-extended technical condition. But they've been looking over-extended for...
READ MORE
MEMBERS ONLY

Weekly Market Review & Outlook - Resistance versus Uptrend
by Arthur Hill,
Chief Technical Strategist, TrendInvestorPro.com
* Resistance in an Uptrend?
* Bulk of the Evidence Bullish.
* Utilities, REITs and Industrials Lead in Price.
* Finance Holds Flag Breakout.
* When Bad News is Good (SQ).
* Volume Picks up in Fox Factory.
* A Classic Breakout and Throwback (SCWX).
* ChartList Updates.
... Resistance in an Uptrend?
... The S&P 500 advanced...
READ MORE
MEMBERS ONLY
Railroads Strength Pointing To Bright Economic Conditions
by Tom Bowley,
Chief Market Strategist, EarningsBeats.com
Market Recap for Thursday, February 28, 2019
Our major indices were lower across the board on Thursday, but losses were minimal. The Dow Jones, S&P 500, NASDAQ and Russell 2000 dropped 0.27%, 0.28%, 0.29%, and 0.35%, respectively. That's not much damage considering...
READ MORE
MEMBERS ONLY
Medical Equipment Stocks Very Healthy, Watch For Breakout
by Tom Bowley,
Chief Market Strategist, EarningsBeats.com
Market Recap for Wednesday, February 27, 2019
We're seeing how the stock market deals with a bit of adversity with a Volatility Index ($VIX) at 15 vs. when it was in the 20s and 30s. Every time it appears we're going to have a nasty day,...
READ MORE
MEMBERS ONLY
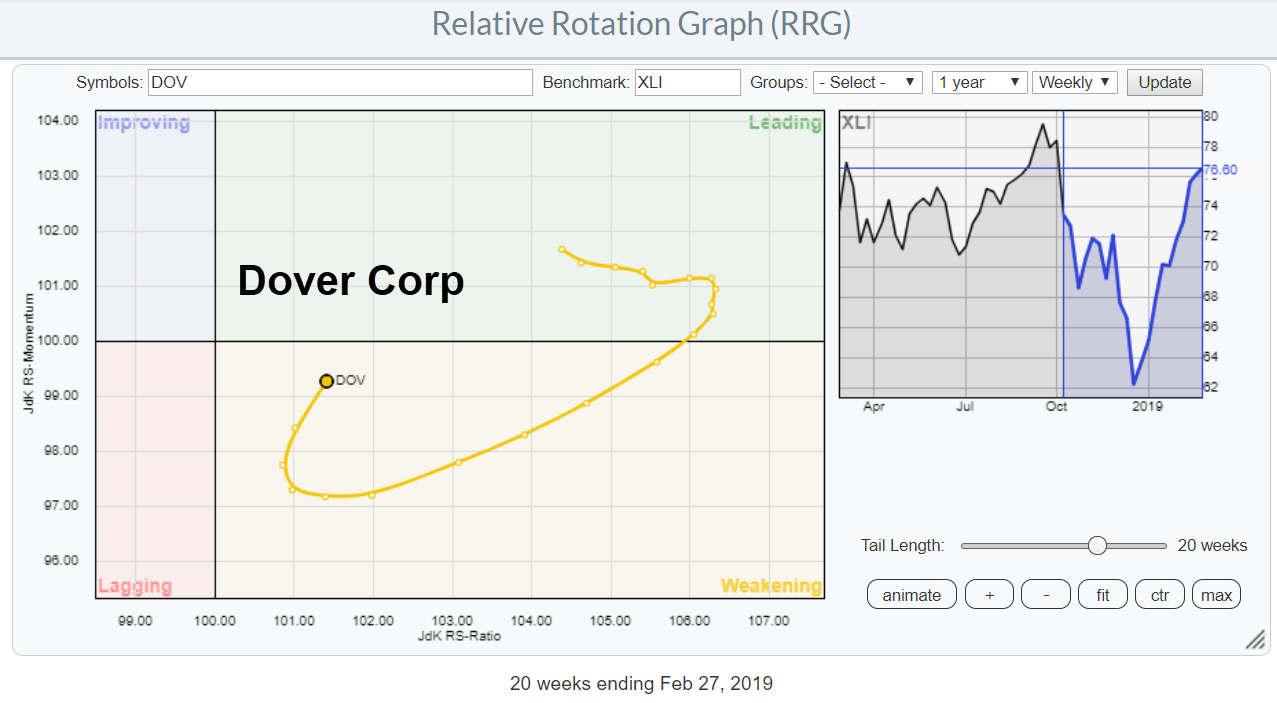
Is This Stock Breaking Out Or Building A Major Top-Formation?
by Julius de Kempenaer,
Senior Technical Analyst, StockCharts.com
On the weekly Relative Rotation Graph for US sectors, XLI, the Industrials sector is crossing over into the leading quadrant from improving. This indicates further improvement for Industrial stocks compared to other segments of the market.
While zooming in on the RRG for Industrial stocks against XLI I noted the...
READ MORE
MEMBERS ONLY

DP Alert: SPY & XLI Trigger LT Trend Model BUY - Dollar (UUP) PMO SELL Signal
by Erin Swenlin,
Vice President, DecisionPoint.com
In mid-week DP Alerts, I generally only review the SPX, as it is a Scoreboard index. However, DecisionPoint signals are reported to Timer Digest based on the SPY. Yesterday, the SPY generated a Long-Term Trend Model (LTTM) BUY signal. The SPX still has some ground to cover before it can...
READ MORE
MEMBERS ONLY

BOND PRICES ARE UP AGAINST CHART RESISTANCE -- AND MAY BE SUBJECT TO PROFIT-TAKING -- RISING OIL PRICE MIGHT ALSO WEAKEN BOND PRICES -- SO COULD A STRONGER COPPER MARKET -- TODAY'S YIELD BOUNCE MIGHT BE CAUSING SOME PROFIT-TAKING IN GOLD
by John Murphy,
Chief Technical Analyst, StockCharts.com
TREASURY BOND ETFS ARE UP AGAINST CHART RESISTANCE... Last Thursday's message suggested that an overbought Treasury bond market was looking vulnerable to some profit-taking. That's still the case. The weekly bars in Chart 1 show the 7-10 Year Treasury Bond IShares (IEF) just below potential overhead...
READ MORE
MEMBERS ONLY

Join Me At The Traders EXPO in New York
by Julius de Kempenaer,
Senior Technical Analyst, StockCharts.com
Here's some shameless self-promotion!
On Monday 11 March I will be doing an RRG presentation at the TradersEXPO in New York and you are invited. For FREE ;)
Julius presenting RRG at TradersEXPO New York
I have never attended one of the TradersEXPO events let alone presented at them...
READ MORE
MEMBERS ONLY
Travel & Tourism Stocks Seeking A Boost From Booking Holdings
by Tom Bowley,
Chief Market Strategist, EarningsBeats.com
Market Recap for Tuesday, February 26, 2019
In what has become a rarity in 2019, all of our major indices finished in negative territory on Tuesday, but it wasn't without a fight. There was early selling, but stocks rallied throughout much of the session to forge to intraday...
READ MORE
MEMBERS ONLY

Watching the Triple A Stocks for Clues on QQQ
by Arthur Hill,
Chief Technical Strategist, TrendInvestorPro.com
Apple, Amazon and Alphabet account for around 9 percent of the S&P 500 SPDR and around 27 percent of the Nasdaq 100 ETF. Thus, the next directional move in these three will clearly impact the broader market. As the charts now stand, Apple, Amazon and Alphabet are lagging...
READ MORE
MEMBERS ONLY
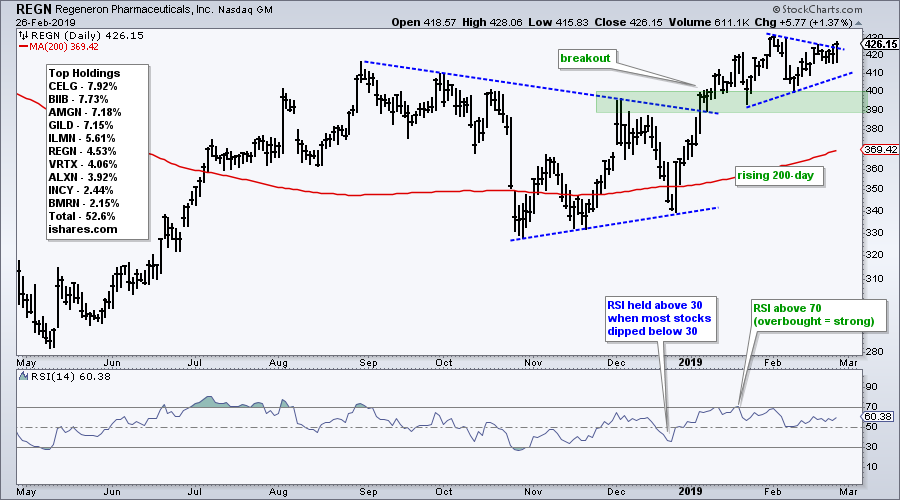
A Rejuvenated Regeneron Leads Biotech Group
by Arthur Hill,
Chief Technical Strategist, TrendInvestorPro.com
It is a mixed bag for the big biotech stocks this year. Of the top ten stocks in IBB, five are underperforming SPY and five are outperforming. Regeneron is slightly outperforming SPY this year and sports a bullish pattern on the price chart.
First and foremost, the bigger trend is...
READ MORE
MEMBERS ONLY

Monday's Sharp Rally In Shanghai Triggers Some Very Important Long-Term Signals

by Martin Pring,
President, Pring Research
* Shanghai Composite Secular Uptrend Line is Still Intact
* If China Rallies, Will It Take Commodities Along for the Ride?
* China vs. Hong Kong
* Chinese ETFs Experiencing a Reversal
Shanghai Composite Secular Uptrend Line is Still Intact
Chart 1 features a really important benchmark for the Shanghai Composite - a secular...
READ MORE
MEMBERS ONLY
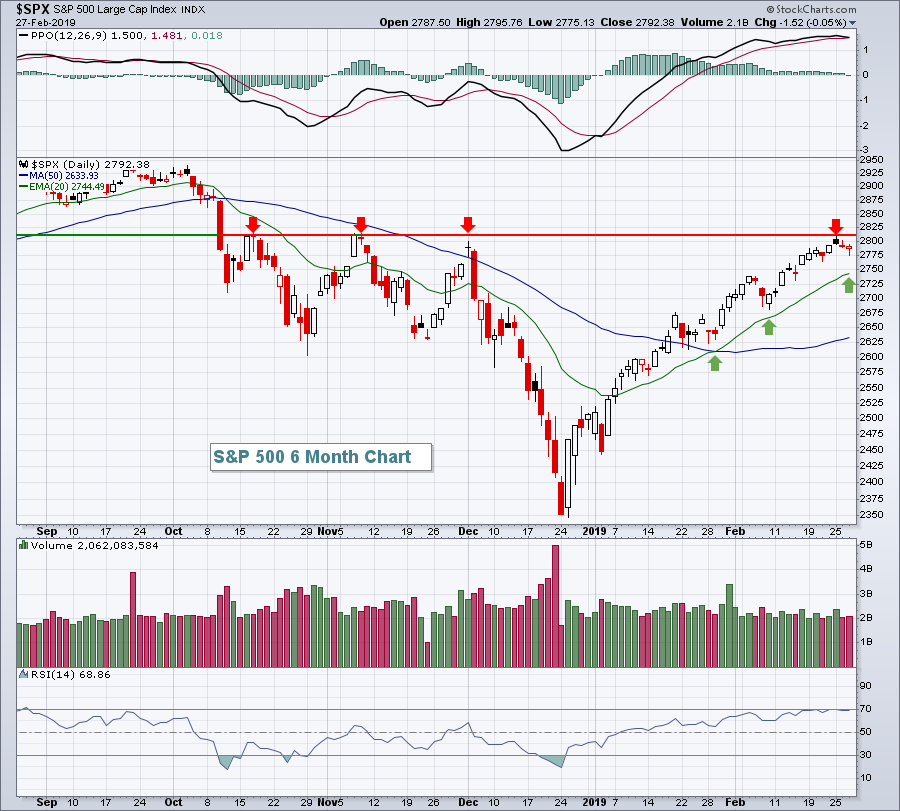
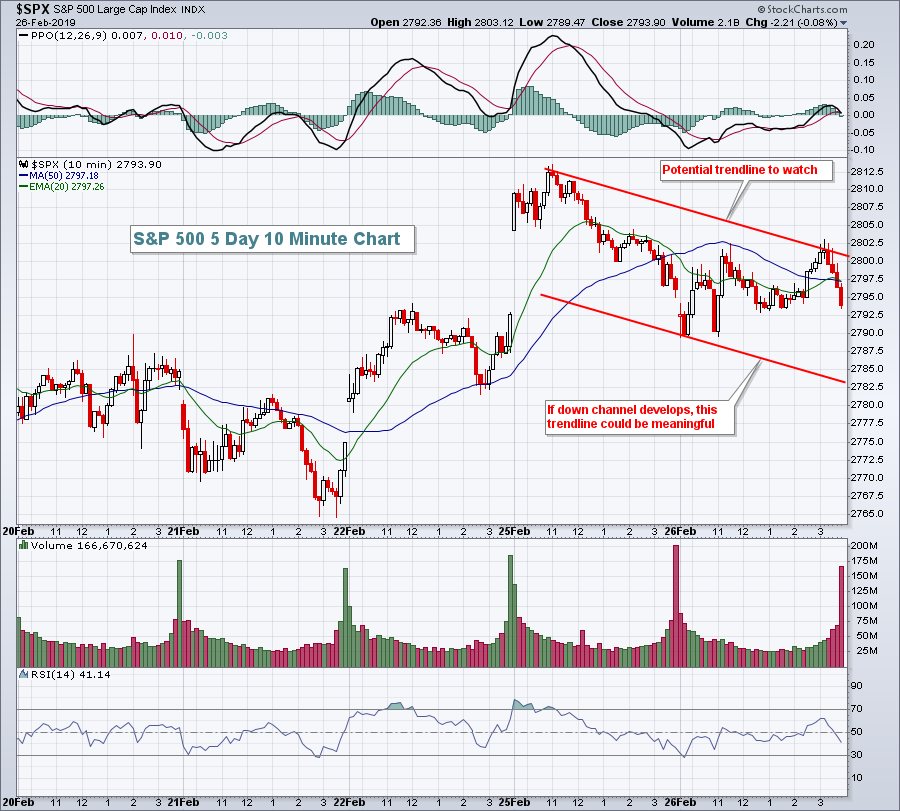
Monday's Reversal Sets U.S. Equities Up For Selling
by Tom Bowley,
Chief Market Strategist, EarningsBeats.com
Market Recap for Monday, February 25, 2019
If you looked at the final numbers yesterday, you'd probably think it was just another day in this two-month long advance, but it wasn't just another day. It was a reversal off a gap higher with the market initially...
READ MORE
MEMBERS ONLY

Third Time Lucky for Resistance?
by Arthur Hill,
Chief Technical Strategist, TrendInvestorPro.com
Another Obvious Resistance Level
If the S&P 500 declines from current levels, we will be able to look back at this level and see it as an "obvious" resistance level. Ain't hindsight great! Keep in mind, however, that this is the third "obvious&...
READ MORE
MEMBERS ONLY
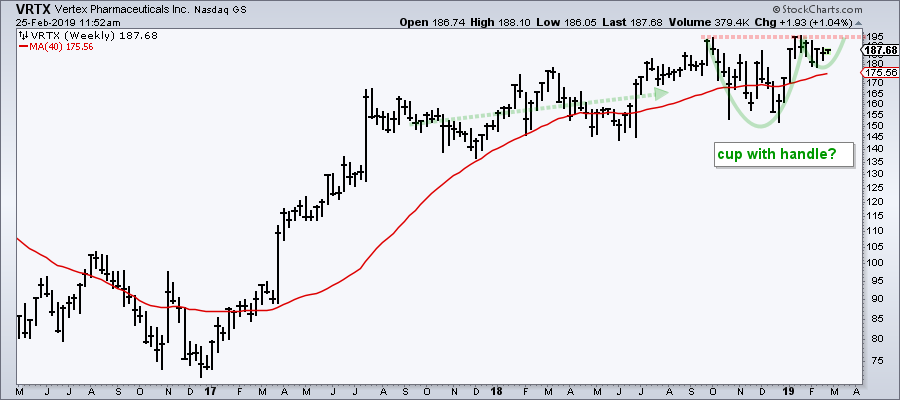
Vertex Forges Bullish Setups on Two Timeframes
by Arthur Hill,
Chief Technical Strategist, TrendInvestorPro.com
The daily chart for Vertex (VRTX) is quite a mess with several dips under the 200-day SMA over the last ten months, but a short-term bullish pattern is shaping up and the weekly chart also sports a bullish setup.
Let's look at the weekly chart first because the...
READ MORE
MEMBERS ONLY

CISCO, INTEL, AND MICROSOFT LEAD DOW HIGHER -- TECHNOLOGY SECTOR SHOWS NEW LEADERSHIP -- FINANCIAL SPDR IS TRADING OVER ITS 200-DAY AVERAGE -- CHINA LEADS EMERGING MARKET STOCKS HIGHER -- CHINESE STOCKS ARE NOW DOING BETTER THAN THE U.S.
by John Murphy,
Chief Technical Analyst, StockCharts.com
CISCO, INTEL, AND MICROSOFT ARE DOW LEADERS ... A glance at today's most actives list for the Dow shows three stocks attracting a lot of the buying. Chart 1 shows Cisco (CSCO) surging to an all-time high. Its rising relative strength line (upper box) shows it leading the Dow...
READ MORE
MEMBERS ONLY
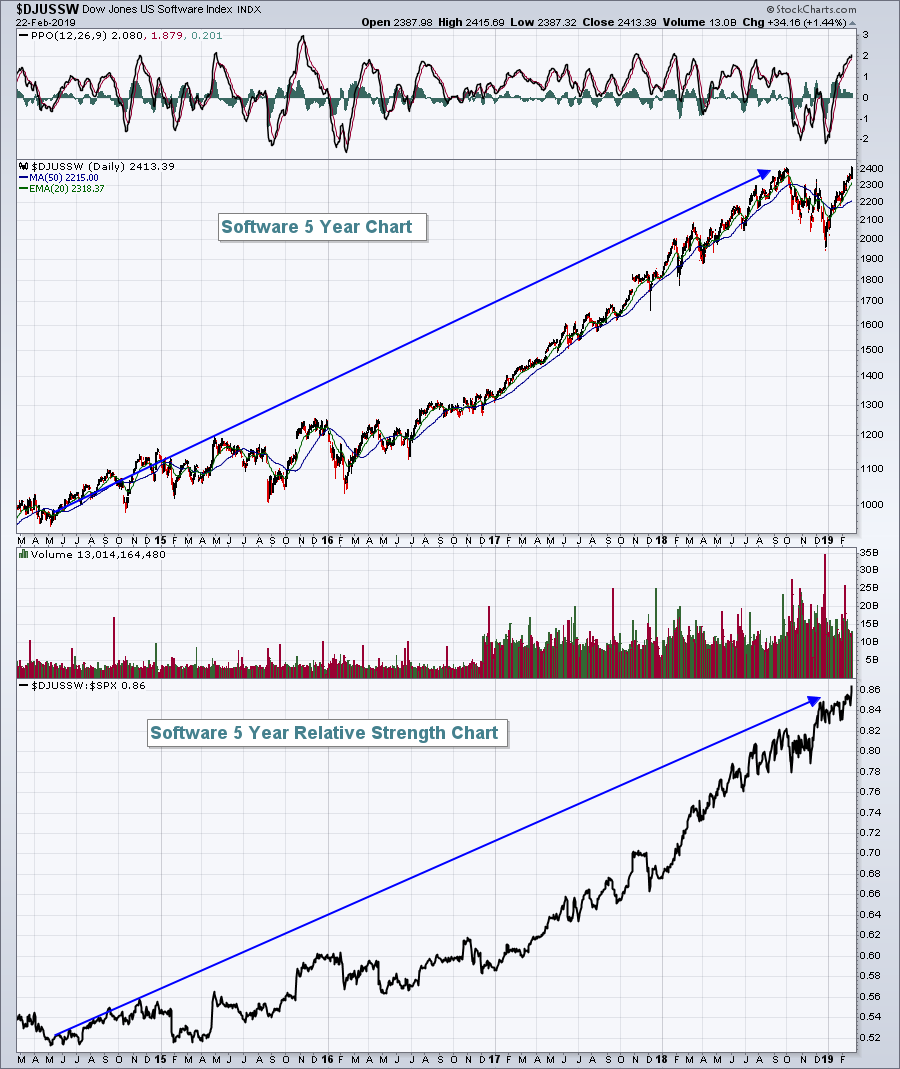
Software And Telecom Lead Technology March Higher
by Tom Bowley,
Chief Market Strategist, EarningsBeats.com
Market Recap for Friday, February 22, 2019
Software stocks ($DJUSSW, +1.44%) continued their impressive dash higher, eclipsing their October high to enter all-time high territory. It was a significant breakout as the DJUSSW has been a relative leader for a long, long time. Check this out:
Perhaps the most...
READ MORE
MEMBERS ONLY
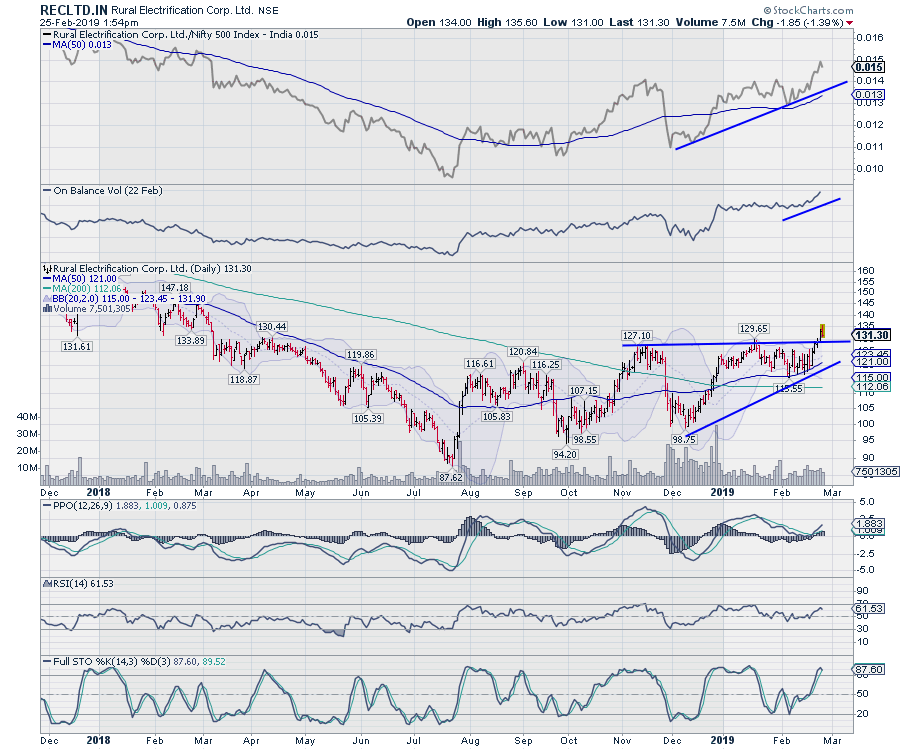
RECLTD: Breakout From An Ascending Triangle
by Milan Vaishnav,
Founder and Technical Analyst, EquityResearch.asia and ChartWizard.ae
Rural Electrification Corporation Limited (RECLTD.IN)
* This stock has now witnessed a breakout from a bullish Ascending Triangle formation.
* The breakout occurred above 127.50, but the stock might still witness some pullback, with the zone of 127-130 potentially acting as support. Once the consolidation is out of way, there...
READ MORE
MEMBERS ONLY

Material Development
by Bruce Fraser,
Industry-leading "Wyckoffian"
The U.S. Mining Index is composed of industries that manufacture a broad spectrum of materials used in manufacturing and infrastructure projects. Typically, the Mining Index comes into a performance leadership position as the economy heats up. Therefore, in the middle to late stage of a business cycle expansion this...
READ MORE
MEMBERS ONLY

Just how Effective is the 200-day Moving Average?
by Arthur Hill,
Chief Technical Strategist, TrendInvestorPro.com
The 200-day moving average is perhaps the most widely used moving average and the S&P 500 is the most widely followed benchmark for the U.S. stock market. Taken together, the S&P 500 and the 200-day SMA can be used to identify major trends in the...
READ MORE
MEMBERS ONLY
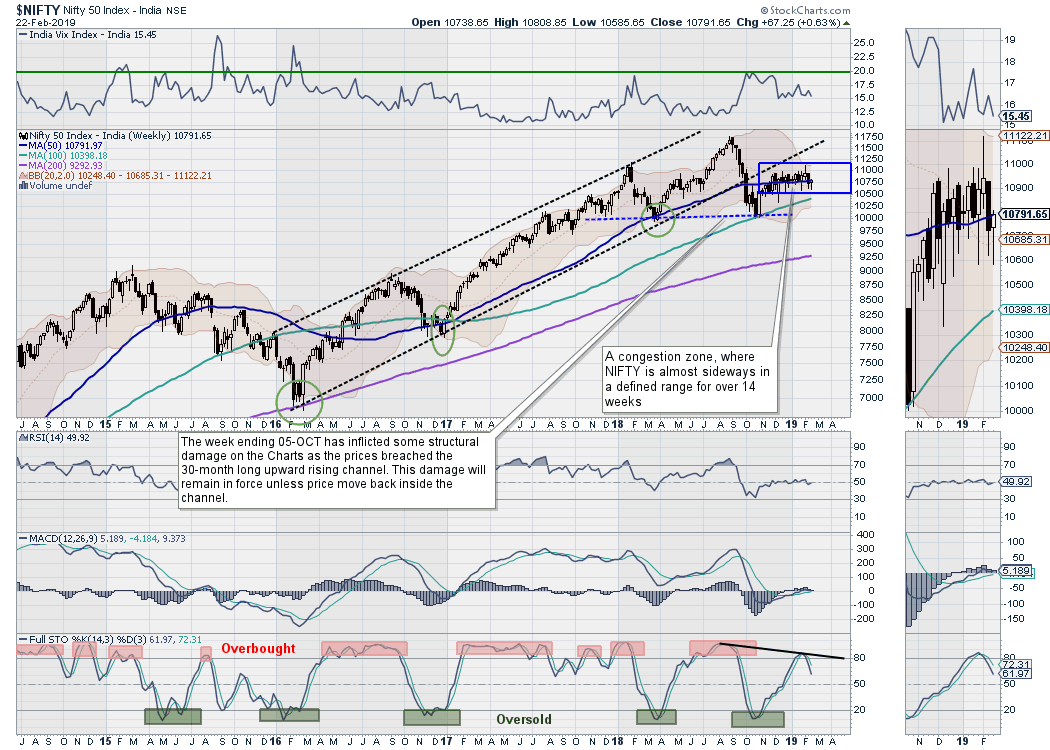
Week Ahead: NIFTY Hovers Around Important Levels; RRG Show These Sectors Likely Out-Performing The Broader Markets
by Milan Vaishnav,
Founder and Technical Analyst, EquityResearch.asia and ChartWizard.ae
In our previous weekly note, we mentioned that the NIFTY was slipping below its 50-week moving average and highlighted the importance of this important weekly level. While the markets experienced continued weakness in the early part of the past week, the middle of the week saw the NIFTY rebounding following...
READ MORE
MEMBERS ONLY
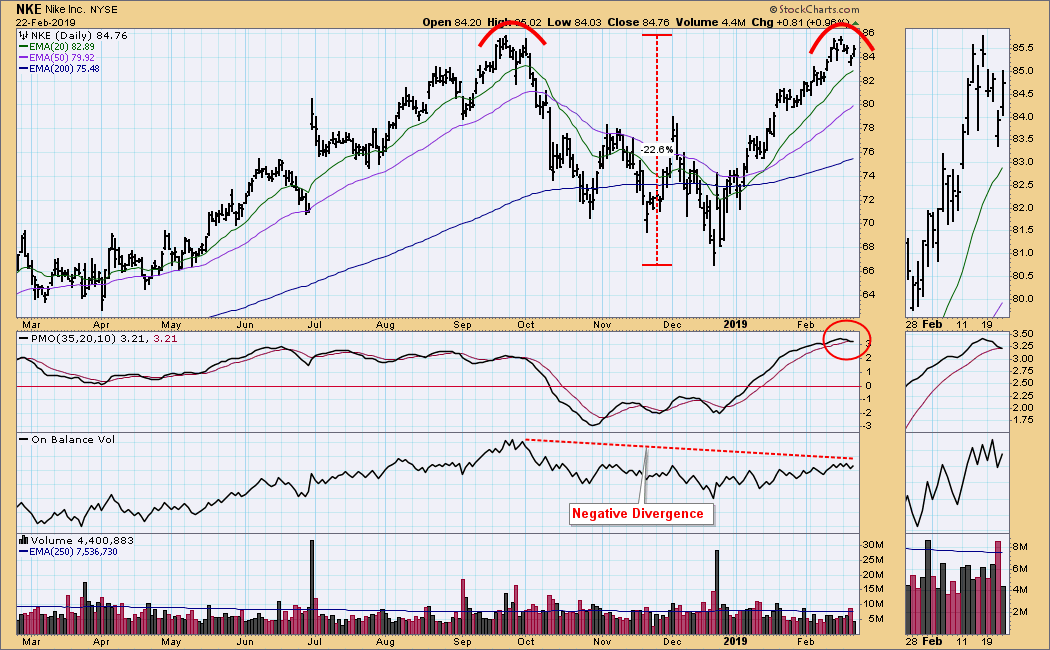
DP WEEKLY WRAP: Looking At NKE Technicals
by Carl Swenlin,
President and Founder, DecisionPoint.com
In a basketball game on Wednesday a Nike shoe literally peeled off the foot of 285-pound, 6-foot-7-inch Zion Williamson. The resulting knee injury was regrettable, but the reporting of the incident was rather amusing. For one thing, the video of the incident ran over, and over, and over. I considered...
READ MORE
MEMBERS ONLY

Weekly Market Review & Outlook - Utes Lead as Finance Improves
by Arthur Hill,
Chief Technical Strategist, TrendInvestorPro.com
* Mid-caps and Small-caps Join Large-caps.
* Breadth Tables Improve.
* XLU Shows Strongest Breadth.
* Changing My Mindset.
* Home Construction iShares Clears 200-day.
* Three Flags at Different Breakout Stages.
* Pfizer Gets Second Breakout.
* Berry Plastics Completes Big Reversal.
* Expedia Breaks Channel.
* ChartList Notes and Deletions.
... Mid-caps and Small-caps Join Large-caps
... The Mid-Cap %Above...
READ MORE