MEMBERS ONLY

The S&P's Sudden Loss of Altitude

by David Keller,
President and Chief Strategist, Sierra Alpha Research
I was panicked.
On my previous training flight, I had put the Cessna 172 into a nose dive. That’s right, in my attempt to demonstrate a power-off stall, I had literally pointed the airplane directly at the ground. Which is not a good idea if you want to remain...
READ MORE
MEMBERS ONLY

FRIDAY'S REBOUND PREVENTS FURTHER STOCK DAMAGE -- BUT WEEKLY AND MONTHLY CHARTS ARE SENDING MORE SERIOUS WARNING SIGNS -- ELLIOTT WAVE ANALYSIS ALSO SUGGESTS THAT THE MARKET MAY HAVE COMPLETED ITS NINE-YEAR RUN -- BULL MARKETS MAY NOT DIE OF OLD AGE

by John Murphy,
Chief Technical Analyst, StockCharts.com
S&P 500 HOLDS 200-DAY AVERAGE ... A stock rebound on Friday prevented a more serious market breakdown. That's because it allowed the S&P 500, and some other market gauges, to hold at or above their 200-day moving averages (Chart 1). That included the Dow and...
READ MORE
MEMBERS ONLY
DP Weekly Wrap: Picking Bottoms

by Carl Swenlin,
President and Founder, DecisionPoint.com
"The road to trading glory is littered with the bodies of those who tried to pick bottoms."
-- Carl Swenlin (once upon a bad day)
To use an expression made popular by the late Kennedy Gammage, bottom picking is for "swingin' riverboat gamblers." To be...
READ MORE
MEMBERS ONLY

Weekly Market Review & Outlook (with video) - The Straw that Broke the Bull's Back

by Arthur Hill,
Chief Technical Strategist, TrendInvestorPro.com
* Performance Overview.
* Fattening Up and Surviving Drawdowns.
* Breadth Indicators Turn Bearish.
* Measuring and Comparing Downside Momentum.
* S&P 500 hits Oversold Extreme.
* The New Normal for QQQ?
* Pullbacks within Uptrends: XLV, XLK, XLY, XLU.
* Charts Going Nowhere: XLE, XLI.
* Chart Break Downs: XLC, XLP, XLRE, XLF, XLB.
* Notes from...
READ MORE
MEMBERS ONLY
Bears Retain Grip on Wall Street as Fears Grow

by Tom Bowley,
Chief Market Strategist, EarningsBeats.com
Special Note
I will be speaking to the Charlotte Chapter of the American Association of Individual Investors (AAII) tomorrow Saturday, October 13th at 10:00am EST. I plan to discuss how to evaluate the sustainability of a bull market, relative strength and gap trading strategies. The first meeting is FREE...
READ MORE
MEMBERS ONLY
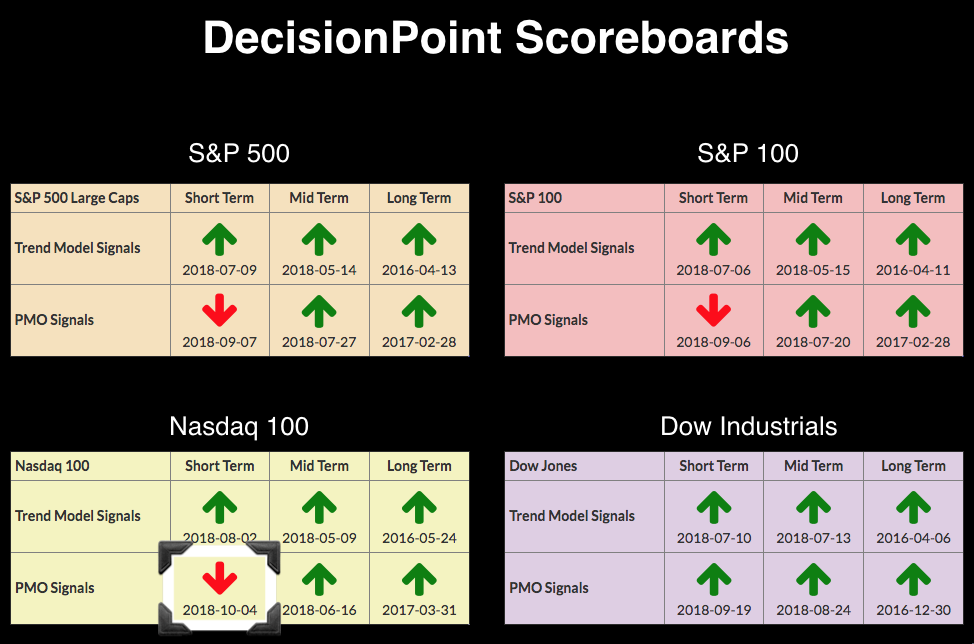
NDX IT Trend Model Neutral Signal - Climactic Breadth Readings Continue

by Erin Swenlin,
Vice President, DecisionPoint.com
The Intermediate-Term Trend Model Neutral signal generated today on the Nasdaq 100 (NDX) replaced a May 9, 2018 BUY signal. It was another exhausting day as we watched the correction continue with prices free falling lower. Yesterday I pointed out the climactic breadth and VIX readings and suggesting a selling...
READ MORE
MEMBERS ONLY

GROWTH AND VALUE STOCKS ARE BOTH WEAKENING -- CONSUMER DISCRETIONARY AND TECH SPDRS HAVE FALLEN TO THEIR 200-DAY AVERAGES TO LEAD MARKET LOWER -- FINANCIALS HAVE ALSO LOST GROUND -- BANK INDEX FALLS TO NEW 2018 LOW
by John Murphy,
Chief Technical Analyst, StockCharts.com
GROWTH AND VALUE STOCKS ARE BOTH FALLING... One of the explanations for this week's big selloff is that the upside breakout in bond yields is hurting growth stocks. That's been especially true of consumer discretionary and technology stocks which suffered the biggest losses this month. Chart...
READ MORE
MEMBERS ONLY

Global And US Equities Violate Major Up Trendlines: More Downside To Come

by Martin Pring,
President, Pring Research
* The big global picture
* US equities are violating key trend lines
* Financials experience false upside breakout
* Energy triggers a false positive
* Bubble-prone e-commerce on the verge of being pricked!
Last week, I wrote about the possibility of an October “surprise.” I pointed out that such an event is completely random...
READ MORE
MEMBERS ONLY
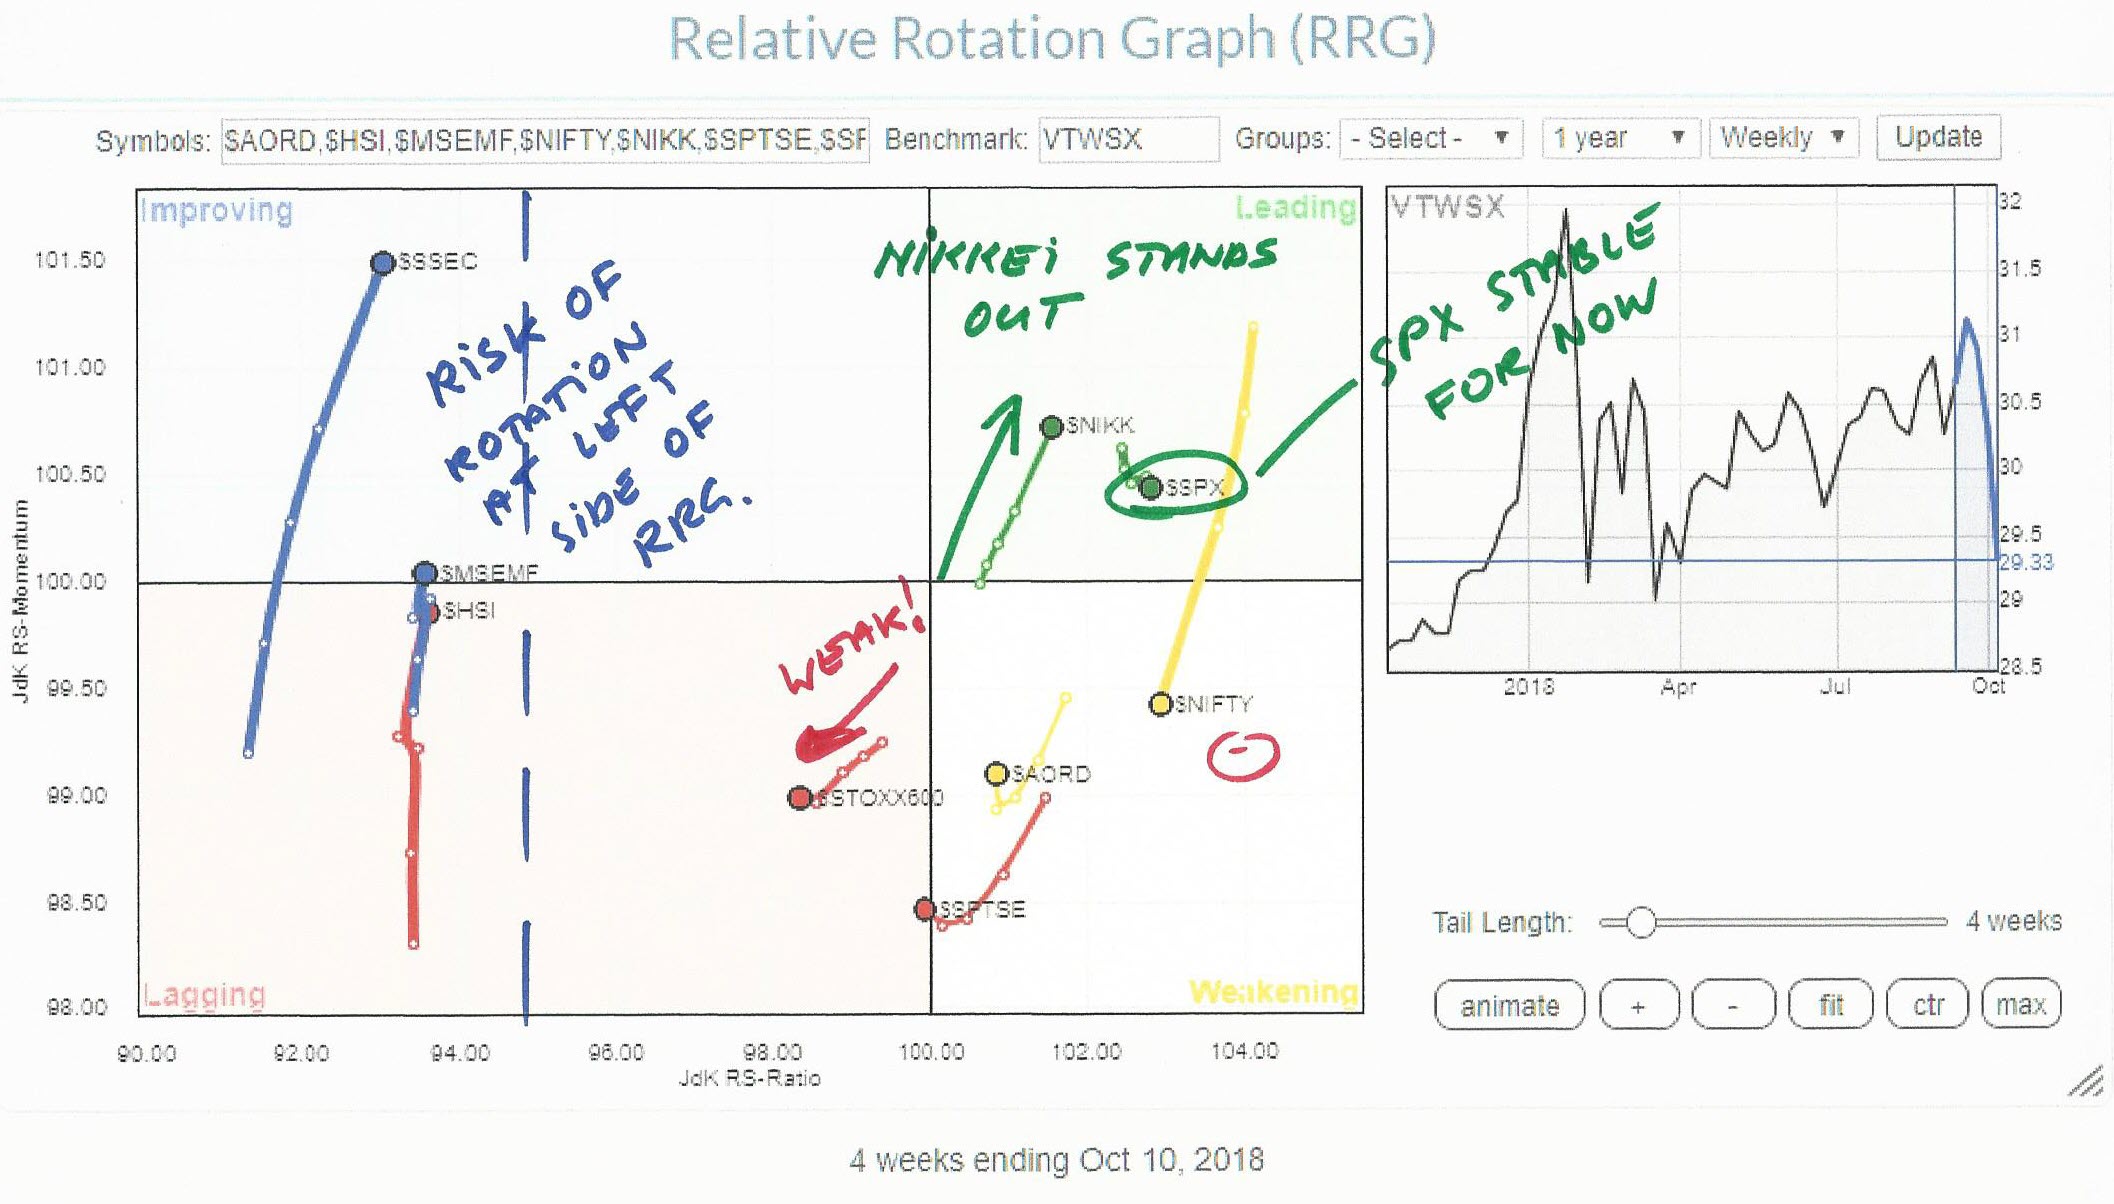
Japan against the rest of the world!

by Julius de Kempenaer,
Senior Technical Analyst, StockCharts.com
When markets around the world start to rumble it's usually a good exercise how all these moves compare against one another.
The Relative Rotation Graph shows the relative picture for a number of major world equity markets against the Dow Jones World Index as the benchmark.
The Indian...
READ MORE
MEMBERS ONLY
VIX Surges 43% To Lead Major Selloff
by Tom Bowley,
Chief Market Strategist, EarningsBeats.com
Special Note
I will be speaking to the Charlotte Chapter of the American Association of Individual Investors (AAII) this Saturday, October 13th at 10:00am EST. I plan to discuss how to evaluate the sustainability of a bull market, relative strength and gap trading strategies. The first meeting is FREE...
READ MORE
MEMBERS ONLY
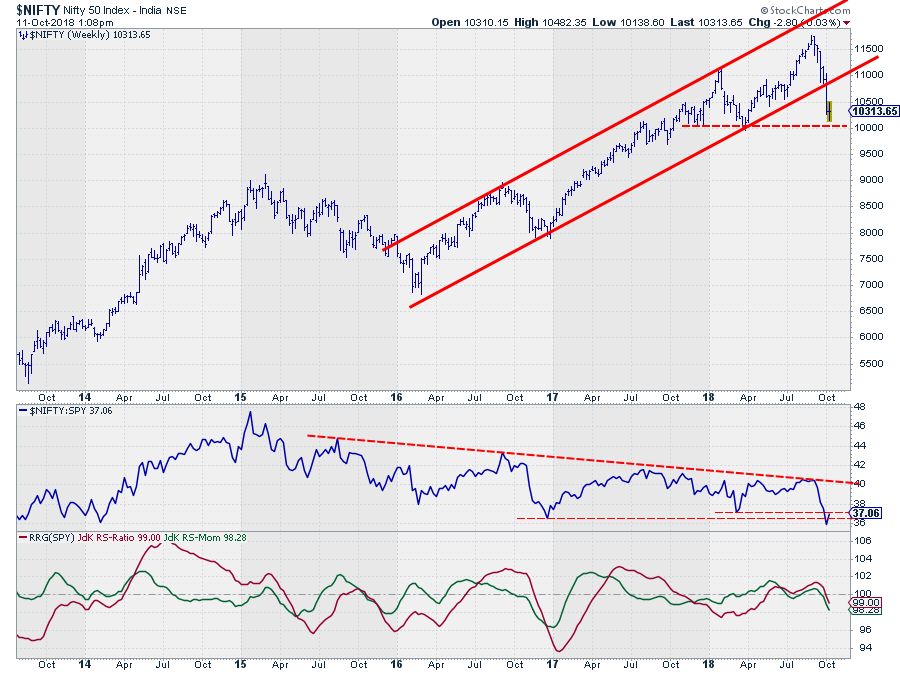
Break in $NIFTY re-shuffles sector rotation in India
by Julius de Kempenaer,
Senior Technical Analyst, StockCharts.com
This article is an extended and updated version of the article that appeared in last weekend's Chartwatchers newsletter.
The Indian $NIFTY Index dropped out of an almost three-year uptrend at the close of last week. The rising support line that started at the low in early 2016 did...
READ MORE
MEMBERS ONLY

Downside Participation Increases - Scanning for Odd Balls
by Arthur Hill,
Chief Technical Strategist, TrendInvestorPro.com
* Broadest Decline Since April.
* 16 Stocks Bucked the Selling Pressure.
* Scan Code for Advancing Issues.
* The Russell 2000 and Moving Averages.
* A Shift from Growth to Value?
... A Lopsided Move
... Chartists can measure participation using the AD Percent indicators. AD Percent equals the number of advances less the number of...
READ MORE
MEMBERS ONLY

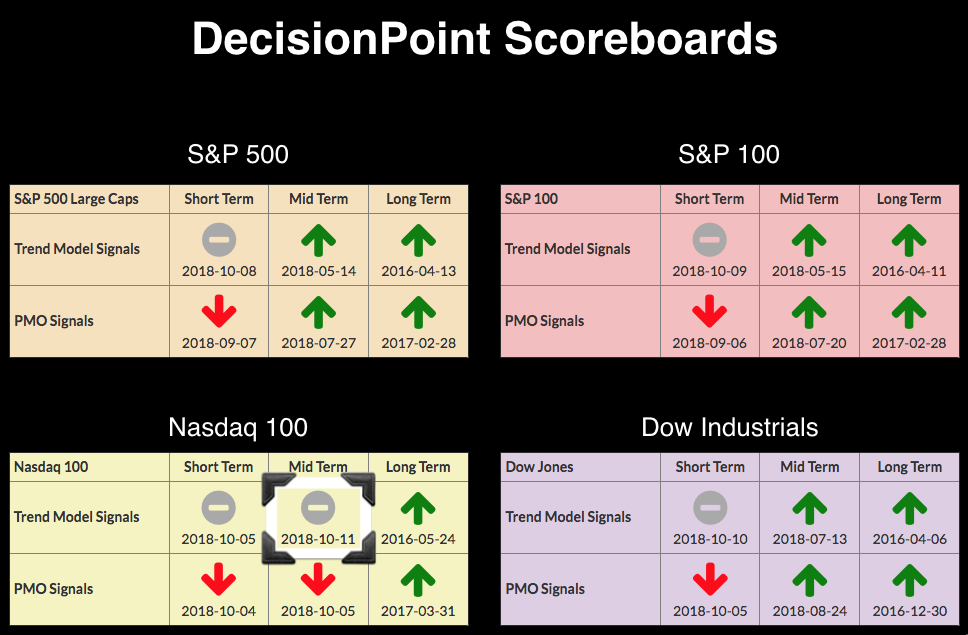
DP Alert: Climactic Breadth Readings Could Signal Selling Exhaustion - ST Neutral on Dow
by Erin Swenlin,
Vice President, DecisionPoint.com
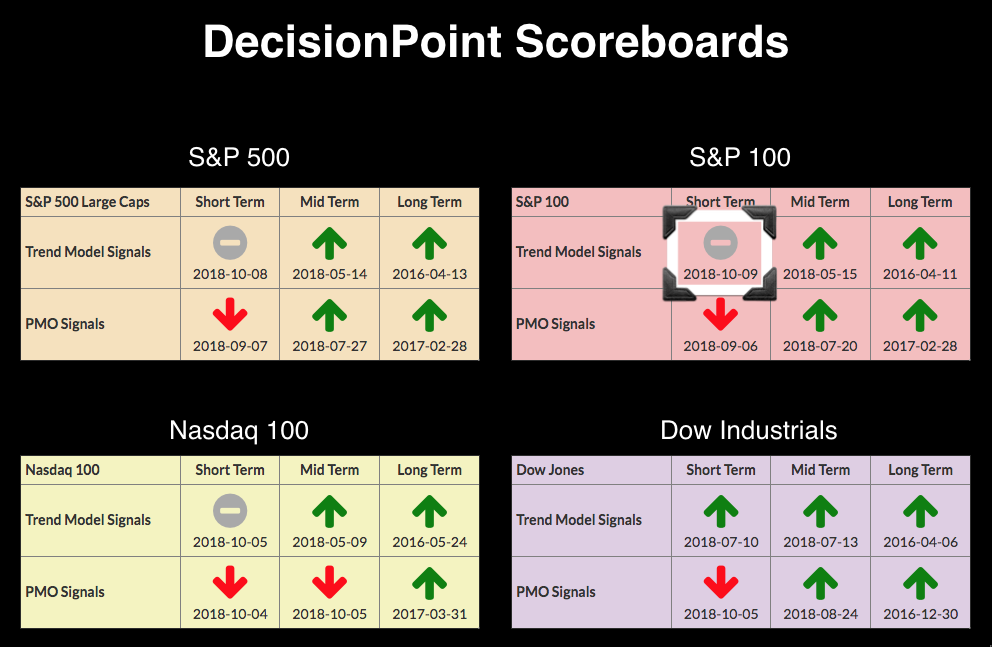
We had another change to the DecisionPoint Scoreboards today. The Short-Term Trend Model initiated a Neutral signal on the Dow (chart is below Scoreboards) when the 5-EMA crossed below the 20-EMA while above the 50-EMA. Weakness and fear abound, but there could be some relief on the way given the...
READ MORE
MEMBERS ONLY
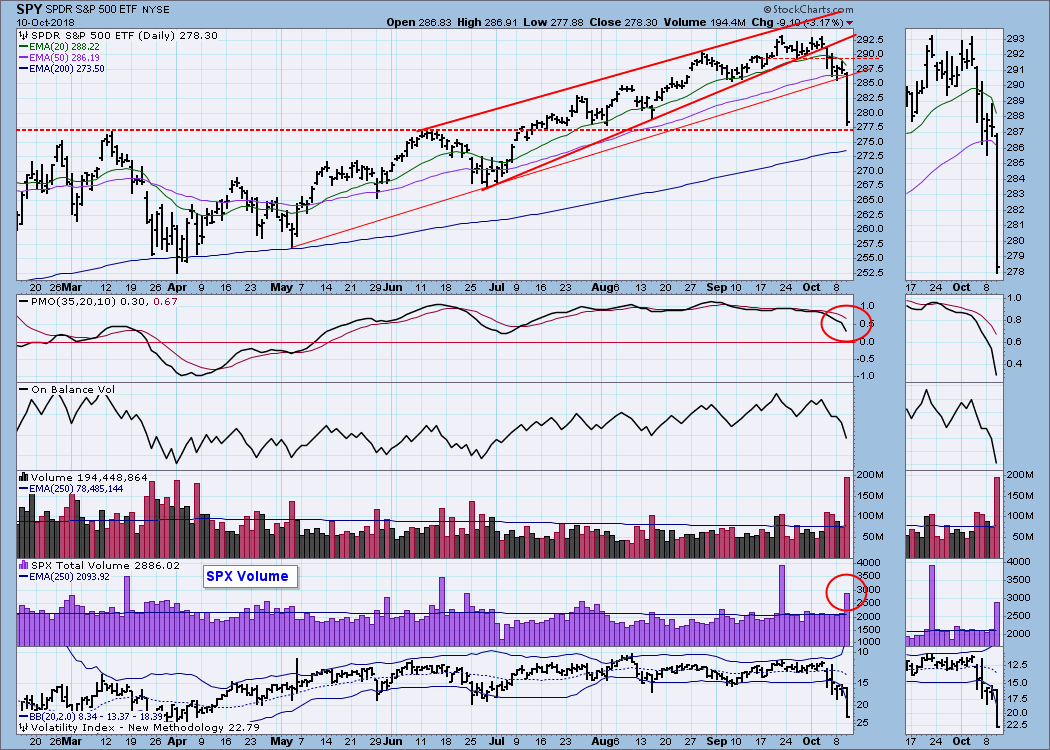
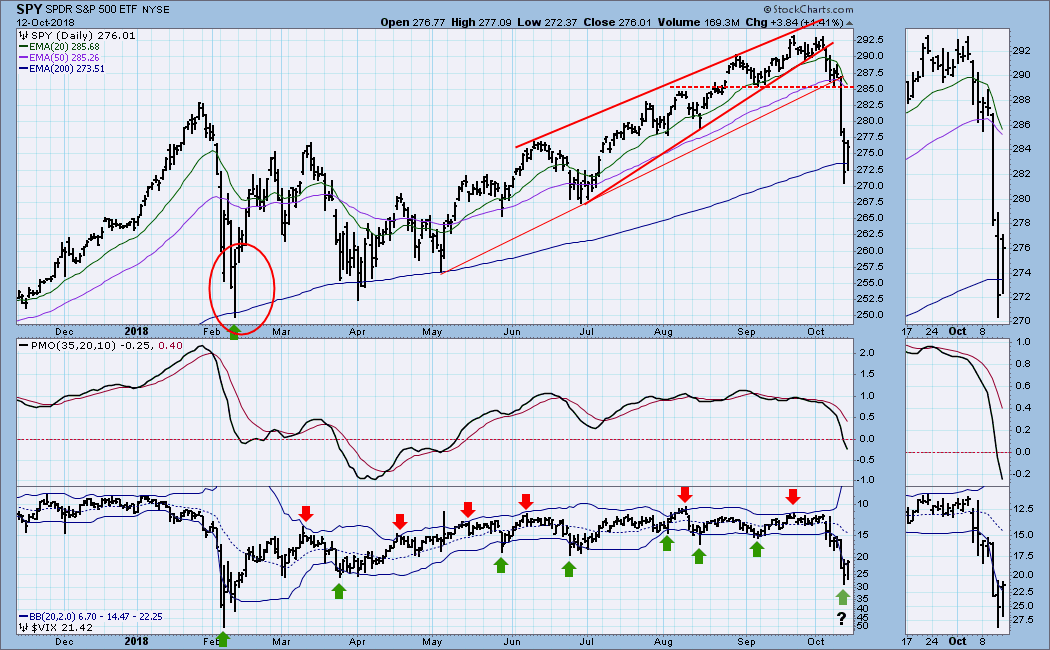
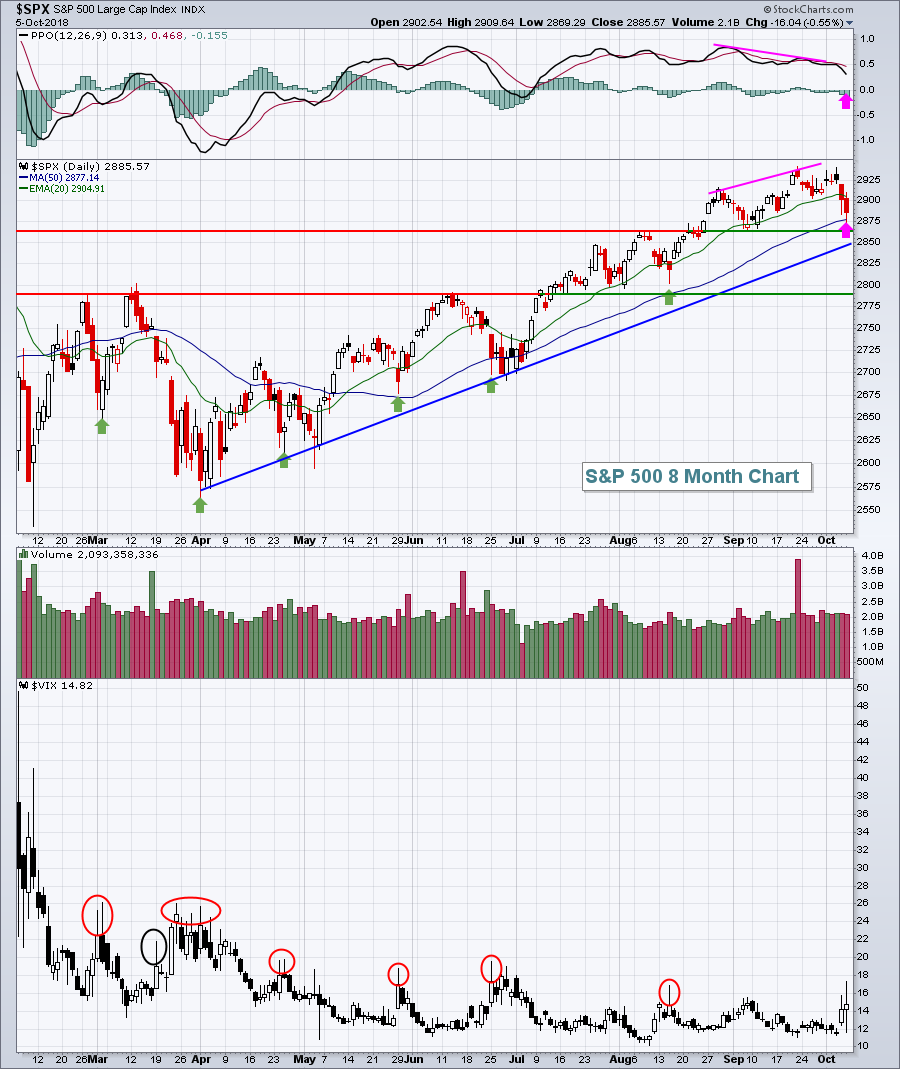
Where Is Support?
by Carl Swenlin,
President and Founder, DecisionPoint.com
After a day like this, the first question I ask is where is support? That question is not fully answered on this daily chart, but there is something worth noting here. Volume for SPY was huge -- 248% of the 250-day average -- but SPY is a trading instrument and...
READ MORE
MEMBERS ONLY

Technical Analysts!

by Greg Morris,
Veteran Technical Analyst, Investor, and Author
After 45+ years as a technical analyst I have found that this breed of folks comes in many sizes and flavors. I can write about each of them simply because I have at one time or another been there, done that, and still doing it. In doing this I’ll...
READ MORE
MEMBERS ONLY

NASDAQ CONTINUES TO LEAD MARKET LOWER -- ALONG WITH WEAK TECHNOLOGY STOCKS -- SEMICONDUCTOR ISHARES FALL TO LOWEST LEVEL IN SIX MONTHS -- SMALL AND MIDCAP INDEXES SLIP BELOW 200-DAY AVERAGES -- S&P 500 FALLS BELOW 50-DAY AVERAGE
by John Murphy,
Chief Technical Analyst, StockCharts.com
THE NASDAQ 100 (QQQ) LEADS MARKET LOWER... Stock indexes are all under selling pressure again this morning. As has been the case of late, the technology-dominated Nasdaq market has been leading the rest of the market lower. Chart 1 shows the Invesco Nasdaq 100 QQQ Trust falling to the lowest...
READ MORE
MEMBERS ONLY
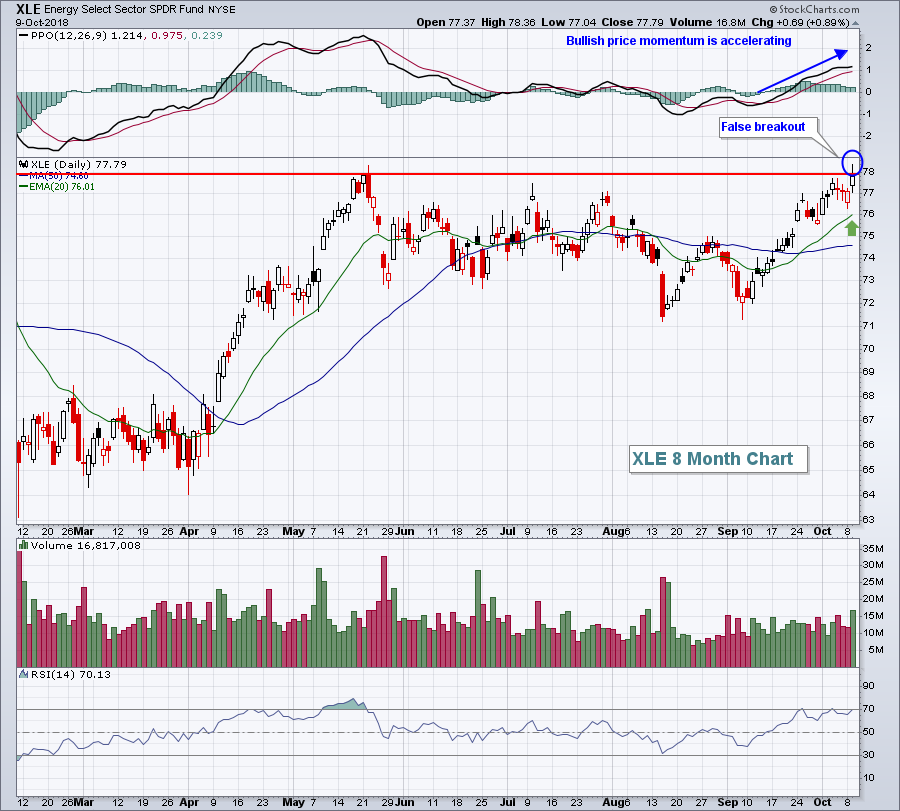
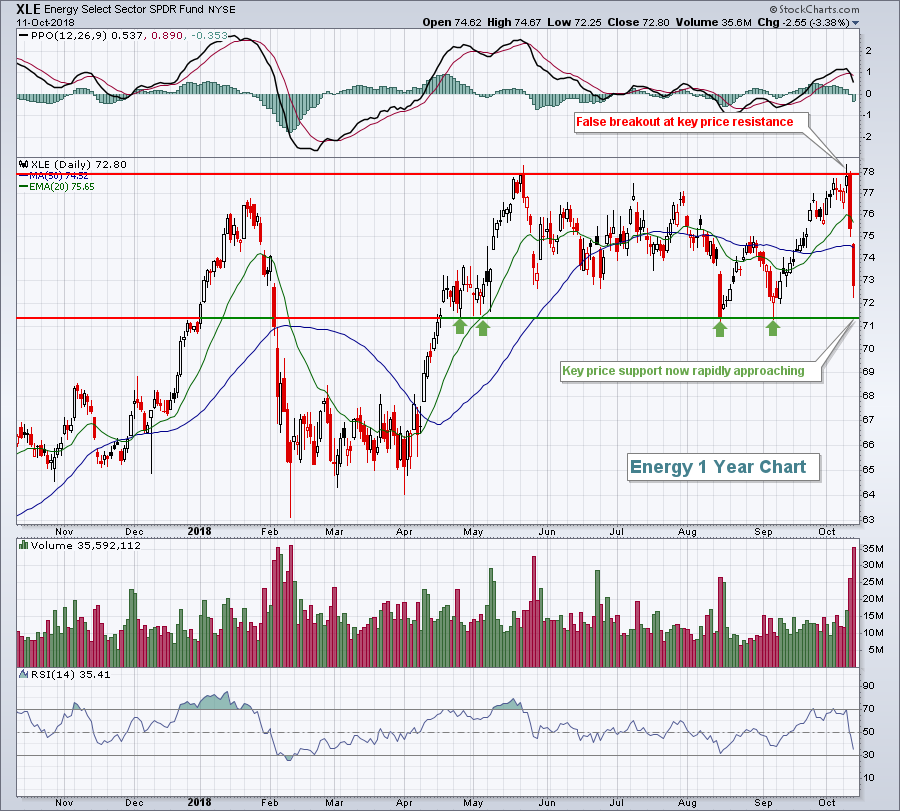
Energy Continues To Lead But Failed At Key Resistance
by Tom Bowley,
Chief Market Strategist, EarningsBeats.com
Special Note
I will be speaking to the Charlotte Chapter of the American Association of Individual Investors (AAII) this Saturday, October 13th at 10:00am EST. I plan to discuss how to evaluate the sustainability of a bull market, relative strength and gap trading strategies. The first meeting is FREE...
READ MORE
MEMBERS ONLY

Walmart Makes a Move with Good Volume
by Arthur Hill,
Chief Technical Strategist, TrendInvestorPro.com
Walmart (WMT) is making waves again with a massive breakout in August and a small breakout on Tuesday.
WMT underperformed the market the first half of the year with a 25% decline from the January high to the May low. The stock firmed in May, began rising in June and...
READ MORE
MEMBERS ONLY

Nine Leading ETFs Become Short-term Oversold - Understanding the Chandelier Exit - 4 Stocks to Watch
by Arthur Hill,
Chief Technical Strategist, TrendInvestorPro.com
* XLF at Moment of Truth
* Three Stocks and a Third of XLF
* August-September Leaders are Oversold
* Understanding the Chandelier Exit
* SPY and QQQ Join Oversold Parade
* 9 Oversold Setups and 1 Example
* Stocks to Watch: HOLX, VRSK, AMJ, WMT
... The Financials SPDR (XLF) seems like a dangerous sector to be...
READ MORE
MEMBERS ONLY

New Evidence Suggests A Change In Market Leadership Is Underway
by Martin Pring,
President, Pring Research
* The US market viewed from abroad
* Resource based sectors in general are under-performing
* Defensive sectors are generally improving
* Ratio between a late and early performing sector is at a critical juncture
Back in August I wrote an article pointing out that we might be in the early stages of a...
READ MORE
MEMBERS ONLY
DP Bulletin #2: OEX New ST Neutral Signal - QQEW New IT Neutral Signal, NDX Next?
by Erin Swenlin,
Vice President, DecisionPoint.com
Another BUY signal is lost on the DP Scoreboard Summary. The OEX joins the SPX and NDX with a new ST Trend Model Neutral Signal. Interestingly, today the equal-weight Nasdaq 100 ETF (QQEW) logged a new IT Trend Model Neutral signal. Does this portend the same for the NDX?
The...
READ MORE
MEMBERS ONLY
Consumer Staples And Real Estate Lead Rally
by Tom Bowley,
Chief Market Strategist, EarningsBeats.com
Market Recap for Monday, October 8, 2018
Consumer staples (XLP, +1.38%) and real estate (XLRE, +1.29%) helped to power Monday's reversal, but that was not enough to turn around the fortunes for the NASDAQ, which still dropped more than 50 points as technology (XLK, -1.13%...
READ MORE
MEMBERS ONLY
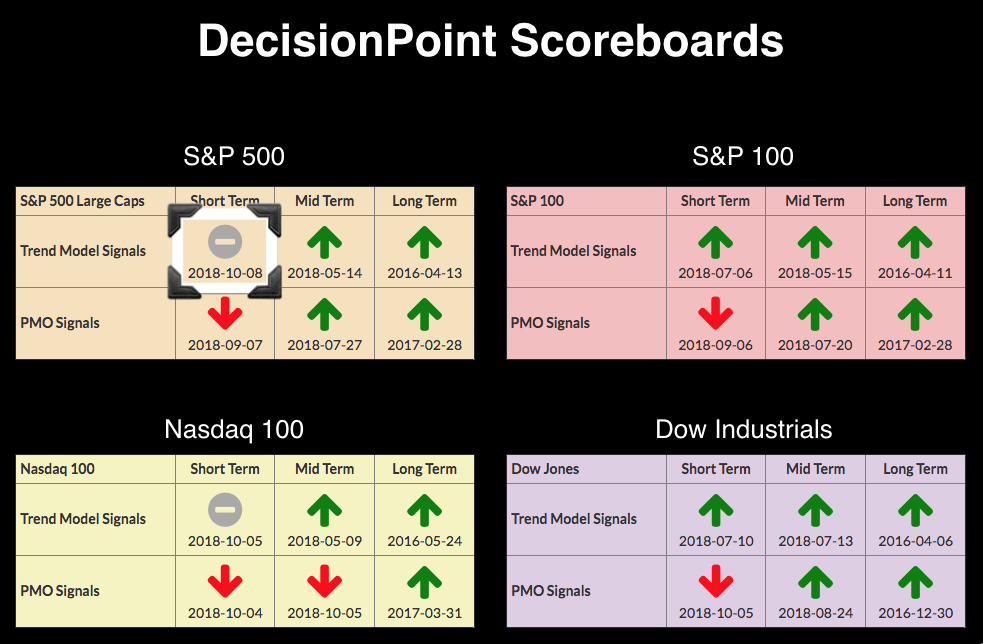
DP Bulletin #1: SPX - New ST Trend Model Neutral Signal
by Erin Swenlin,
Vice President, DecisionPoint.com
Just a quick bulletin for my readers. The SPX just triggered a Short-Term Trend Model Neutral signal. The 5-EMA crossed below the 20-EMA while the 20-EMA was above the 50-EMA which generated the Neutral signal v. a SELL signal.
Technical Analysis is a windsock, not a crystal ball.
Happy Charting!...
READ MORE
MEMBERS ONLY

Health Care Plan

by Bruce Fraser,
Industry-leading "Wyckoffian"
In March of 2017 the Health Care Sector (XLV) emerged from a large Reaccumulation structure into a fresh new uptrend. Much has happened since then. Let’s update the status of this uptrend.
After a sustained advance from 2009 to 2015 the trend stopped and a Reaccumulation formed. This trend...
READ MORE
MEMBERS ONLY

This Biotech Bucked the Selling Pressure Last Week
by Arthur Hill,
Chief Technical Strategist, TrendInvestorPro.com
Last week was tough on stocks as the S&P 500 SPDR declined around 1%, the Nasdaq 100 ETF fell 3% and the Biotech iShares plunged 4.5%. Despite a rough week, note that some 180 stocks in the S&P 500 closed higher and bucked the selling...
READ MORE
MEMBERS ONLY
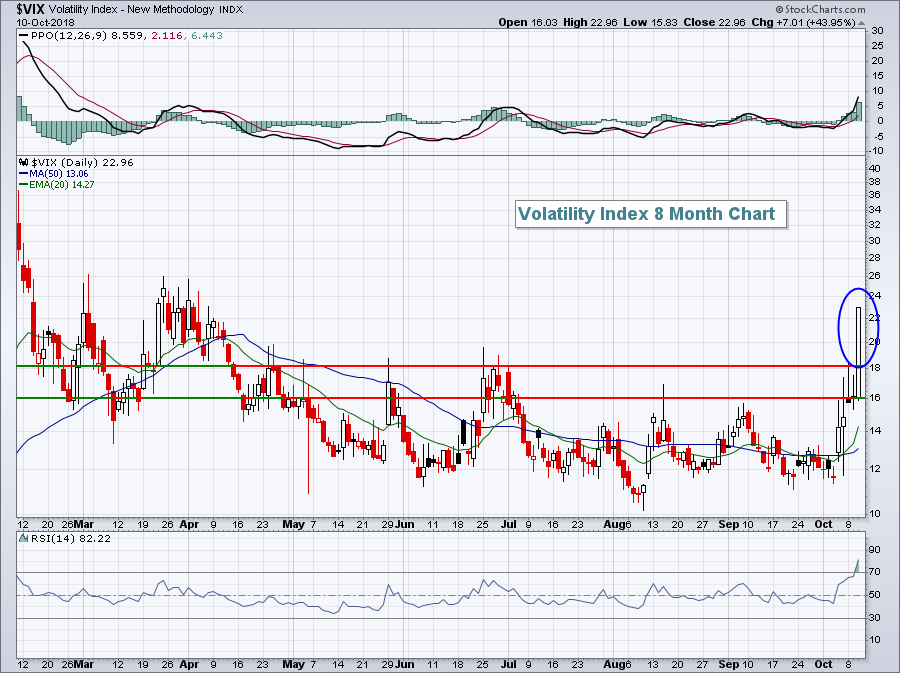
VIX Hits Highest Level In 3 Months - What That Means
by Tom Bowley,
Chief Market Strategist, EarningsBeats.com
Market Recap for Friday, October 5, 2018
There was good news and bad news Friday on the volatility front. The Volatility Index ($VIX) hit 17.36 intraday on Friday, the highest level of expected volatility since the late-June swoon, and it closed another 4% higher after a big spike on...
READ MORE
MEMBERS ONLY

SystemTrader: A Rules-Based Approach for When to Cry Uncle
by Arthur Hill,
Chief Technical Strategist, TrendInvestorPro.com
* Defining the Broad Market Environment.
* Measuring Participation.
* Uptrends Versus Downtrends.
* Measuring Market Leadership.
* Weight of the Evidence.
... The Broad Market Environment
... For a long time now, I have been using three breadth indicators to define the broad market environment, bull market or bear market. As with trend-following, this system will...
READ MORE
MEMBERS ONLY
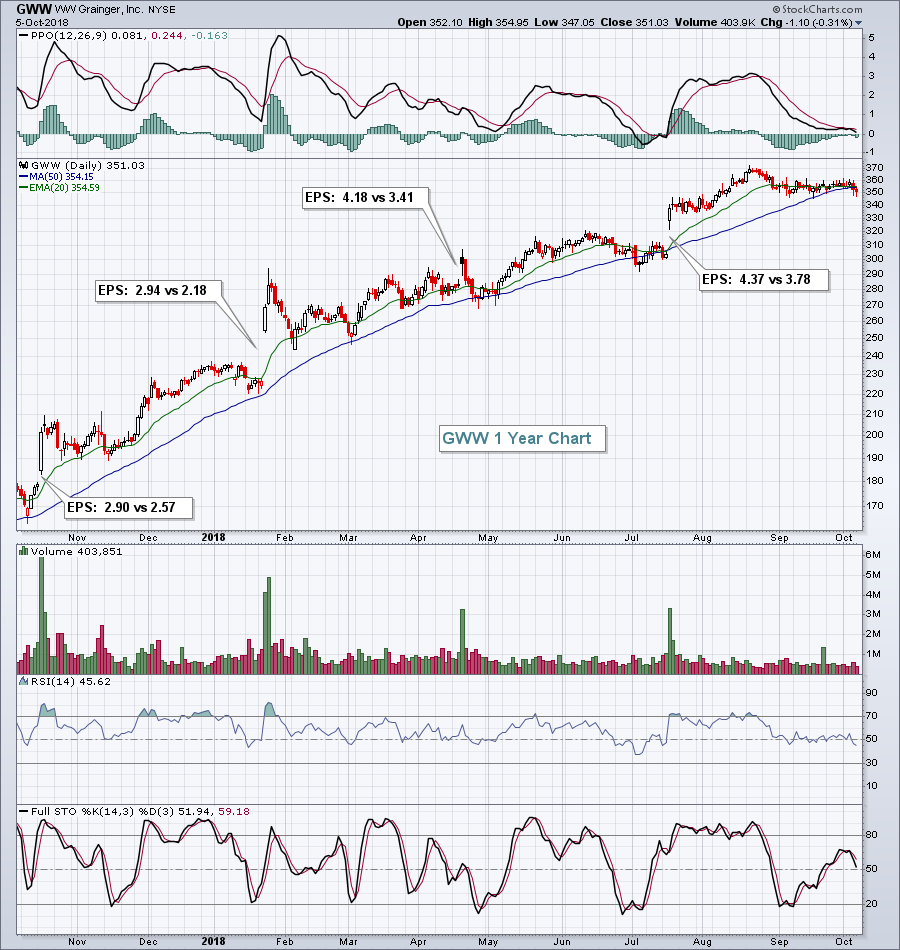
Here's A Stock That Regularly Beats Its Earnings Estimates

by John Hopkins,
President and Co-founder, EarningsBeats.com
We're approaching another earnings season, setting up trading opportunities in the normally bullish fourth quarter. While we favor waiting to see quarterly earnings reports and the market's reaction to those reports, we also know many of you try to trade companies prior to their better-than-expected reports....
READ MORE
MEMBERS ONLY
When Panicked Selling Kicks In, Look To The VIX For A Bottom Call
by Tom Bowley,
Chief Market Strategist, EarningsBeats.com
It was a brutal week for many areas of the stock market, but mostly those areas that have led the charge for so long. Stocks that for one to two years or more rarely saw a significant pullback suddenly couldn't find buyers this week. Unfortunately, that's...
READ MORE
MEMBERS ONLY
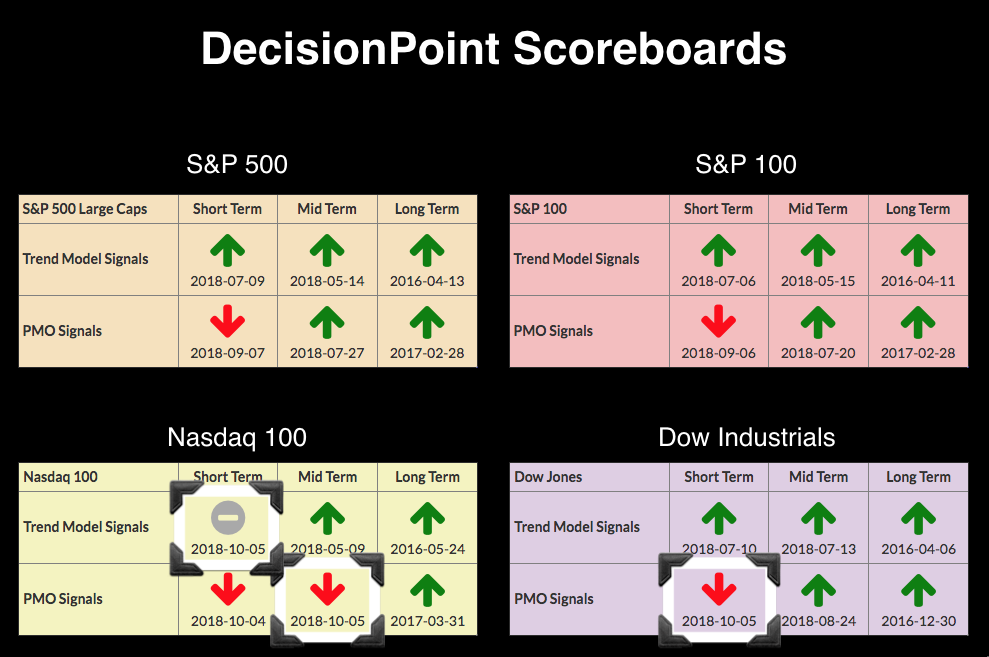
DP Scoreboards Lose Their Shine - NDX Loses 2 More BUY Signals - Dow Adds PMO SELL Signal
by Erin Swenlin,
Vice President, DecisionPoint.com
The BUY signals are starting to peel away on the DecisionPoint Scoreboards. The Dow which has been the most stout, but after the corrective move of the past two days, it couldn't hang on to its "all green" Scoreboard. Technology, as most know, has been hit...
READ MORE
MEMBERS ONLY

Utilities Shine as Market Takes a Turn
by Arthur Hill,
Chief Technical Strategist, TrendInvestorPro.com
Utilities are not the most exciting stocks in the world, but the Utilities SPDR (XLU) is the third best performing sector since February and the second best performing sector last week. The could have further to run. Let's look at the charts.
The first chart shows weekly bars...
READ MORE
MEMBERS ONLY
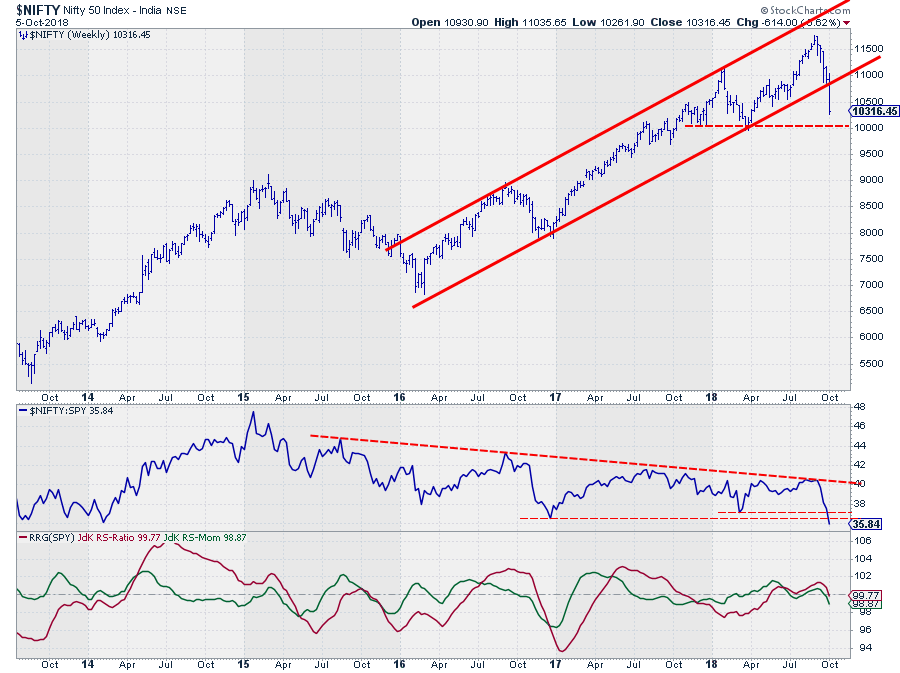
NIFTY breaks trend. Pharma and IT show relative strength
by Julius de Kempenaer,
Senior Technical Analyst, StockCharts.com
The Indian $NIFTY Index dropped out of an almost three-year uptrend at the close of last week. The rising support line that started at the low in early 2016 did not manage to hold up and was clearly broken during last week's market action.
This move changes the...
READ MORE
MEMBERS ONLY
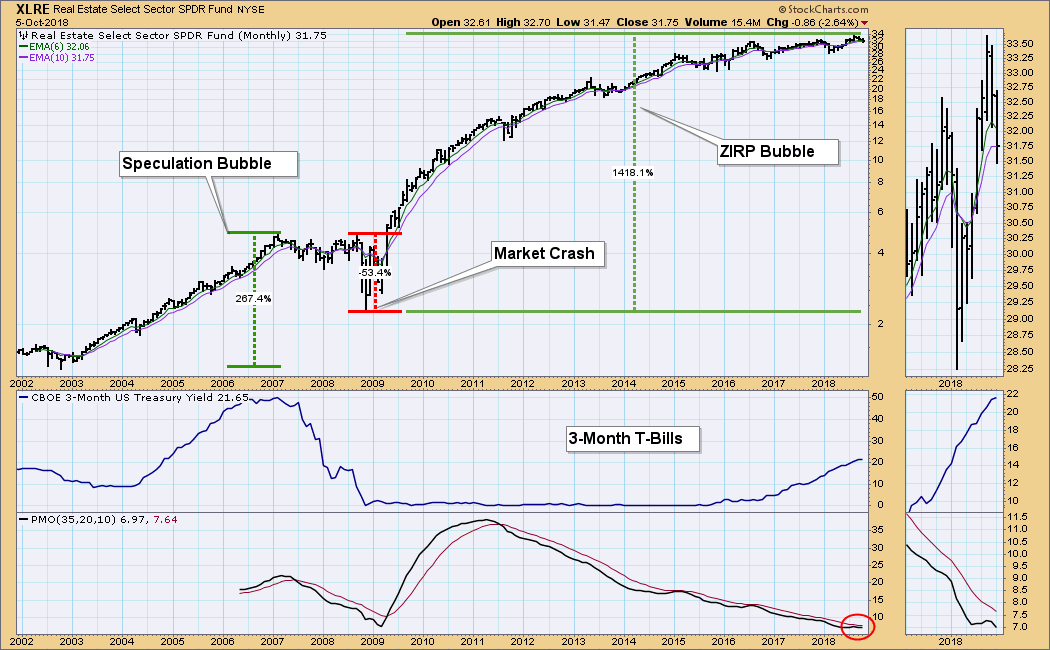
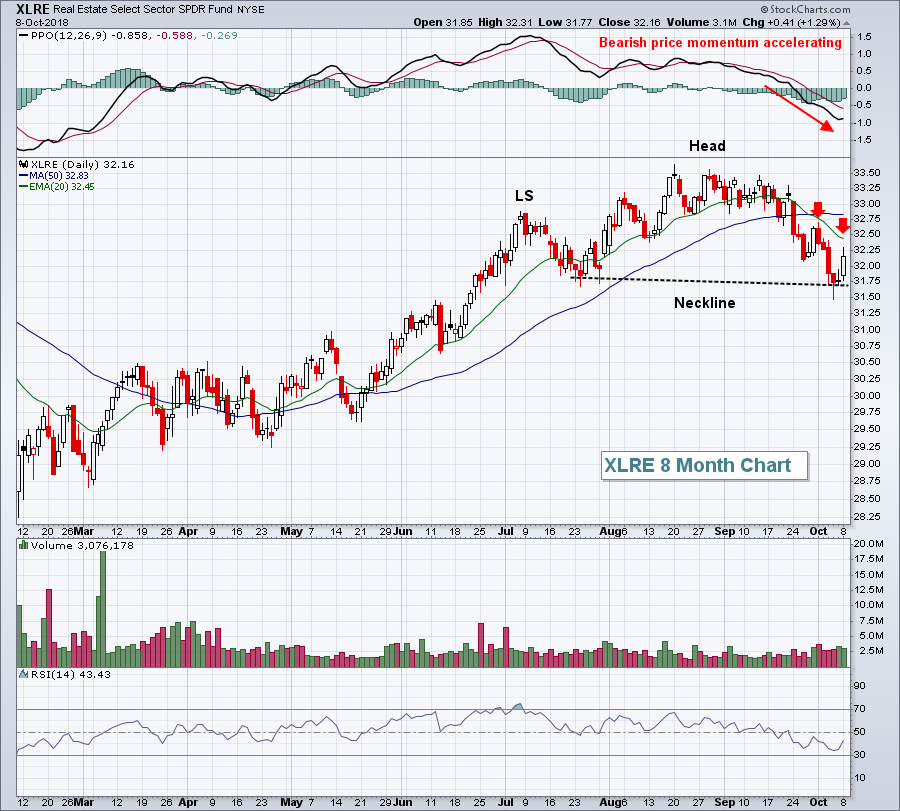
DP Weekly Wrap: Will Real Estate Be the Killer? Again?
by Carl Swenlin,
President and Founder, DecisionPoint.com
The root cause of the Financial Crisis was real estate speculation combined with Wall Street's perennial, casual disregard for other people's money. After the real estate market crashed, the zero interest rate policy (ZIRP) was put forth in order to see that real estate speculators were...
READ MORE
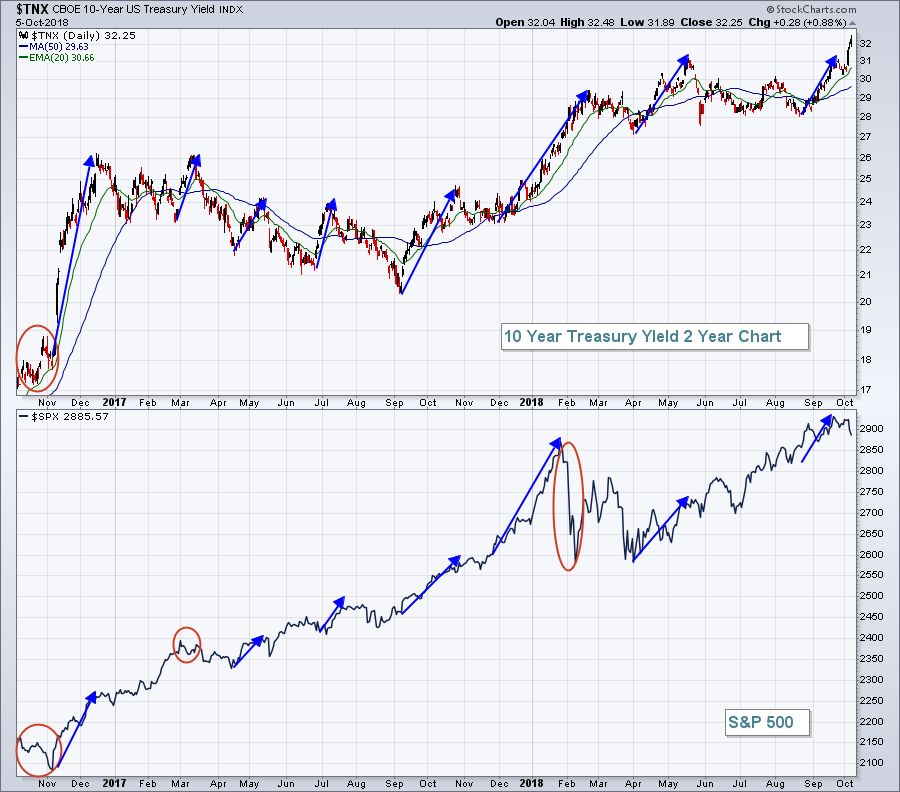
MEMBERS ONLY

HIGHER BOND YIELDS WEIGH ON STOCK PRICES -- CONSUMER CYCLICALS AND TECHNOLOGY CONTINUE TO LEAD THE MARKET LOWER -- THE QQQ FALLS BELOW ITS 50-DAY AVERAGE -- WHILE THE SOXX BREAKS ITS 200-DAY LINE
by John Murphy,
Chief Technical Analyst, StockCharts.com
A LOT OF MOVING AVERAGE LINES ARE BEING BROKEN... Stocks continue the retreat that began after bond yields reached multiyear highs at midweek. Bond yields are hitting new highs again today. As was the case yesterday, consumer cyclicals and technology are the two worst sector performers. Chart 1 shows the...
READ MORE
MEMBERS ONLY
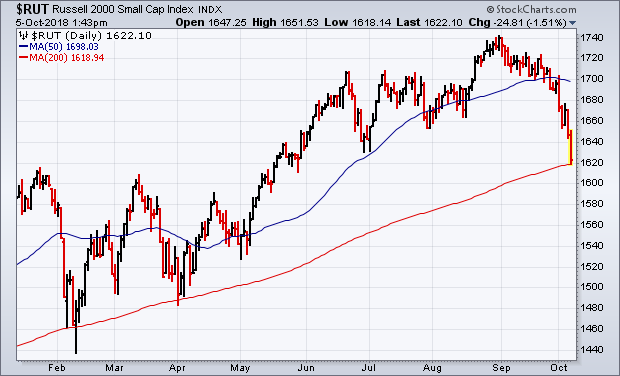
Russell 2000 Is Now Retesting Its 200-Day Average
by John Murphy,
Chief Technical Analyst, StockCharts.com
Editor's Note: This article was originally published in John Murphy's Market Message on Friday, October 5th at 2:02pm ET.
Tuesday's message showed the Russell 2000 Small Cap Index being the first of the major market indexes to fall below its 50-day line, and...
READ MORE
MEMBERS ONLY

Weekly Market Review & Outlook (with video) - Working with Assumptions and Predictions
by Arthur Hill,
Chief Technical Strategist, TrendInvestorPro.com
* Performance Overview.
* The Perfect Storm or Just Coincidence?
* Working with Assumptions and Predictions.
* We've Seen this Movie Before (QQQ).
* New Lows Increase.
* More Uptrends than Downtrends.
* XLC Reverses Counter-trend Bounce.
* XLF Bounces off Support.
* XLI Holds Strong.
* XLE Remains with Breakout.
* XLY Becomes Short-term Oversold.
* Notes from the...
READ MORE
MEMBERS ONLY

What Are The Odds Of An October Surprise?
by Martin Pring,
President, Pring Research
* Conditions that feed a crash
* Rising rates
* Emerging markets could be the triggering mechanism
* Market breadth not so hot
* Is the e-commerce bubble bursting?
Conditions that feed a crash
October started off as just a continuation of September’s dull price activity. However, knowing that the month of October has...
READ MORE
MEMBERS ONLY
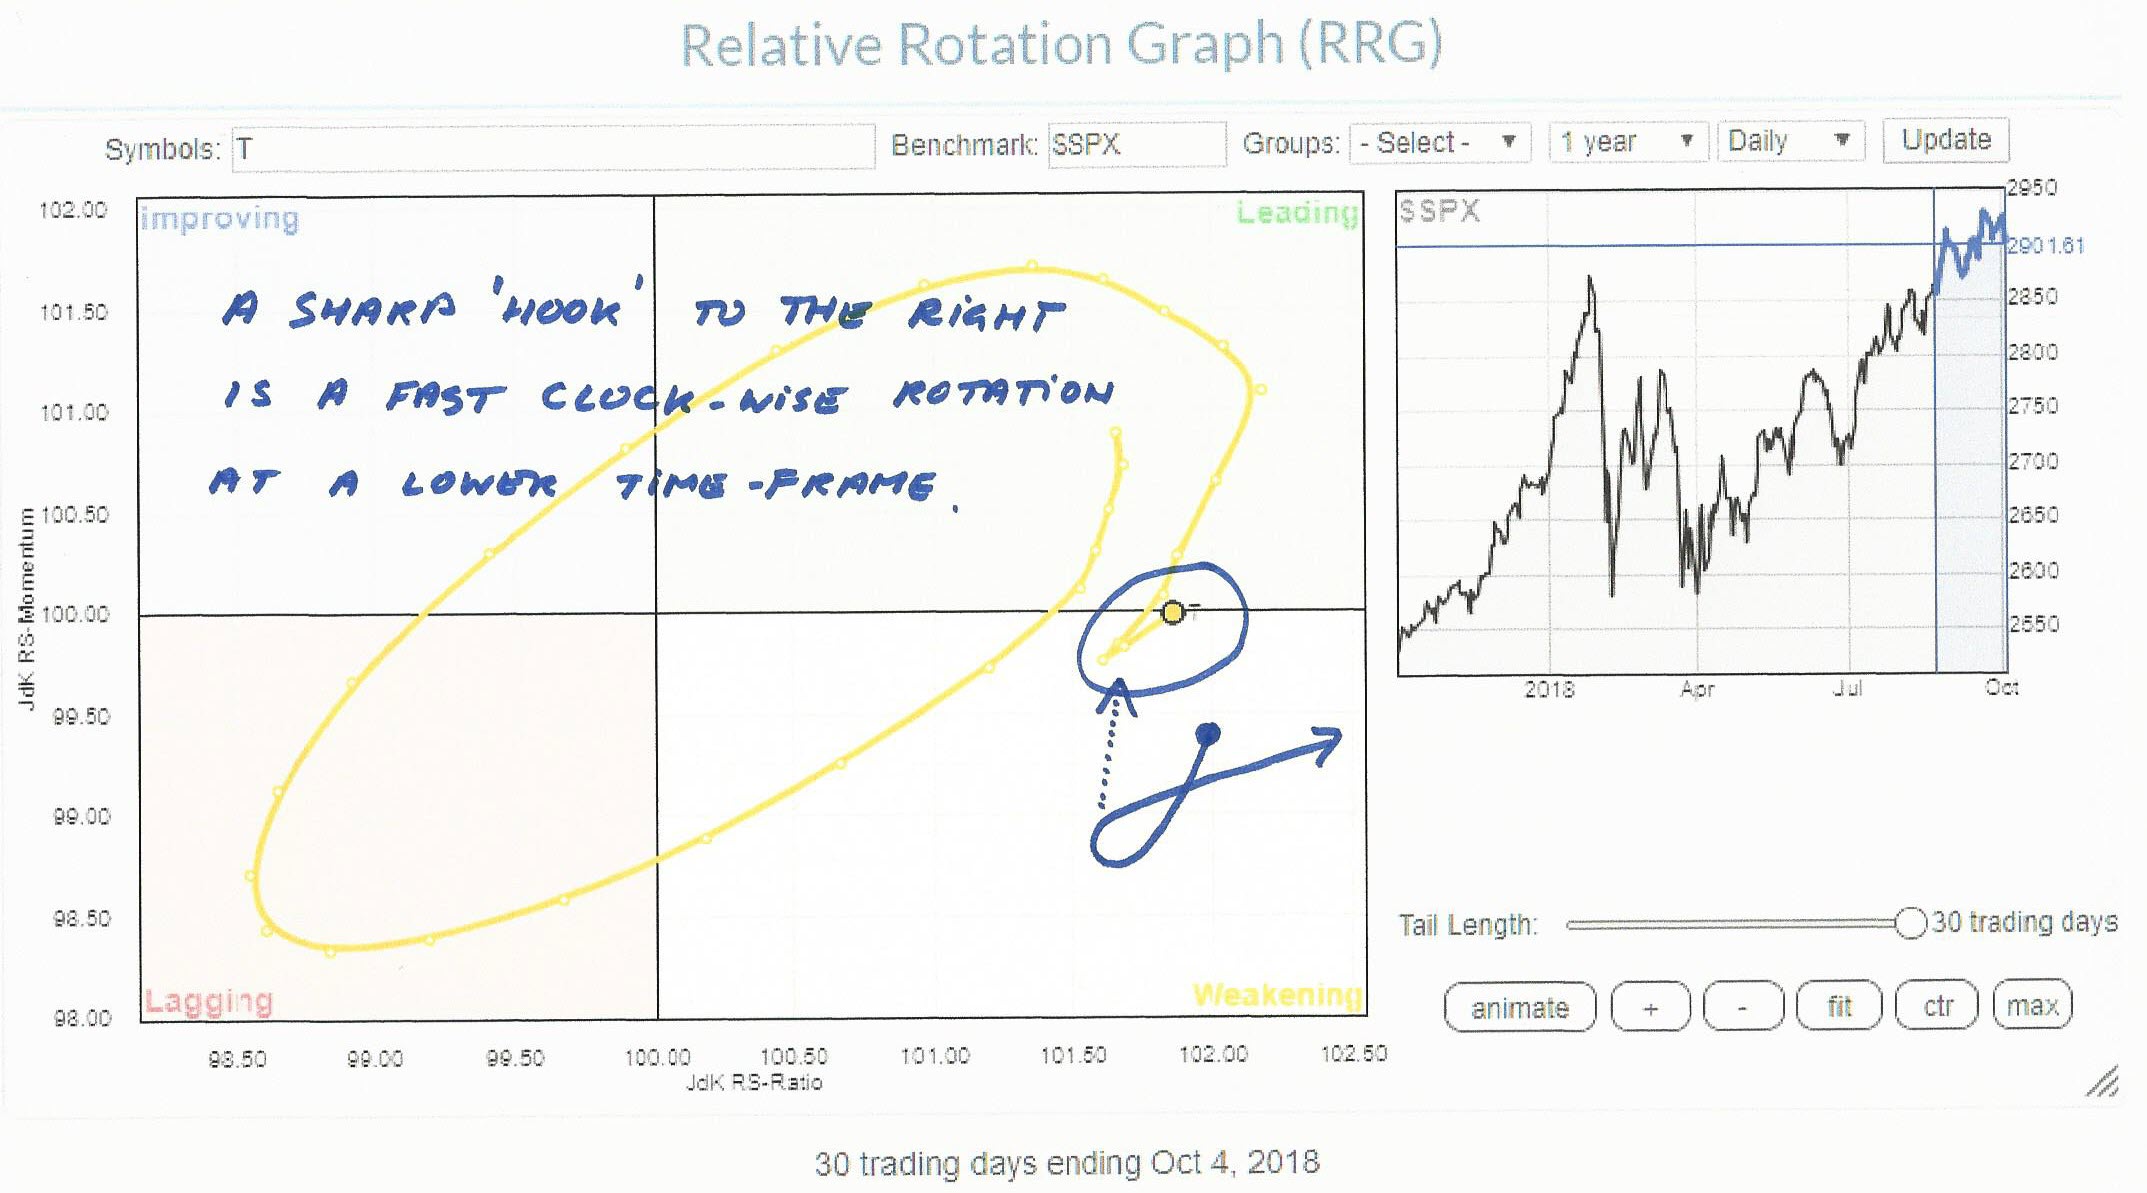
AT&T calling!
by Julius de Kempenaer,
Senior Technical Analyst, StockCharts.com
After yesterday's close (10/4) I ran a Relative Rotation Graph of the Top-10 Market Movers inside the S&P-500 index.
One of the names that popped up as potentially interesting was AT&T (T) as it is inside the improving quadrant and moving towards the...
READ MORE
MEMBERS ONLY
Deep Selling Grips Wall Street, Support Levels To Watch
by Tom Bowley,
Chief Market Strategist, EarningsBeats.com
Market Recap for Thursday, October 4, 2018
While we've seen plenty of market rotation over the past several months, there hasn't been much outright selling. Yesterday changed that. The NASDAQ recovered off of its intraday lows a bit to "only" close down 1.81%...
READ MORE
MEMBERS ONLY
DP Bulletin #2: NDX Loses 3 Day-Old PMO BUY Signal
by Erin Swenlin,
Vice President, DecisionPoint.com
Well that didn't last long. The NDX had finally joined the Dow with a Scoreboard complete with BUY signals on Friday. Today's pullback erased that as the PMO was yanked downward and back under its signal line.
Interestingly, the NDX is the only Scoreboard index that...
READ MORE