MEMBERS ONLY

Is This The End Of The Game For Tech Stocks?

by Martin Pring,
President, Pring Research
* Widespread dissemination of tech sell-off
* Bears, not so fast
* Not all tech sub groups experienced Friday’s selling spree
* Commodities are down, but are they out?
Widespread dissemination of tech sell-off
In the last few days, we have seen a tremendous amount of financial media space alerting us to Friday&...
READ MORE
MEMBERS ONLY
NASDAQ And Technology Slump Continues; Apple Downgraded

by Tom Bowley,
Chief Market Strategist, EarningsBeats.com
Market Recap for Monday, June 12, 2017
U.S. indices fell in unison on Monday and the tech-laden NASDAQ led the action, but after Friday's bloodbath, it certainly could have been worse. Based on overall action Friday and Monday, it appears to be a healthy rotation from the...
READ MORE
MEMBERS ONLY
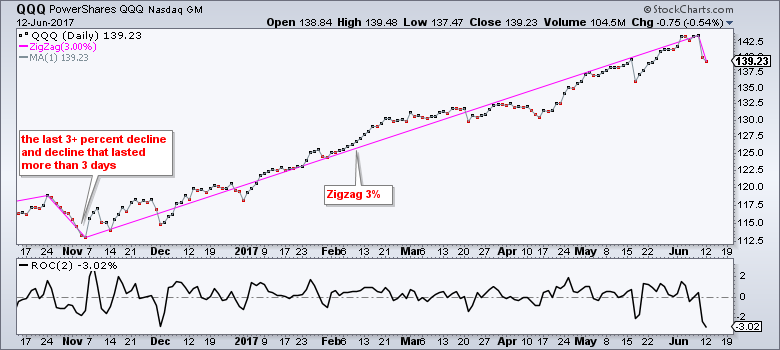
QQQ Takes a Hit, Two Leading EW Sectors and Eight Stock Setups

by Arthur Hill,
Chief Technical Strategist, TrendInvestorPro.com
.... QQQ Suffers Biggest Loss since early November
.... EW Industrials Sector Nears New High
.... Cummins and JetBlue Lead Industrials
.... New Highs for EW Materials ETF and Cemex
.... CA Forms Out-of-Place Ascending Triangle
.... Cypress Semi Falls Back into Correction
.... Double Top and Death Cross for F5, but
.... Zimmer Biomet Fills Gap with...
READ MORE
MEMBERS ONLY
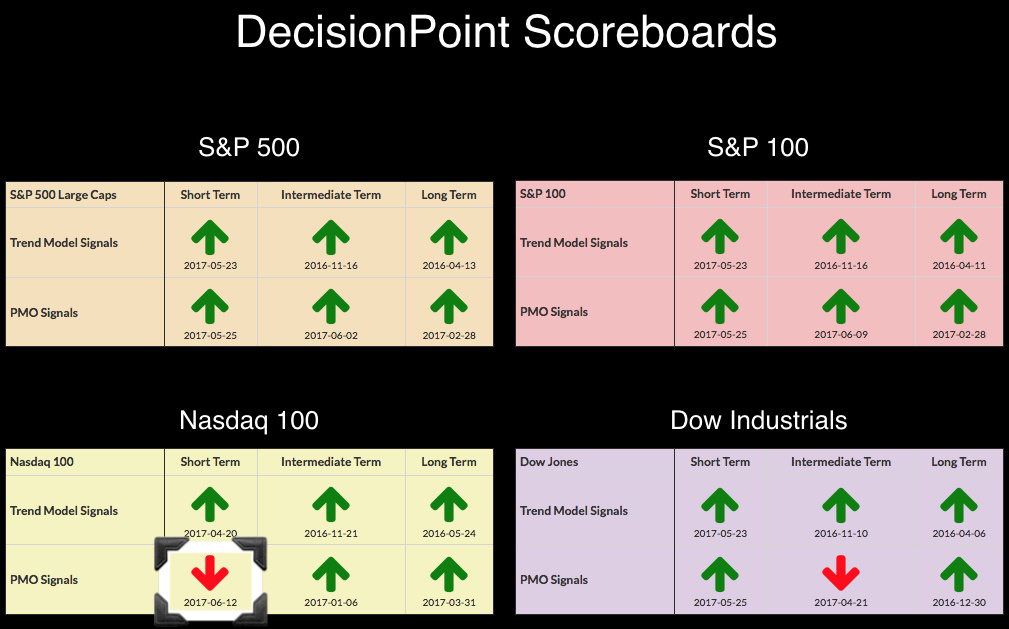
Nasdaq 100 New PMO SELL Signal - New ITTM BUY Signal for Financial SPDR (XLF)

by Erin Swenlin,
Vice President, DecisionPoint.com
As the market closed, I received a Technical Alert that the NDX had triggered a PMO SELL signal. Additionally, I received notice that a new Intermediate-Term Trend Model (ITTM) BUY signal just occurred today on the Financial SPDR (XLF). I've updated the NDX Scoreboard. It is the first...
READ MORE
MEMBERS ONLY
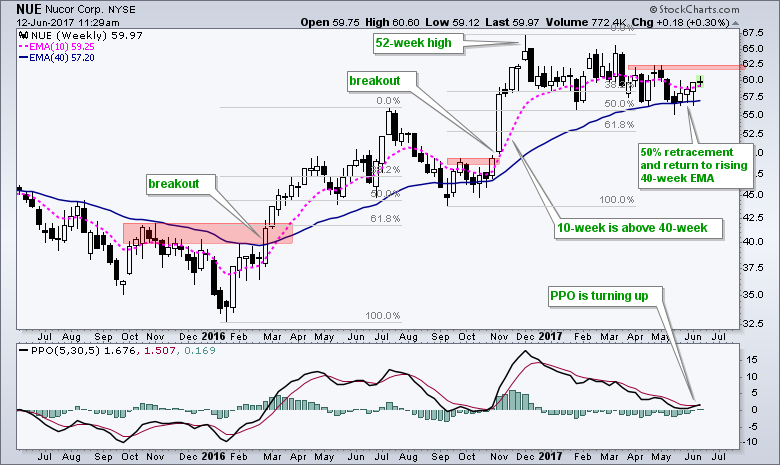
NUE Shows Early Signs of Ending its Correction $NUE
by Arthur Hill,
Chief Technical Strategist, TrendInvestorPro.com
Nucor (NUE) is flat year-to-date and lagging the S&P 500, but the bigger trend is up and short-term momentum is turning up. The bigger trend is up because Nucor surged to a 52-week high in early December and the 10-week EMA remains above the 40-week EMA, even after...
READ MORE
MEMBERS ONLY
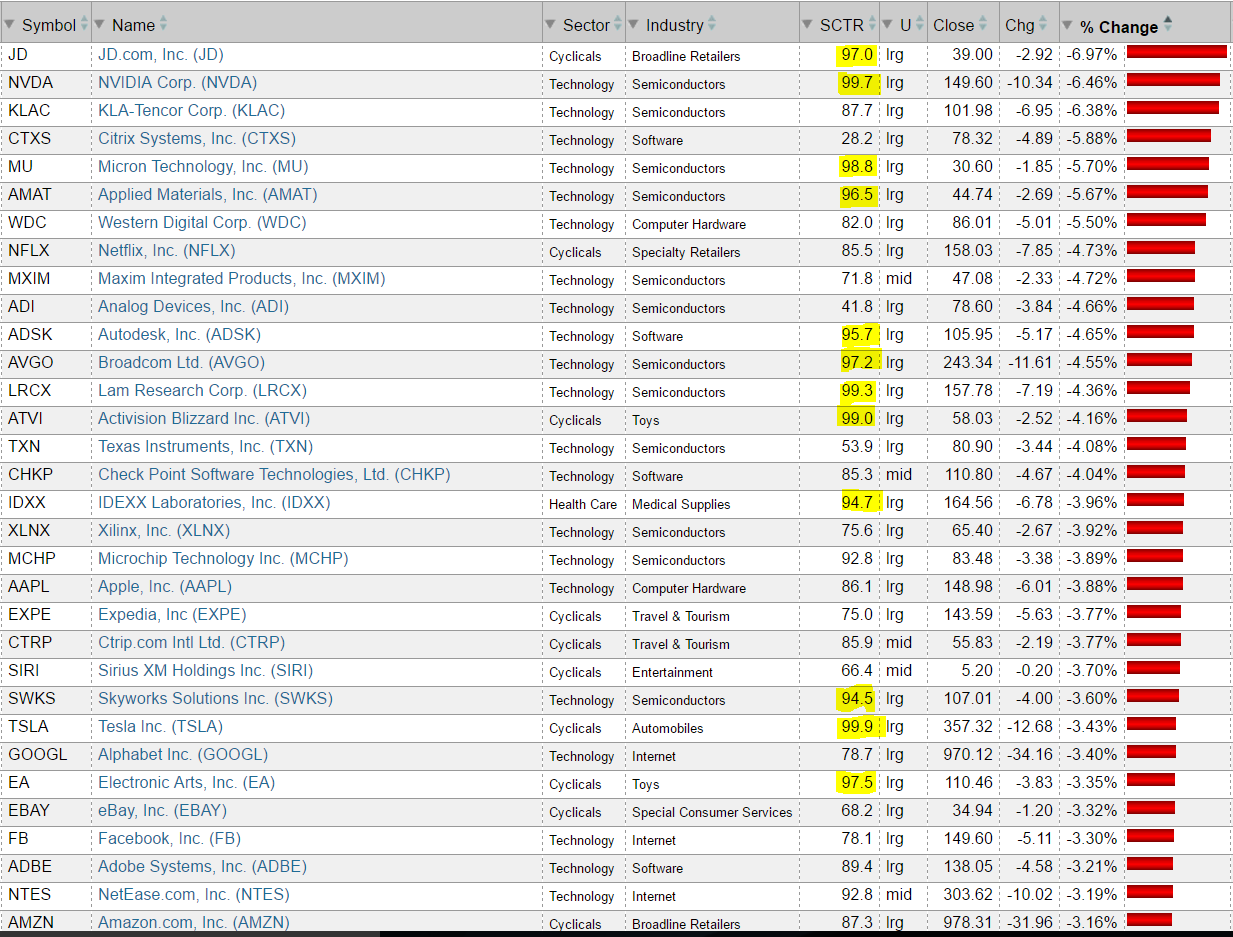
High SCTR Stocks Hammered; NASDAQ 100 Plunges
by Tom Bowley,
Chief Market Strategist, EarningsBeats.com
Market Recap for Friday, June 9, 2017
They say a picture can say a thousand words so before I further discuss the carnage from Friday, take a look at this performance chart of NASDAQ 100 components:
Several of the best performing stocks (based on SCTR scores) were absolutely hammered on...
READ MORE
MEMBERS ONLY
Will You Know When the Market Peaks?

by Greg Morris,
Veteran Technical Analyst, Investor, and Author
The first thing you must realize is that you won’t know it is peaking until the decline is well underway. Market tops are extremely difficult to identify. That might seem hard to believe if you watch the financial media as those 'experts' are calling the top multiple...
READ MORE
MEMBERS ONLY
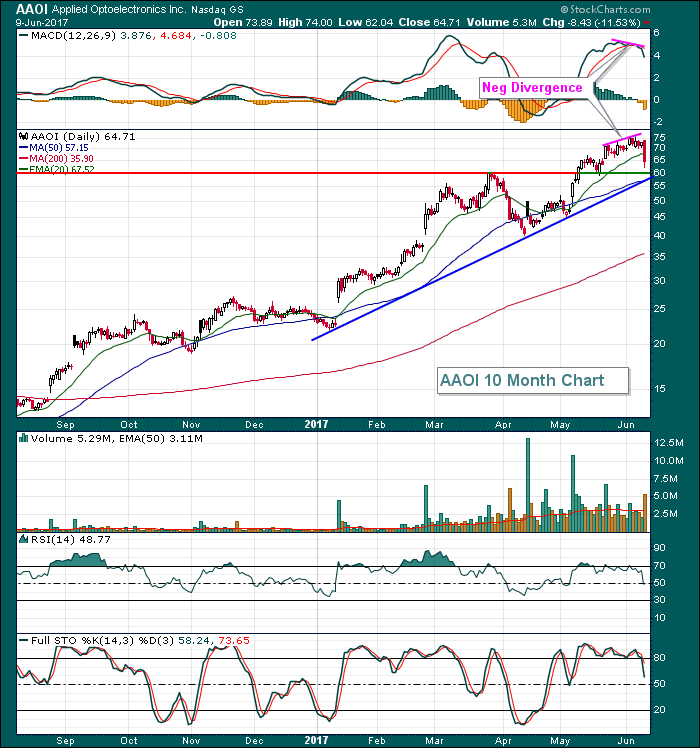
Applied Optoelectronics Follows Other High SCTR Stocks Lower On Friday
by Tom Bowley,
Chief Market Strategist, EarningsBeats.com
If you're someone that finds great investments among the high SCTR (StockCharts Technical Rank) stocks, you probably enjoy better than average returns most of the time. However, Friday was not one of those times. The NASDAQ 100, clearly the best performing index among our major indices in 2017,...
READ MORE
MEMBERS ONLY
DecisionPoint Weekly Wrap -- Record Highs, Then Reversal

by Carl Swenlin,
President and Founder, DecisionPoint.com
Last week I wrote: ". . . the spike in S&P 500 New Highs makes me think that the market may be on the verge of another consolidation or correction that could last several weeks." I still think that outlook is viable, based upon this week's price...
READ MORE
MEMBERS ONLY

Shorts Find TSLA Shocking

by Bruce Fraser,
Industry-leading "Wyckoffian"
Tesla has just achieved a market capitalization that is larger than either Ford or General Motors. Currently Tesla manufactures just two different models (with a third on the way). How is it possible that Tesla has a valuation that exceeds these two Detroit behemoths? As a Wyckoffian I will tell...
READ MORE
MEMBERS ONLY
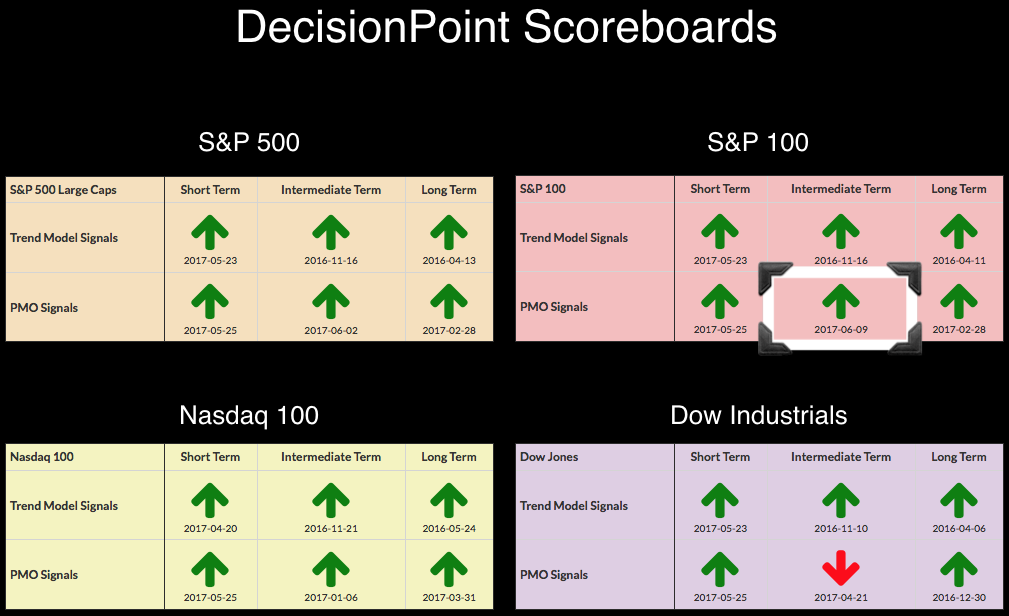
DP News Bulletin: New Weekly PMO BUY Signal on $OEX
by Erin Swenlin,
Vice President, DecisionPoint.com
As the week closes, we did see one new signal change on the DecisionPoint Scoreboards that I wanted to point out. The S&P 100 (OEX) triggered a new PMO BUY signal on the weekly chart.
I wouldn't get overly excited given the PMO has flattened and...
READ MORE
MEMBERS ONLY

Financials Break To The Upside And That's Good For The Market
by Martin Pring,
President, Pring Research
* The head and shoulders that did not “work”
* Inflation versus deflation sectors
* Which are the financial sector stars?
* Why financials matter
The head and shoulders that did not “work”
On this same date in May we published an article suggesting that financials could be an interesting area to monitor for...
READ MORE
MEMBERS ONLY

Paul Merriman's Essential Investor Challenge Questions: The Answers by Gatis Roze

by Gatis Roze,
Author, "Tensile Trading"
At a May 20th presentation to the Seattle chapter of the AAII, Paul Merriman confirmed to me his standing as a respected elder of investment management. Since selling his multi-billion dollar advisory firm in 2012, he has been running a financial education foundation. His motto “knowledge is power” is an...
READ MORE
MEMBERS ONLY

INVESTORS ARE SELLING TECHNOLOGY AND BUYING FINANCIALS -- THAT SUGGESTS A ROTATION OUT OF GROWTH AND INTO VALUE STOCKS

by John Murphy,
Chief Technical Analyst, StockCharts.com
HEAVY PROFIT-TAKING IN TECHNOLOGY... An overbought technology sector is being sold heavily today. Chart 1 shows the PowerShares Nasdaq 100 (QQQ) tumbling in heavy trading. That's mainly big technology stocks. Chart 2 shows the Technology SPDR (XLK) looking just as bad. The FANG stocks are a big part...
READ MORE
MEMBERS ONLY

Weekly Market Review & Outlook (w/ Video) - Small-caps, Finance and Miners Bid to End Corrections
by Arthur Hill,
Chief Technical Strategist, TrendInvestorPro.com
.... Bullish until it Ain't (seasonality)
.... SPY Extend Higher
.... Small-caps Challenge for Leadership
.... Finance Sector Bids to End Correction
.... Insurance Leads and Regionals Play Catch Up
.... Materials Sector Hits New High
.... XME Makes a Bid to End Correction (plus steel)
.... Copper and Aluminum Bid to End Corrections
.... Four Aluminum...
READ MORE
MEMBERS ONLY
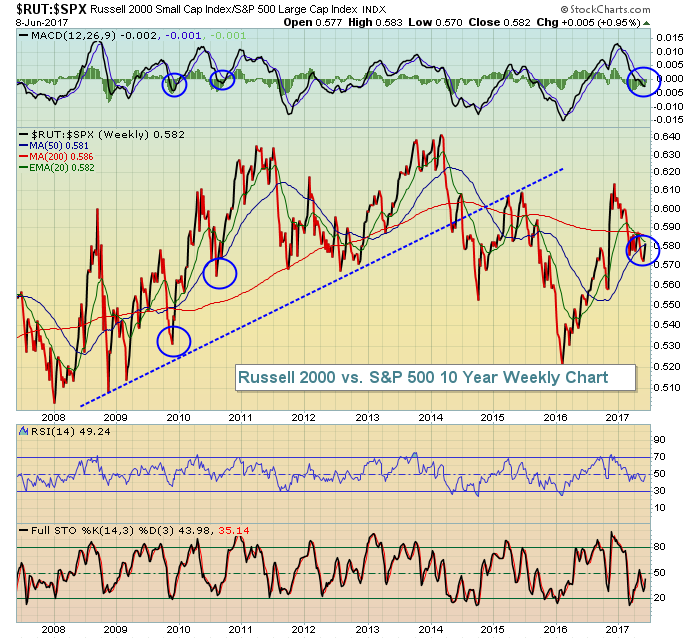
Russell 2000 Soars, On Cusp Of Breakout
by Tom Bowley,
Chief Market Strategist, EarningsBeats.com
Market Recap for Thursday, June 8, 2017
Small caps were the clear and undeniable leader on Thursday as the Russell 2000 gained 1.36% while the NASDAQ was the second best performing index at +0.39%. I posted yesterday in this blog that the Russell 2000 needed to clear 1420...
READ MORE
MEMBERS ONLY
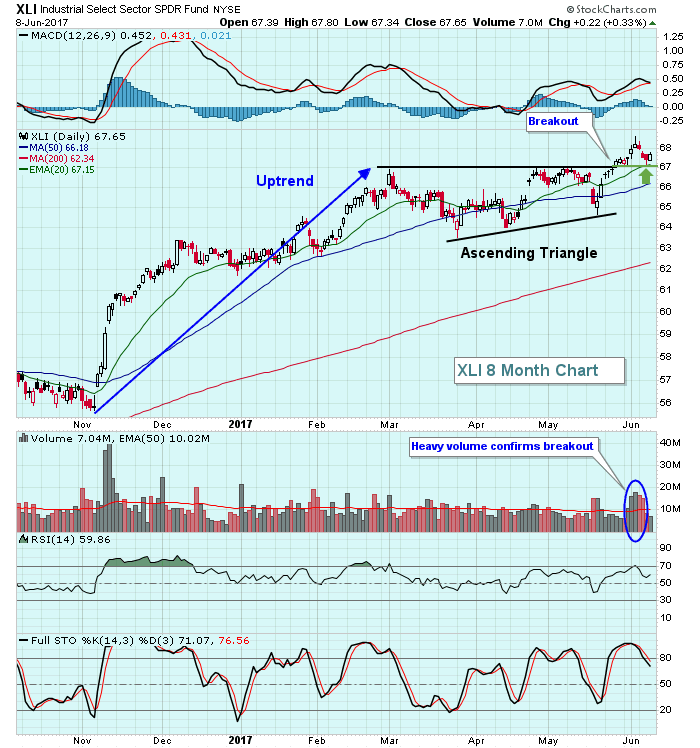
Industrials Back Test Their Ascending Triangle Breakout
by Tom Bowley,
Chief Market Strategist, EarningsBeats.com
Over the past week, it's been about an even split among sectors in terms of winners and losers. Industrials (XLI) is one sector that's been slightly lower over the past week, but technically things still look very bright in this space. Broken price resistance generally becomes...
READ MORE
MEMBERS ONLY
Determining Trend Direction and Trend Strength with Simple Indicators - Plus Scan Code
by Arthur Hill,
Chief Technical Strategist, TrendInvestorPro.com
.... Finding Strong and Persistent Uptrends
.... Understanding Your Indicators
.... A Simple Trend Following
.... Measuring Trend Strength
.... Focus on a Failure
.... Strong Uptrend Scan Code
.... Current State of the Market ....
Finding Strong and Persistent Uptrends
There are some incredibly strong and persistent uptrends in the market right now and I would like...
READ MORE
MEMBERS ONLY

FINANCIALS HAVE A STRONG DAY -- BANK AND BROKER ETFS TURN UP -- ASSET MANAGERS INDEX HITS NEW RECORD -- LEADERS INCLUDE BLACKROCK, STATE STREET, AND BANK OF NEW YORK MELLON -- FINANCIAL RALLY MAY ALSO EXPLAIN SMALL CAP BUYING
by John Murphy,
Chief Technical Analyst, StockCharts.com
FINANCIAL SPDR TURNS SHARPLY HIGHER... Financial stocks are having a very strong day. Chart 1 shows the Financial Sector SPDR (XLF) surging to the highest level in a month and, in the process, clearing its 50-day average. That puts the XLF in position to challenge its spring highs. A decisive...
READ MORE
MEMBERS ONLY
Retail REITs And Banks Lift Financials But Energy Weighs With Plunging Crude
by Tom Bowley,
Chief Market Strategist, EarningsBeats.com
Market Recap for Wednesday, June 7, 2017
Crude oil ($WTIC) took a dive on Wednesday as inventories rose unexpectedly, causing a bit of panic among traders. Inventory supplies had fallen for eight straight weeks and traders were anticipating another drop of 3.5 million barrels. Instead, at 10:30am EST,...
READ MORE
MEMBERS ONLY
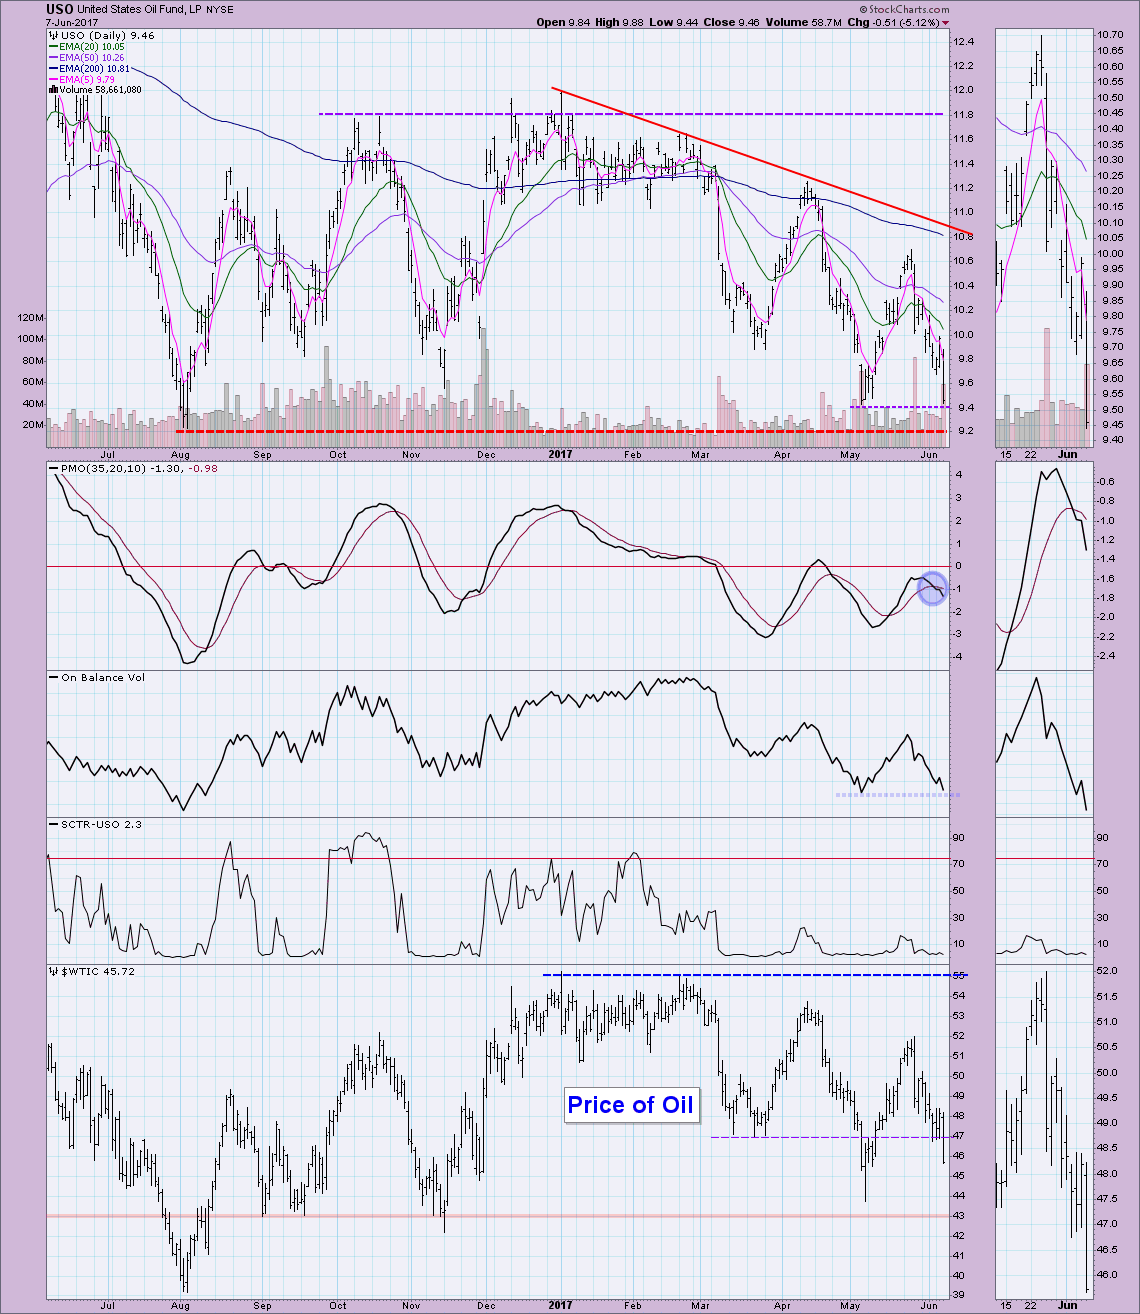
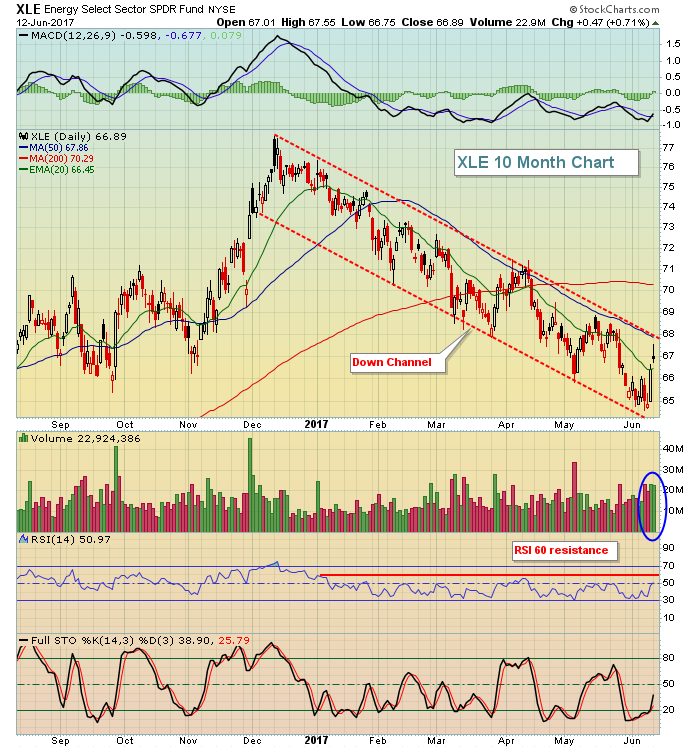
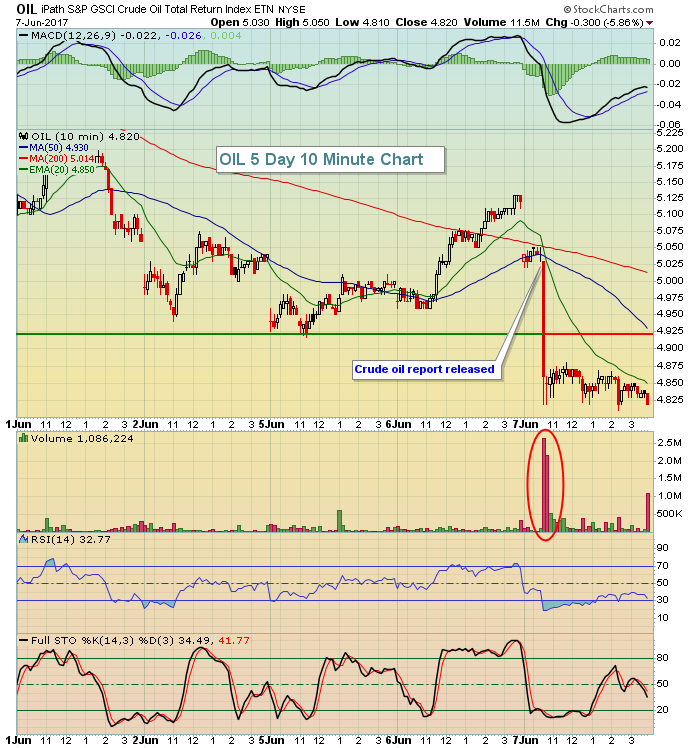
Oil Hammered Today - Time for a Bottom?
by Erin Swenlin,
Vice President, DecisionPoint.com
During today's MarketWatchers LIVE Show (12:00 - 1:30p MWF), the big news was the correction on Oil. Oil prices dropped more than 5 percent after the government reported an unexpected increase in crude inventories. After global producers cut inventories, the hope had been that supplies would...
READ MORE
MEMBERS ONLY

AIRLINES ARE LEADING TRANSPORTATION STOCKS HIGHER -- AIRLINE INDEX HITS RECORD HIGH -- DAY'S LEADERS ARE ALASKA AIR, DELTA, AMERICAN AIRLINES, AND JETBLUE -- FEDEX ACHIEVES BULLISH BREAKOUT -- KANSAS CITY SOUTHERN MAY BE CLOSE TO ONE
by John Murphy,
Chief Technical Analyst, StockCharts.com
TRANSPORTS CONTINUE TO GAIN... The daily bars in Chart 1 show the Dow Jones Transportation Average reversing higher today to continue its recent upturn. After finding support at its 200-day average during May, the TRAN rose above a three-month resistance line last week to signal its takeoff. It now appears...
READ MORE
MEMBERS ONLY
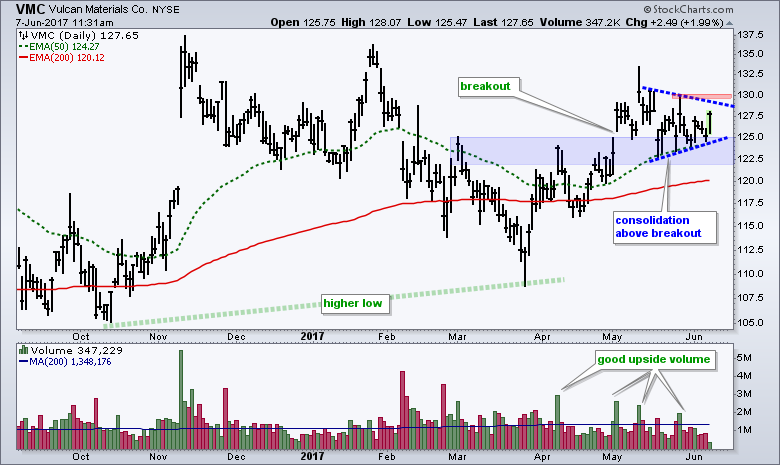
Vulcan Materials Consolidates above Breakout Zone $VMC
by Arthur Hill,
Chief Technical Strategist, TrendInvestorPro.com
After struggling the first three months of the year, Vulcan Materials (VMC) is showing signs of life since late March with good upside volume and a breakout in early May. Notice that the stock broke above a resistance zone in the 122-125 area and this zone turns into support. The...
READ MORE
MEMBERS ONLY
Energy Leads And Hadn't Done This Since November
by Tom Bowley,
Chief Market Strategist, EarningsBeats.com
Market Recap for Tuesday, June 6, 2017
Energy (XLE, +1.18) was easily the best performing sector on Tuesday as materials (XLB, +0.06%) was the only other sector to finish in positive territory - barely. Over the last five trading days, the XLE has printed a hollow candle (closing...
READ MORE
MEMBERS ONLY

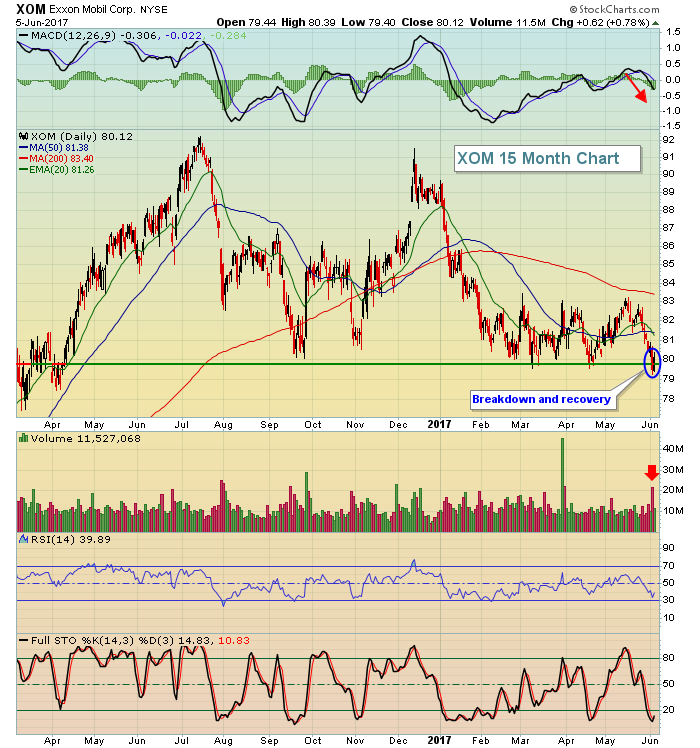
DP Alert: Gold Breaks Above Declining Tops Line Formed in 2012
by Erin Swenlin,
Vice President, DecisionPoint.com
The markets have been backing off this week but so far it hasn't shifted any short-term timing signals on the DecisionPoint Scoreboards. Gold rallied today and finally hurdled long-term overhead resistance along a declining tops trendline that originally formed in 2012. Price has made numerous attempts at pushing...
READ MORE
MEMBERS ONLY
Equities Down But Losses Mitigated By Two Unlikely Sectors
by Tom Bowley,
Chief Market Strategist, EarningsBeats.com
Market Recap for Monday, June 5, 2017
It wasn't a horrible day on Wall Street. After all, we've been in a strong advance since mid-May with the S&P 500 rising nearly 4% during that span. So a little bit of profit taking shouldn'...
READ MORE
MEMBERS ONLY
Using EMA Ribbons to Define Strong Trends - Gold Leaves the Gold Miners Behind
by Arthur Hill,
Chief Technical Strategist, TrendInvestorPro.com
.... IJR Mean-Reversion Trade Exit
.... Gold Rises without the Gold Miners
.... Regional Banks Continue to Struggle
.... Using an EMA Ribbon to Define the Trend (MA)
.... Three Failed Setups (NTAP, STX, BMY)
.... Hawaiian Holdings Bounces off Breakout
.... Bullish Setups for MLM and CSRA
.... A Bearish Setup for IRM ....
IJR Mean-Reversion Trade Exit...
READ MORE
MEMBERS ONLY
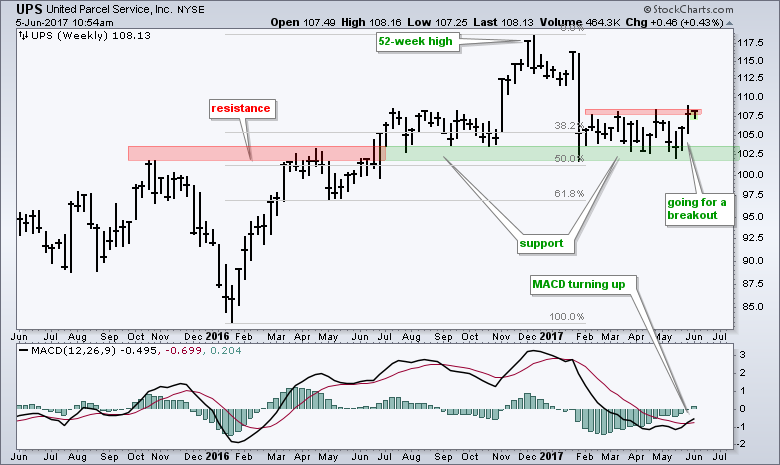
UPS Goes for a Breakout
by Arthur Hill,
Chief Technical Strategist, TrendInvestorPro.com
United Parcel Service (UPS) has been lagging the broader market this year, but may be turning around as it bounces off support and momentum turns up. UPS surged to a 52-week high in December and then retraced 50% with a sharp decline in January. The stock managed to firm near...
READ MORE
MEMBERS ONLY
Software And Semiconductors Lead Another Technology-Driven Rally
by Tom Bowley,
Chief Market Strategist, EarningsBeats.com
Market Recap for Friday, June 2, 2017
Technology (XLK, +0.92%) led U.S. equities higher on Friday and that's been the case for several months now. The XLK has been the best performing sector with a current SCTR (StockCharts Technical Rank) reading of 92 further validating that....
READ MORE
MEMBERS ONLY
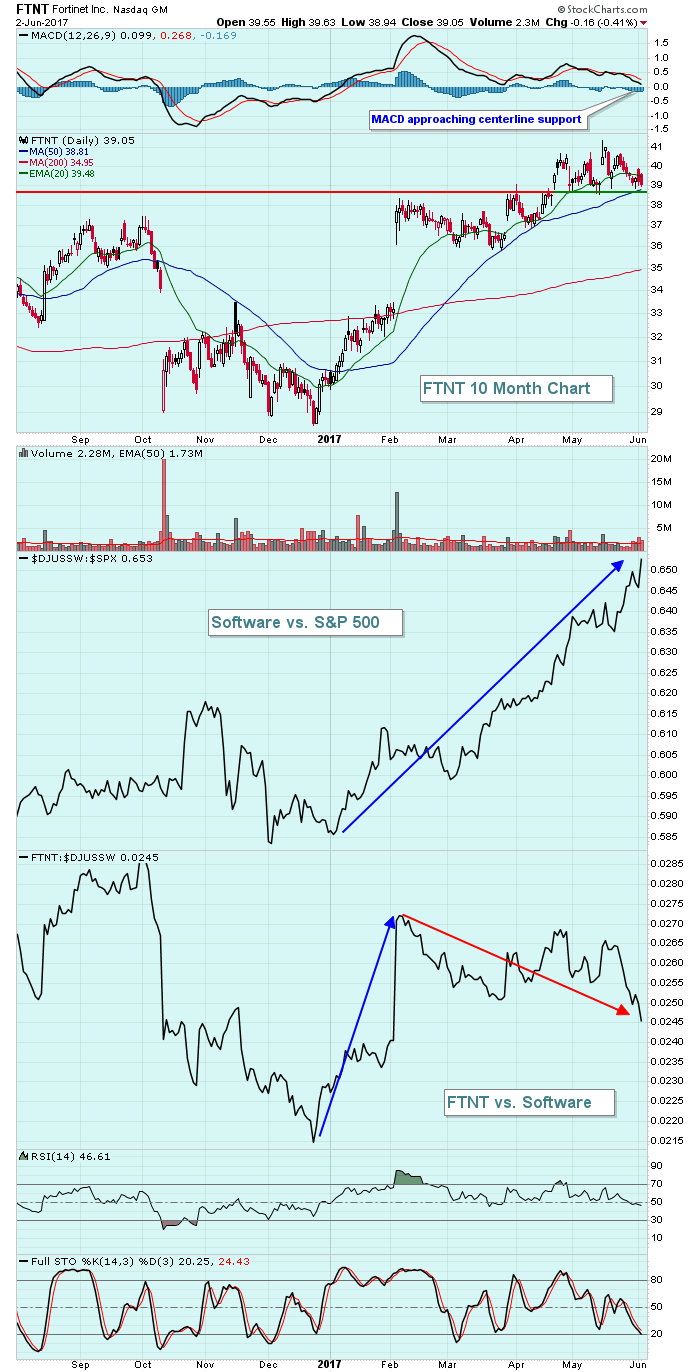
Fortinet In Strong Industry, Tests Gap And Price Support
by Tom Bowley,
Chief Market Strategist, EarningsBeats.com
Fortinet (FTNT) is down roughly 5% from its recent price high as money rotates within the software industry ($DJUSSW). It's up close to 30% year-to-date, however, so a little profit taking in the short-term is likely providing an opportunity. FTNT looks to be approaching and testing a key...
READ MORE
MEMBERS ONLY
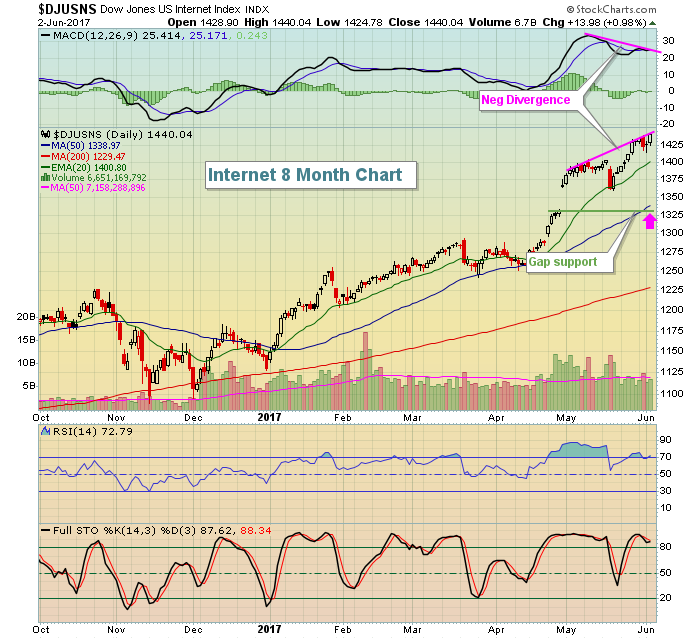
Internet Stocks Overbought Amid Slowing Momentum
by Tom Bowley,
Chief Market Strategist, EarningsBeats.com
Internet stocks ($DJUSNS) have climbed roughly 44% since their bottom in late June 2016. But there are now negative divergences appearing across various time frames and that suggests the summer time could be a period of consolidation, or even a correction. First, let's take a look at the...
READ MORE
MEMBERS ONLY
Finding New Opportunities in an Overbought Market

by John Hopkins,
President and Co-founder, EarningsBeats.com
The market has been on fire lately with all of the major indexes hitting all time highs. In spite of some recent weak economic reports, including a miss on Friday's jobs report, and in spite of all of the political "noise" swirling around, stocks have powered...
READ MORE
MEMBERS ONLY
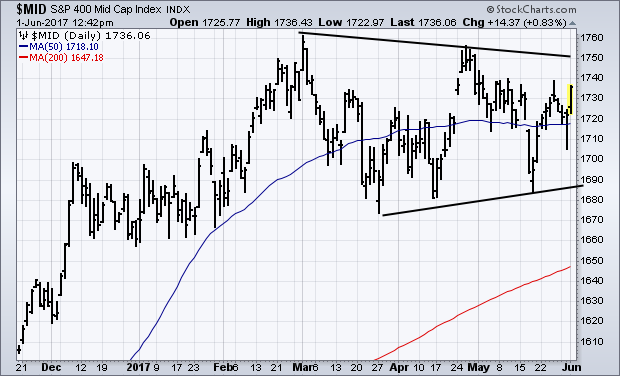
Midcaps May Show Truer Picture of US Stocks
by John Murphy,
Chief Technical Analyst, StockCharts.com
Several of my recent messages have focused on the divergence between large and small cap stocks. Wednesday's message suggested that part of that divergence was due to stronger foreign markets. Large cap multinationals do better when foreign markets are strong, which is the case at the moment. Small...
READ MORE
MEMBERS ONLY
DecisionPoint Weekly Wrap -- New Highs Climax
by Carl Swenlin,
President and Founder, DecisionPoint.com
Last week I wrote: ". . . our short- and intermediate-term indicators suggest that we will see a few more weeks of rally before another correction/consolidation." In the first two days of this short week price continued to consolidate the prior week's advance, and then the rally continued...
READ MORE
MEMBERS ONLY

Another Stupid Chart Trick
by Bruce Fraser,
Industry-leading "Wyckoffian"
Time for another ‘Stupid Chart Trick’ (click here for a prior chart trick). I have counted about one zillion (this might be a slight exaggeration, but barely) Point and Figure chart formations. As a consequence of this personal passion, I have devised some counting conventions that have proven to be...
READ MORE
MEMBERS ONLY

The Most Important Assumption in Trading
by Arthur Hill,
Chief Technical Strategist, TrendInvestorPro.com
Trading and investing are all about putting the odds in your favor, and chartists can increase their odds with one key assumption: the trend will remain in force until proven otherwise. Coming from the writings of Charles Dow, this assumption means a trend in motion is expected to stay in...
READ MORE
MEMBERS ONLY
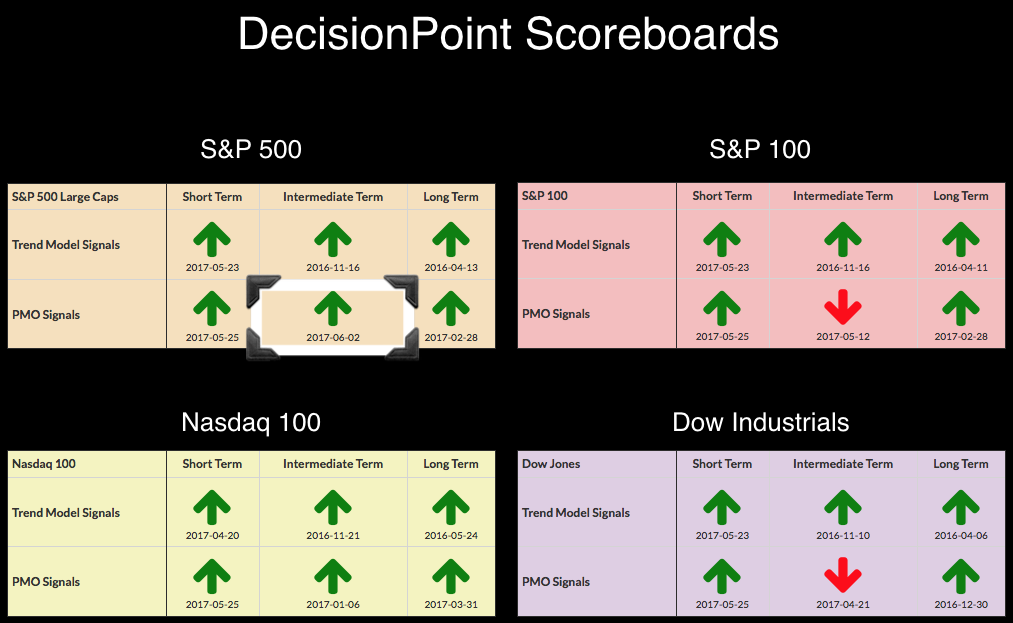
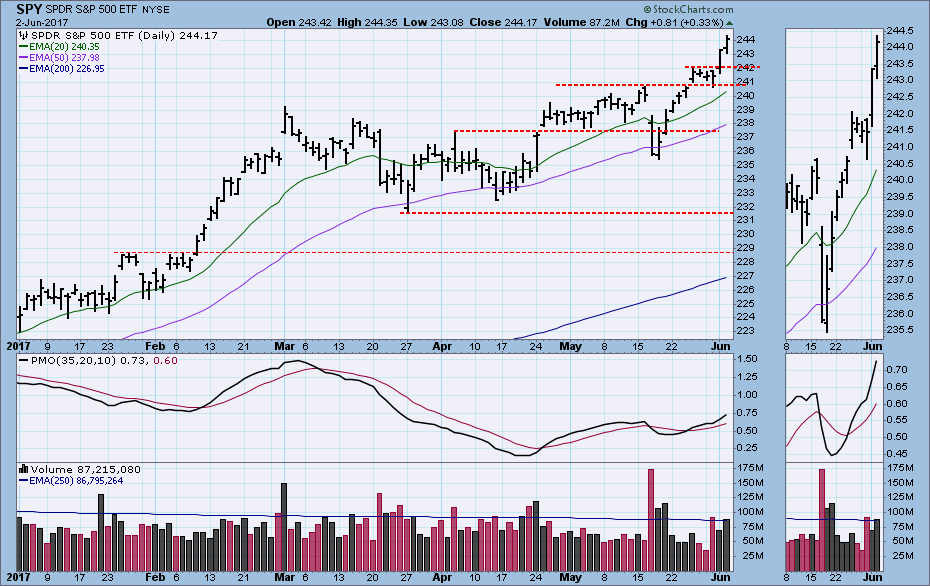
S&P 500 and SPY Trigger New Weekly PMO BUY Signals
by Erin Swenlin,
Vice President, DecisionPoint.com
The S&P 500 garnered a new PMO BUY signal on the weekly chart. Now we have two Scoreboards that are completely green. Technology has been a darling for quite some time so it is no surprise to see the oldest BUY signals residing on its Scoreboard. The two...
READ MORE
MEMBERS ONLY
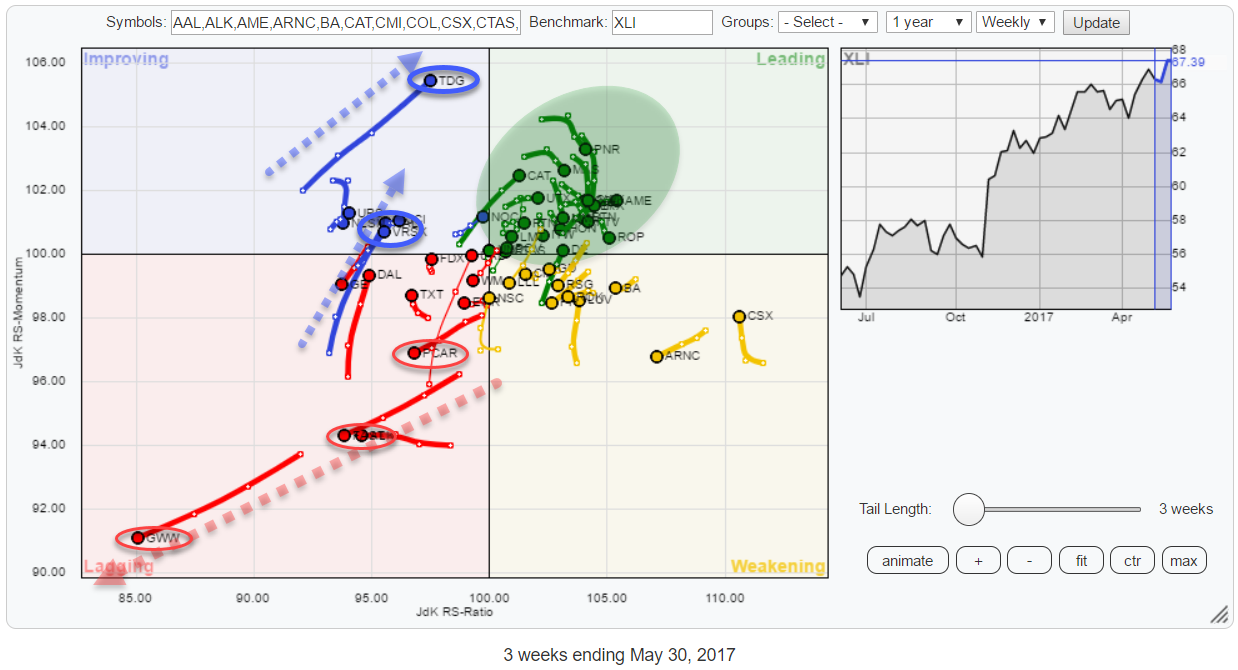
Are you looking at Industrial (XLI) stocks? ..Maybe you should.

by Julius de Kempenaer,
Senior Technical Analyst, StockCharts.com
This Relative Rotation Graph holds the top 50 (based on market cap) members of the S&P 500 Industrials sector index (XLI). This sector accounts for just over 10% of the S&P 500 market cap and is the fifth largest sector in this index. At the moment...
READ MORE
MEMBERS ONLY

Essential Rules to Share with Your Friends: The Financial Simpletons
by Gatis Roze,
Author, "Tensile Trading"
I had a shock recently. I met a couple who was in the midst of what I considered to be a personal financial coronary, yet they were totally oblivious to the perils facing them. Both husband and wife were professionals with advanced graduate degrees. Despite their intelligence and educations, neither...
READ MORE
MEMBERS ONLY
Market Round Up Video With Martin Pring 2017-06-02
by Martin Pring,
President, Pring Research
Here is the link to this months Market Round Up with Martin Pring for June 2017. Don't forget to use the HD button for better quality.
Market Round Up Live With Martin Pring 2017-06-02 from StockCharts.com on Vimeo.
Good luck and good trading,
Martin J. Pring...
READ MORE