MEMBERS ONLY

MAJOR STOCK INDEXES NEAR RECORD HIGHS -- NYSE COMPOSITE INDEX NEARS UPSIDE BREAKOUT -- SMALL CAPS TURN HIGHER -- CONSUMER DISCRETIONARY AND INDUSTRIAL ETFS ACHIEVE BULLISH BREAKOUTS -- INTEL AND SEMICONDUCTRS LEAD NASDAQ HIGHER

by John Murphy,
Chief Technical Analyst, StockCharts.com
MAJOR STOCK INDEXES NEAR NEW RECORDS... A strong job report on Friday helped push stocks close to record highs. Chart 1 shows the Dow Jones Industrial Average jumping 250 points (1.4%) on Friday to reach a two-month high. A test of its April high is imminent. The S&...
READ MORE
MEMBERS ONLY
Weekly Closing High for S&P 500 - QQQ Breaks Channel - New Highs Surge in Nasdaq 100 - Consumer Discretionary Comes Alive

by Arthur Hill,
Chief Technical Strategist, TrendInvestorPro.com
Bullish Resolution to an Already Bullish Chart // QQQ Breaks Channel Trend Line // New Highs Surge in Nasdaq 100 // Creating an Up-Down Pair Chart // Small-caps Come Alive // Consumer Discretionary Leads all Sectors // RCD Breaks June High //// .....
Bullish Resolution to an Already Bullish Chart
The stock market is up sharply over the...
READ MORE
MEMBERS ONLY

Investorship, like Citizenship, Must Have Parameters

by Gatis Roze,
Author, "Tensile Trading"
“Friends don’t let friends drink and drive.” We have all been exposed to this public service advertisement since it was first broadcast in 1983. This simple slogan has been embedded in our collective consciousness, and research has proven that its impact has saved thousands of lives. It really works....
READ MORE
MEMBERS ONLY

Gold Fever

by Bruce Fraser,
Industry-leading "Wyckoffian"
My grandfather and great grandfather were gold miners. They took their ‘grubstake’ to Alaska and the mountains of California. After many adventures they succeeded with a small working gold mine in Northern California. You should know this when reading this post as, by heredity; I may have a touch of...
READ MORE
MEMBERS ONLY
June Payrolls Explode Higher, Futures Jump

by Tom Bowley,
Chief Market Strategist, EarningsBeats.com
Market Recap for Thursday, July 7, 2016
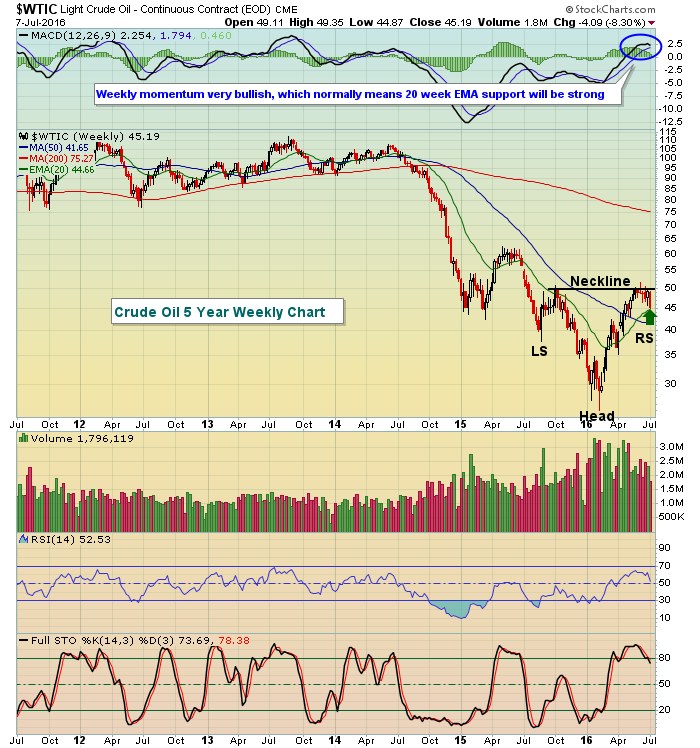
Energy (XLE, -1.02%) was weak on Thursday as crude oil prices ($WTIC) tumbled 5.64% to lose near-term price support in the 46.00-46.50 range. Crude oil also lost both 20 day EMA and 50 day SMA support, both of which...
READ MORE
MEMBERS ONLY

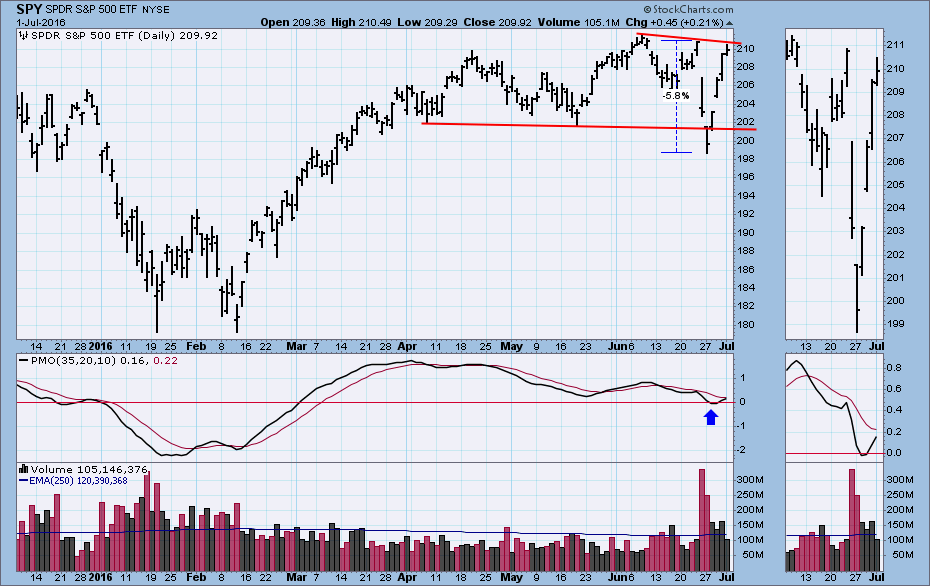
Pay Attention to Price Momentum Oscillator Ranges!

by Erin Swenlin,
Vice President, DecisionPoint.com
The Price Momentum Oscillator (PMO) is mostly bounded oscillator. The PMO can be calculated for any stock, index, ETF, etc. Interestingly, each of them have their own "normal" ranges. The PMO is particularly useful in determining overbought and oversold conditions, but you can many times be fooled as...
READ MORE
MEMBERS ONLY
UPS Delivers Better Relative Performance
by Tom Bowley,
Chief Market Strategist, EarningsBeats.com
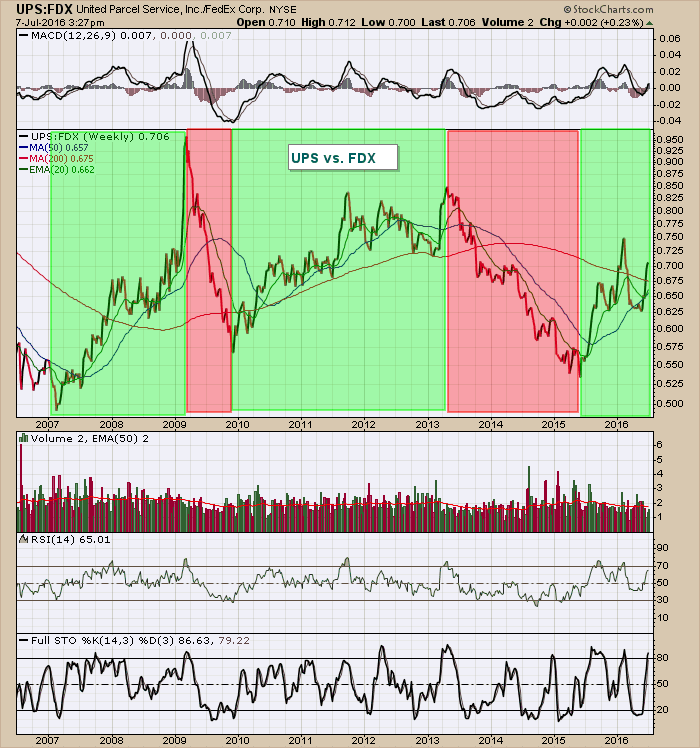
Over the past year, United Parcel Service (UPS) has gained 13.77% while FedEx Corporation (FDX) has lost 9.80%. Relative strength between these two air delivery and freight services companies has gone back and forth over the last decade, but currently UPS has the upper hand and is the...
READ MORE
MEMBERS ONLY

Why The June Employment Report Is Worth Closer Attention Than Usual

by Martin Pring,
President, Pring Research
* Labor market crystal ball
* What are the credit markets saying
* Commodities ripe for a correction?
Labor market crystal ball
The weakness of last month’s Employment Report was a surprise to just about everyone, including yours truly. One month doesn’t make a trend, but two months of bad data...
READ MORE
MEMBERS ONLY

TECHNICAL ODDS FAVOR HIGHER STOCK PRICES -- ON BALANCE VOLUME FOR NYSE INDEX HITS NEW HIGH FOR THE YEAR -- BOTH VERSIONS OF THE NYSE ADVANCE DECLINE LINE HIT NEW RECORDS
by John Murphy,
Chief Technical Analyst, StockCharts.com
UPSIDE BREAKOUT IN NYSE COMPOSITE INDEX STILL LOOKS LIKELY... My May 25 market message suggested that the stock market still had more work to do on the upside. That was based primarily on Elliott Wave Analysis which suggested that the market was still in a Wave 4 correction/consolidation pattern...
READ MORE
MEMBERS ONLY
Resiliency Vs. Rotation....The Struggle Is Real
by Tom Bowley,
Chief Market Strategist, EarningsBeats.com
Market Recap for Wednesday, July 6, 2016
Bulls do not give up easy. Yesterday was a perfect example. Global indices have rolled over and have been struggling mightily this week, especially the key German DAX ($DAX). Brexit fears seemed to be building once again and the S&P 500...
READ MORE
MEMBERS ONLY
QQQ and IWM Hold Gaps - Measuring the Sector Balance - Golden Crosses Dominant Sector SPDRs - Amazon and Home Depot Power Retail
by Arthur Hill,
Chief Technical Strategist, TrendInvestorPro.com
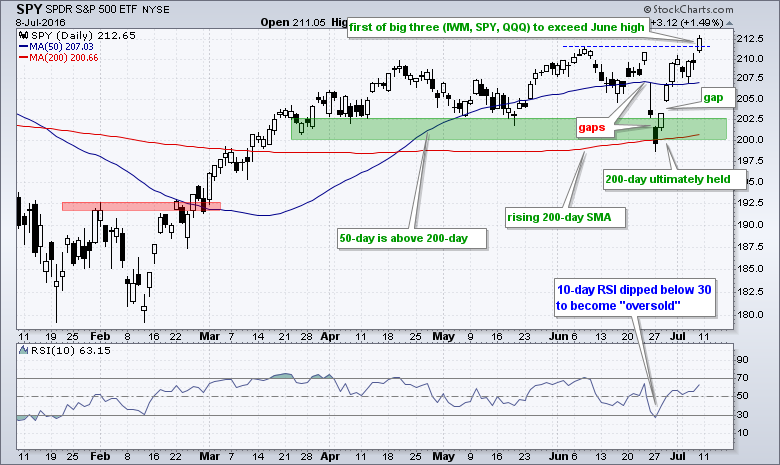
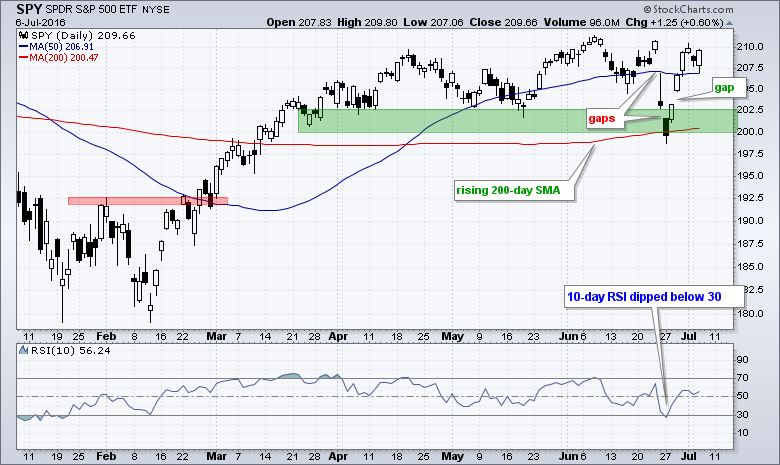
SPY Looks More Bullish than Bearish // QQQ and IWM Hold the Gaps // Measuring the Sector Balance in the S&P 500 // All Nine Sector SPDRs have Golden Crosses Working // Healthcare SPDR Clears Benchmark High // Overbought, Oversold and the Bigger Trend // Amazon and Home Depot Power MarketVectors Retail ETF // Retail...
READ MORE
MEMBERS ONLY

DOW AND S&P 500 BOUNCE OFF 50-DAY AVERAGES -- NASDAQ REGAINS 200-DAY LINE -- CELGENE AND MERCK LEAD HEALTHCARE SPDR TO HIGHEST LEVEL SINCE AUGUST -- HOMEBUILDERS LEAD CYLICALS HIGHER AS DR HORTON BREAKS OUT -- FACEBOOK HAS STRONG DAY
by John Murphy,
Chief Technical Analyst, StockCharts.com
MARKET HAS UPSIDE REVERSAL DAY ... After trading lower this morning, stocks rallied this afternoon to respectable gains. That upside reversal also helped the Dow Industrials and S&P 500 bounce off their 50-day moving averages as shown in Charts 1 and 2. Chart 3 shows the Nasdaq Composite Index...
READ MORE
MEMBERS ONLY
Overbought / Oversold

by Greg Morris,
Veteran Technical Analyst, Investor, and Author
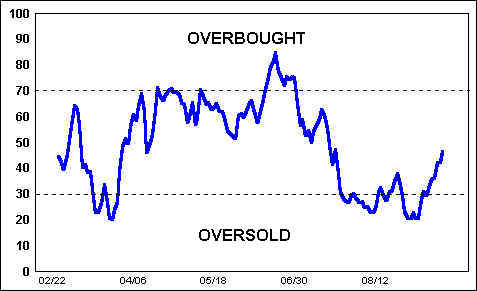
Overbought / Oversold – These terms have got to be the most over-used terms when talking about the markets. Overbought refers to the time in which the prices have risen to a level that seems as if they cannot go any higher. Oversold is the opposite, prices have dropped to a point...
READ MORE
MEMBERS ONLY
Russell 2000 Prints Bearish Right Shoulder
by Tom Bowley,
Chief Market Strategist, EarningsBeats.com
Market Recap for Tuesday, July 5, 2016
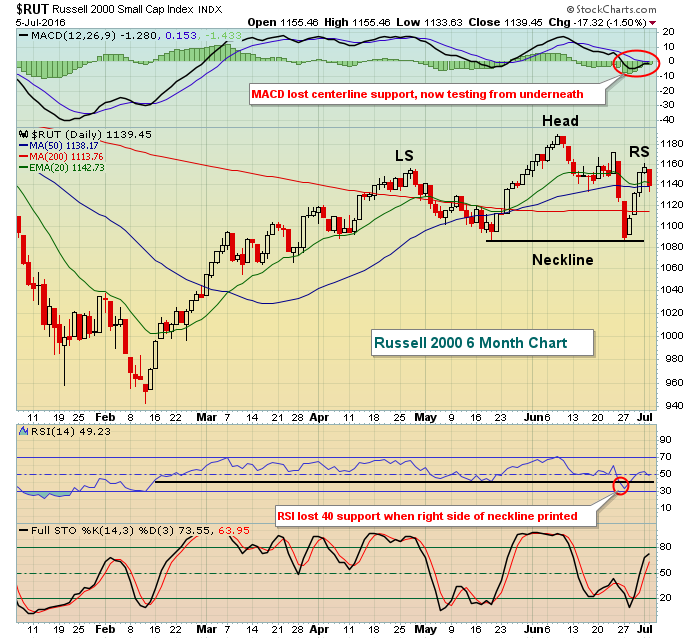
Tuesday represented a down day and a much-needed day of profit taking after the post-Brexit rebound, right? Well maybe. But if my pattern-seeking eyes are correct, the Russell 2000 may have just printed the right shoulder in a bearish topping head & shoulders...
READ MORE
MEMBERS ONLY
Verisk Analytics Leads with an Upside Breakout
by Arthur Hill,
Chief Technical Strategist, TrendInvestorPro.com
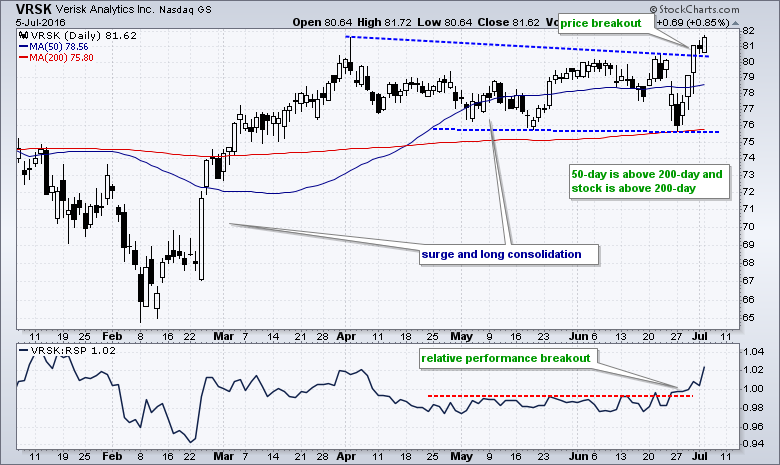
Verisk (VRSK) was not immune to the volatility of the last two weeks, but the stock held up well during the dip and outperformed during the bounce. First, notice that the stock ultimately held the mid May low and 200-day SMA during the late June dip. Second, notice that the...
READ MORE
MEMBERS ONLY
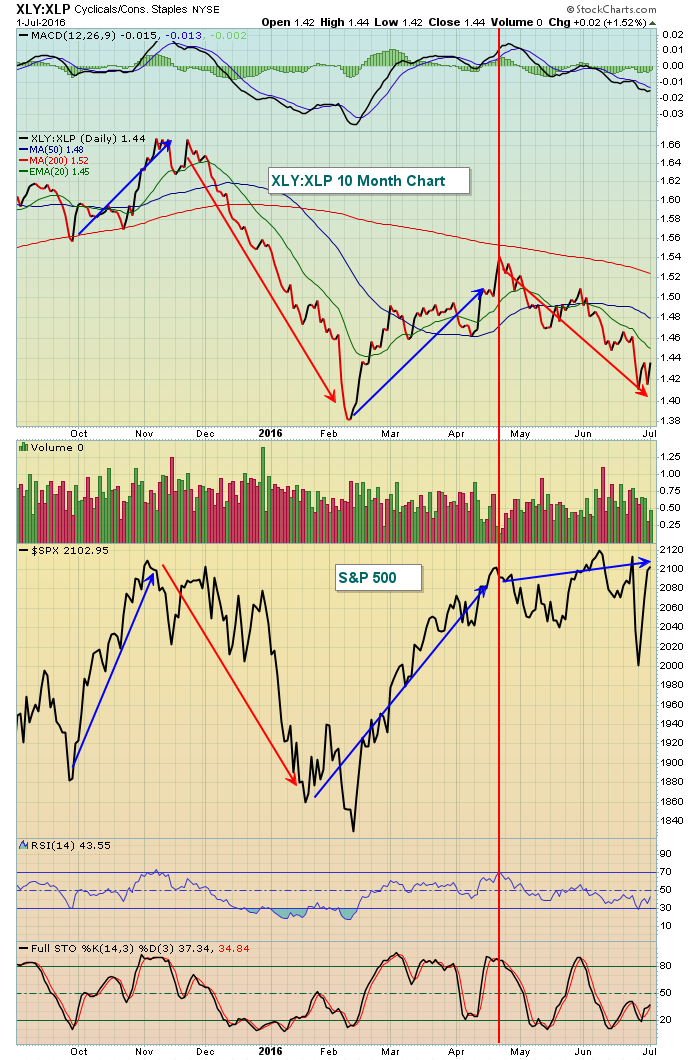
Watching the Swing within the Range - New High in Broad AD Line - Falling Yields Hurting Banks - Webinar Video
by Arthur Hill,
Chief Technical Strategist, TrendInvestorPro.com
Still Watching the Swing within Trading Range // Mid-caps Outperform Large-caps // Small-caps Hold Support Zone // Breadth Indicators Hit New Milestones // Bonds Extend Surge as Yields Fall // Falling Yields Weigh on Finance-related Groups // Break Down Holds for Finance SPDR // Webinar Preview //// .....
Still Watching the Swing within the Range
The S&P...
READ MORE
MEMBERS ONLY
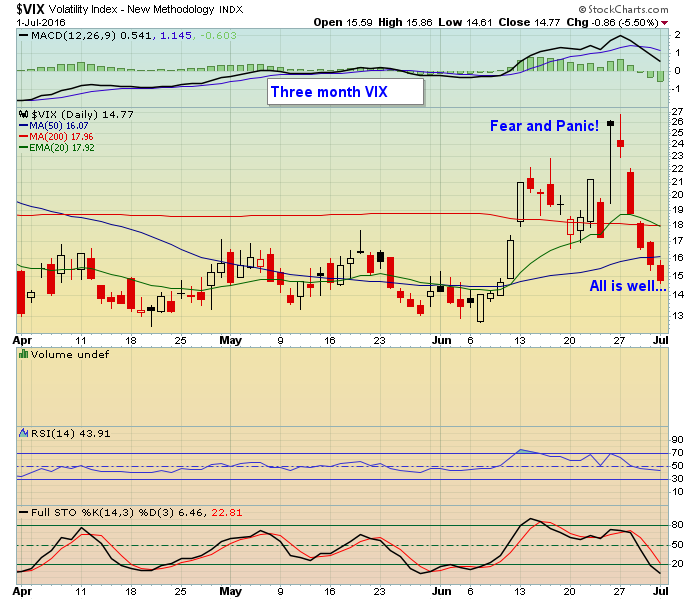
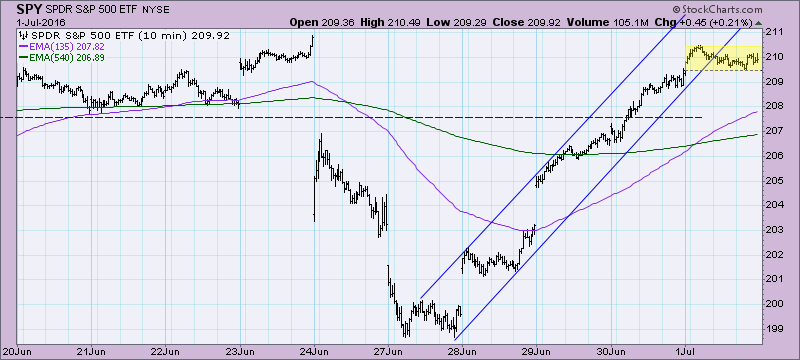
Volatility Tumbles Again On Friday
by Tom Bowley,
Chief Market Strategist, EarningsBeats.com
Market Recap for Friday, July 1, 2016
Bull markets do the unthinkable and last week was a perfect example. After Brexit, which seemed to confirm global stock markets' worst fear, we saw a very sudden drop in equity prices around the world and a surge in the Volatility Index...
READ MORE
MEMBERS ONLY
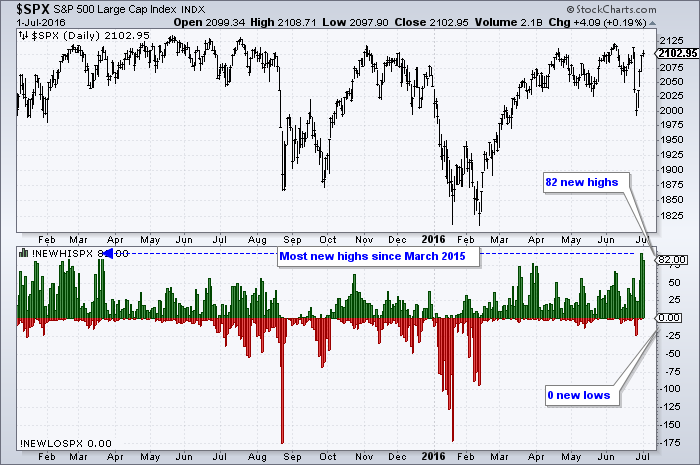
New High Surge Shows Broadening Participation
by Arthur Hill,
Chief Technical Strategist, TrendInvestorPro.com
The S&P 500 surged over the last four days and new highs in the S&P 500 expanded to their highest level since March 2015. The chart below shows $SPX surging around 5% in four days and new highs exceeding 80 the last two days. Even though...
READ MORE
MEMBERS ONLY
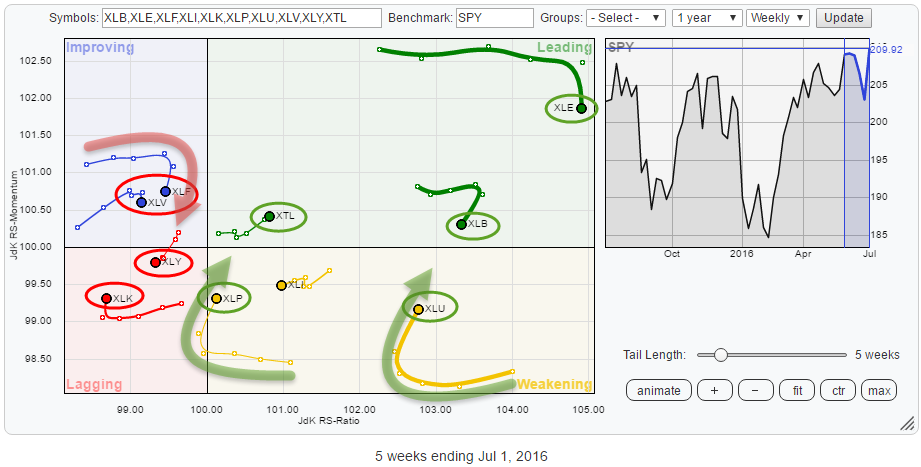
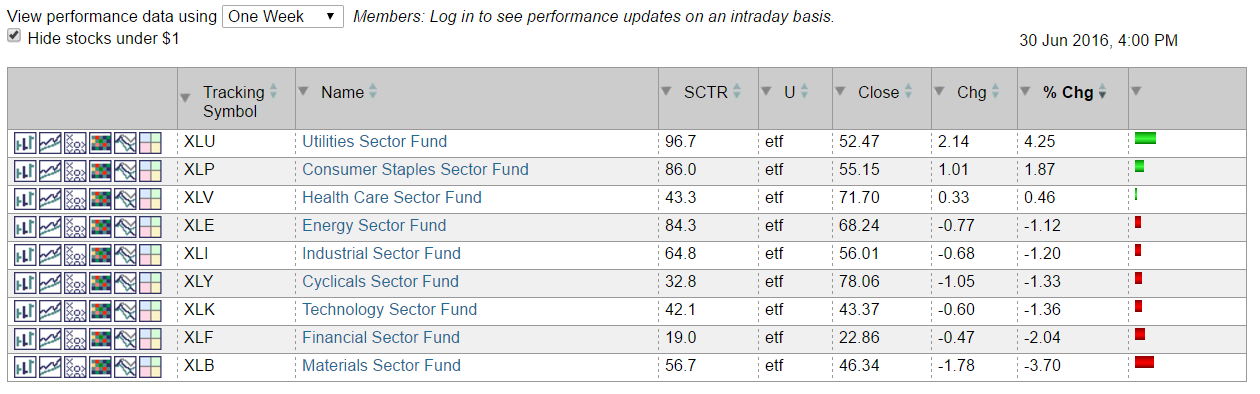
Staples and Utilities in the lead, what does that tell you?

by Julius de Kempenaer,
Senior Technical Analyst, StockCharts.com
Over the past few weeks markets, in general, experienced a lot of volatility and a lot of comments have are focussing on the general state and direction of the broader market indices around the world. In my last blog about US sector rotation, the conclusion was that the relative rotation...
READ MORE
MEMBERS ONLY
Market Condition After You-Know-What

by Carl Swenlin,
President and Founder, DecisionPoint.com
On the Friday ahead of the Brexit vote I made an assessment of the market condition and speculated as to what affect it might have on market action the next week. My conclusion was that the technicals were negative and would tend to weigh on the market regardless of direction....
READ MORE
MEMBERS ONLY
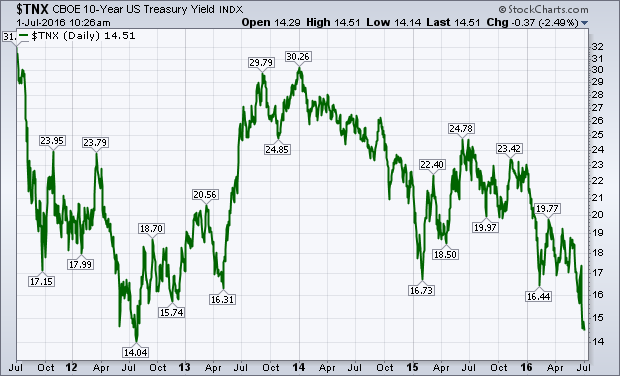
Treasury Yield Falls to Four-Year Low, Lower Mortgage Rates are Boosting Homebuilders
by John Murphy,
Chief Technical Analyst, StockCharts.com
The plunge in global bond yields continues. Yesterday's statement from the Bank of England of its intention to lower rates sometime this summer pushed the British 2-year yield into negative territory for the first time, and its 10-Year to another record low further below 1%. Treasury yields continue...
READ MORE
MEMBERS ONLY
Bizarre to the Max

by John Hopkins,
President and Co-founder, EarningsBeats.com
Exactly how bizarre has the market action been over the last six trading days? Let me count the ways.
First, the British voted to leave the European Union which put the market in a tailspin with the S&P losing almost 6% in just two days. But by Friday&...
READ MORE
MEMBERS ONLY
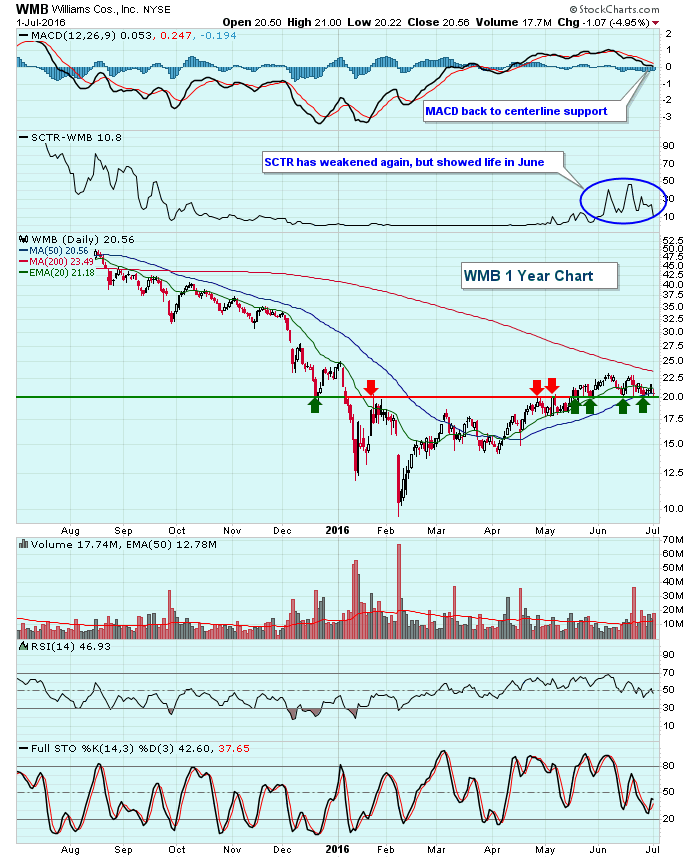
This Energy Stock May Not Be A Pipe Dream
by Tom Bowley,
Chief Market Strategist, EarningsBeats.com
Over the past six months, the Dow Jones U.S. Pipelines Index ($DJUSPL) has gained 25.03% and has been among the best performing industry groups. But it hasn't been favorable for all pipeline stocks as Williams Companies (WMB) can attest. While its peers have risen 25%, WMB...
READ MORE
MEMBERS ONLY
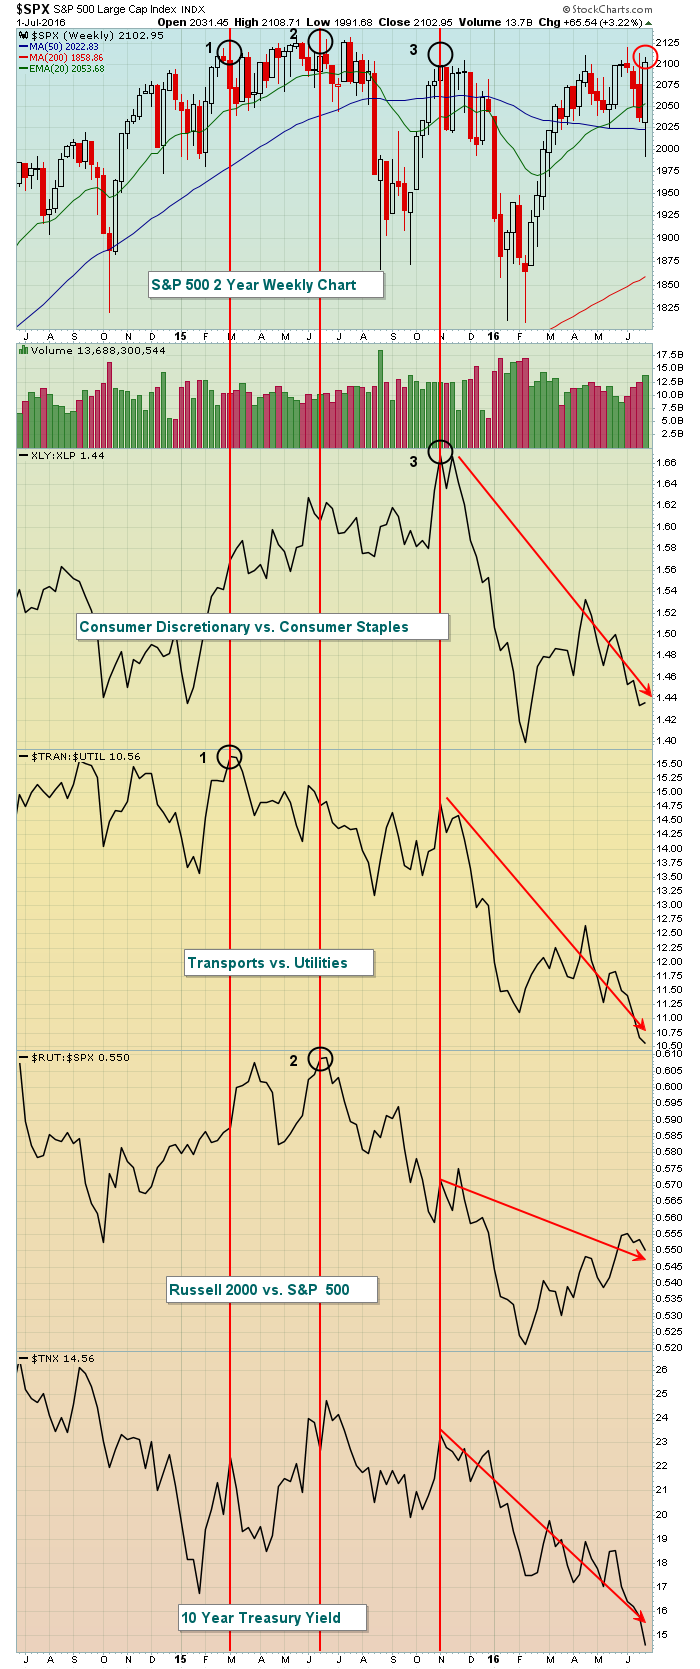
Rotation Is Painting A Very Bearish Picture
by Tom Bowley,
Chief Market Strategist, EarningsBeats.com
Here we go again.
It seems as though every time the S&P 500 challenges the 2100 level and its all-time high close (2131), another aggressive area of the market falls apart and the rally is not sustainable. Below is a two year weekly chart of the S&...
READ MORE
MEMBERS ONLY
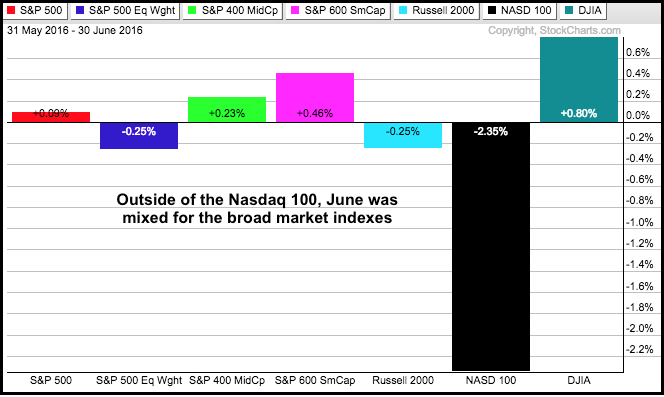
A Clear Trend and Pattern Emerge on Monthly S&P 500 Chart
by Arthur Hill,
Chief Technical Strategist, TrendInvestorPro.com
Chartists will look back at the long-term charts and try to figure out where exactly this big Brexit panic actually occurred. Was there even such an event? There is something to be said for monthly close-only charts because they filter a lot of noise, and June was definitely a month...
READ MORE
MEMBERS ONLY
Market Looking Toppy - Short-Term Indicators Confirm
by Erin Swenlin,
Vice President, DecisionPoint.com
There is no denying it, the market experienced an amazing rally this past week after the waterfall correction initiated by Brexit. Now prices are where they were before the landmark vote. The question is whether this rally will persist now that price is reaching strong overhead resistance once again.
Looking...
READ MORE
MEMBERS ONLY

Stupid Chart Tricks
by Bruce Fraser,
Industry-leading "Wyckoffian"
Stupid Chart Tricks are obscure rules of thumb in chart analysis that are helpful in your trading. These tricks are actually not stupid, they are clever and useful and generally unknown. Over the years we pick up these tips and tricks and incorporate them into daily chart analysis. We use...
READ MORE
MEMBERS ONLY

The Single Most Important Lesson I've Learned Trading the Markets for 25 Years
by Gatis Roze,
Author, "Tensile Trading"
My Thesaurus lists the same two words – enhance and augment – as synonyms for both words “improve” and “more”. The mantra of today’s global society could indeed be “improve and more” with all the corresponding complexity that it brings with it.
I merely have to look in my garage at...
READ MORE
MEMBERS ONLY

TREASURY YIELD FALLS TO FOUR-YEAR LOW -- LOWER MORTGAGE RATES ARE BOOSTING HOMEBUILDERS -- HOME CONSTRUCTION ETF NEARS UPSIDE BREAKOUT -- KBH HAS ALREADY BROKEN OUT -- OIL SERVICE ETF CONTINUES TO SHOW LEADERSHIP -- TRANSOCEAN CLEARS 200-DAY LINE
by John Murphy,
Chief Technical Analyst, StockCharts.com
10-YEAR TREASURY YIELD TESTING 2012 LOW... The plunge in global bond yields continues. Yesterday's statement from the Bank of England of its intention to lower rates sometime this summer pushed the British 2-year yield into negative territory for the first time, and its 10-Year to another record low...
READ MORE
MEMBERS ONLY
Key Relative Ratio Not Supporting This Rally
by Tom Bowley,
Chief Market Strategist, EarningsBeats.com
Market Recap for Thursday, June 30, 2016
Over the past week - since Brexit - the S&P 500 has lost a mere 15 points because of the sizable rally enjoyed over the past three trading days. That's roughly a 0.75% loss. The NASDAQ, on the...
READ MORE
MEMBERS ONLY

SystemTrader - Testing a Basic Mean Reversion System - Catch the Knife or Wait for the Bounce? - Take Quick Profits or Wait for Counter Signal?
by Arthur Hill,
Chief Technical Strategist, TrendInvestorPro.com
SystemTrader // Testing a Basic Mean-Reversion System // Tweaking RSI for Sensitivity // Setting the Ground Rules // Mean Reversion Scan Code // Buy the Falling Knife // Buy after the Bounce // And the Best System Is.... // A Portfolio with No Exceptions // Would You have the Guts? // Further Study //// ........
Testing a Basic Mean Reverions System
Today...
READ MORE
MEMBERS ONLY
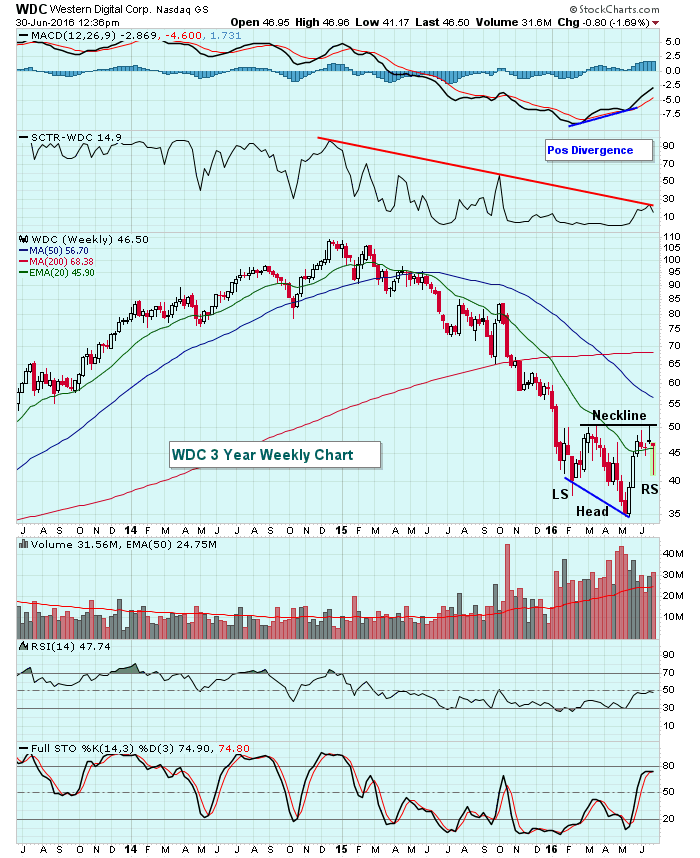
Is This Data Storage Company Ready For A Breakout?
by Tom Bowley,
Chief Market Strategist, EarningsBeats.com
There's a potential bottoming reverse head & shoulders pattern in play on Western Digital's (WDC) three year weekly chart as it attempts to clear its downtrend on its SCTR. All of this comes on the heels of printing a positive divergence on its MACD. This alone...
READ MORE
MEMBERS ONLY
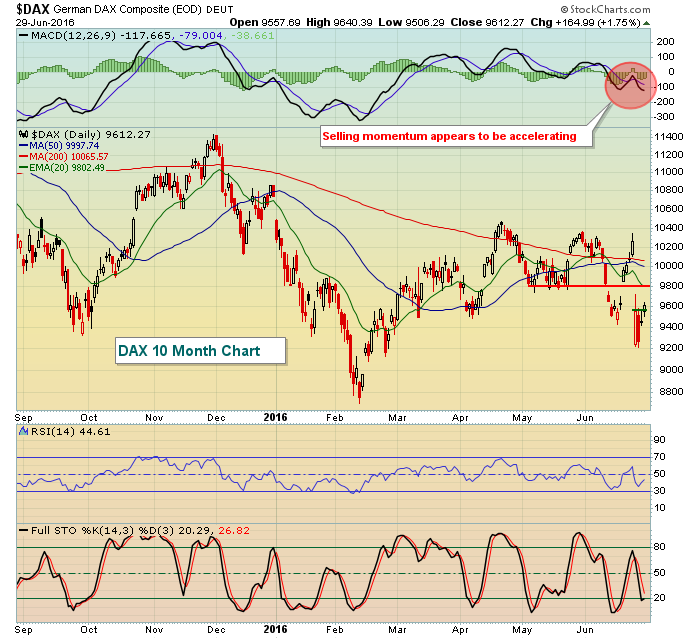
Rally Is Strong, But Can The S&P 500 Clear This Level?
by Tom Bowley,
Chief Market Strategist, EarningsBeats.com
Market Recap for Wednesday, June 29, 2016
U.S. equities rallied strongly on Wednesday, following the lead of global indices as the shock of Brexit begins to wear off. The German DAX ($DAX) was able to close at its highest level since Brexit, clearing the 9557 close the day after...
READ MORE
MEMBERS ONLY
SPX Holds Key Level - A Little Smoothing Can Go a Long Way - IWM Forms Island Reversal - Three Biotechs to Watch
by Arthur Hill,
Chief Technical Strategist, TrendInvestorPro.com
S&P 500 Affirms Uptrend with Big Bounce // Short-term Smoothing Improves Returns and Reduces Drawdowns // QQQ leads Recover as IWM Forms Island Reversal // HealthCare SPDR Shows Some Resilience // EW Technology Holds May Low // Five Stocks to Watch: ORCL, CMCSA, ABBV, CERN and ZTS //// .....
S&P 500 Affirms Uptrend...
READ MORE
MEMBERS ONLY

ALL COUNTRY WORLD INDEX REGAINS 200-DAY LINE -- EMERGING MARKETS LEAD GLOBAL REBOUND -- BRAZIL AND CHINESE ETFS STRENGTHEN -- ENERGY AND HEALTHCARE SPDRS CLEAR 50-DAY LINES -- OTHER SECTOR ETFS TURN BACK UP -- S&P 500 RETAKES 200-DAY LINE
by John Murphy,
Chief Technical Analyst, StockCharts.com
MSCI ALL COUNTRY WORLD INDEX BACK OVER 200-DAY AVERAGE... Investor confidence is returning to global stocks after the short-term panic caused by last Friday's Brexit vote. Improvement is being seen in both developed and emerging markets. Chart 1 shows the MSCI All Country World Index (ACWI) climbing back...
READ MORE
MEMBERS ONLY
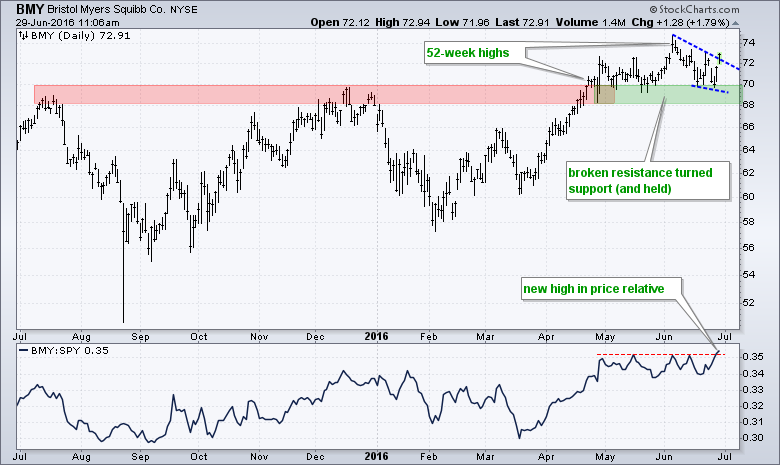
Bristol Meyers Leads as Price Relative Hits New High
by Arthur Hill,
Chief Technical Strategist, TrendInvestorPro.com
Chartists need just two plots to find leaders and stocks in uptrends: price and the price relative. Price, of course, can be a line chart, bar chart or candlestick chart. Stocks hitting 52-week highs are in clear uptrends and often leading the market. Bristol Meyers is one such stock because...
READ MORE
MEMBERS ONLY

WHY I Have Faith in Technical Analysis
by Greg Morris,
Veteran Technical Analyst, Investor, and Author
There are many reasons I use technical analysis instead of some of the other analysis methods, but more importantly I have faith in it. Read on!
The other popular discipline is called fundamental analysis. This method of investing is essentially based upon fundamental ratios or as they are often called...
READ MORE
MEMBERS ONLY
Banks And Oil Rally To Lead U.S. Market Rebound
by Tom Bowley,
Chief Market Strategist, EarningsBeats.com
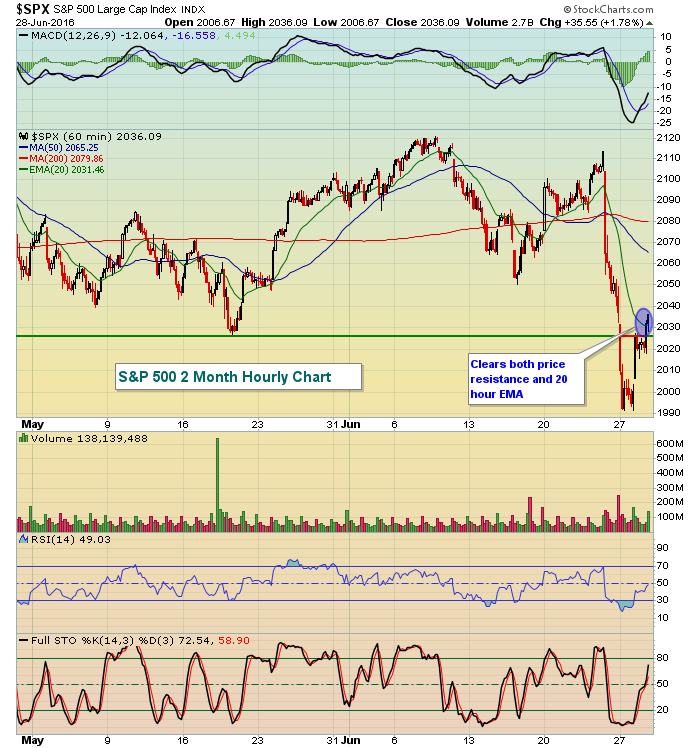
Market Recap for Tuesday, June 28, 2016
Much technical damage has been inflicted over the past few trading days. So the obvious question is "how long might this current rally last?" We cleared the first technical hurdle when the S&P 500 yesterday closed back above 2025...
READ MORE
MEMBERS ONLY
On Balance Volume Indicator Suite - SPY v. NDX
by Erin Swenlin,
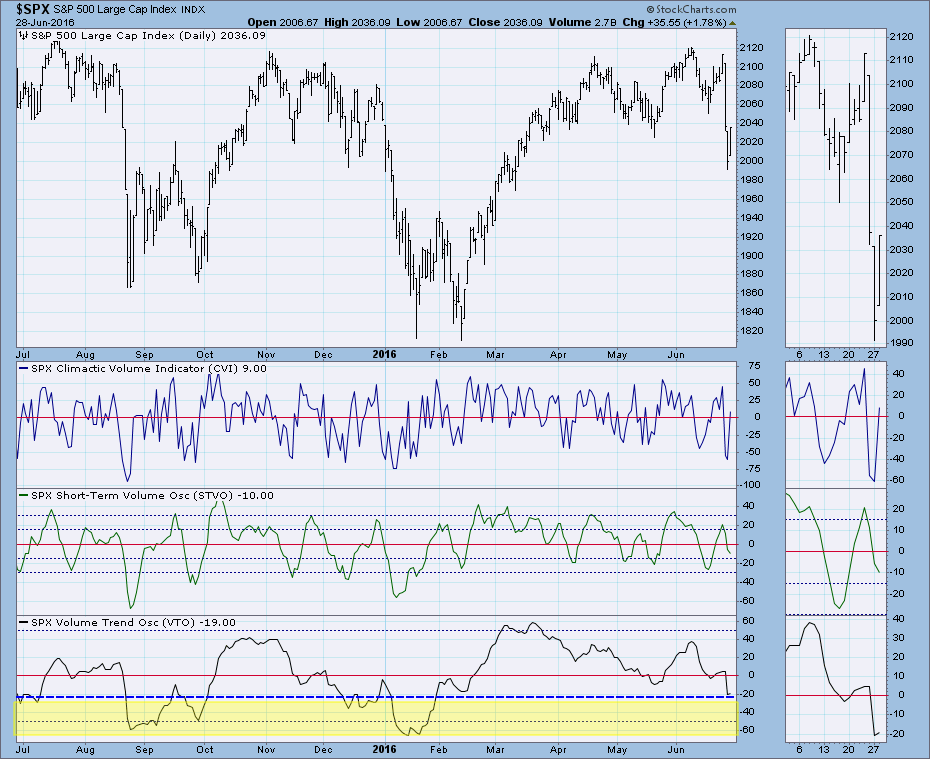
Vice President, DecisionPoint.com
The free DecisionPoint Market Indicator (DPMI) ChartPack includes numerous indicator sets for major indexes and sectors. Today I'm concentrating on the On Balance Volume indicator set which is made up of the Climactic Volume Indicator (CVI), Short-Term Volume Oscillator (STVO) and the Volume Trend Oscillator (VTO). Generally, I...
READ MORE
MEMBERS ONLY

EUROPEAN MARKETS LEAD STOCK BOUNCE -- EUROPEAN STOCK INDEX TESTS FEBRUARY LOW -- YIELD ON BRITISH BOND FALLS BELOW 1% -- 10 YEAR TREASURY YIELD MAY TEST 2012 BOTTOM -- EURO DROP IS ALSO BOOSTING DOLLAR
by John Murphy,
Chief Technical Analyst, StockCharts.com
EUROPEAN STOCKS LEAD GLOBAL BOUNCE ... A rebound in European stocks is leading a rebound in the states. Chart 1 shows the Dow Jones Europe Ex UK Index climbing 2.5%. France and Germany are up a similar amount. What may be significant from a charting standpoint is that the index...
READ MORE