MEMBERS ONLY

A Through Z of Investing: The Essentials

by Gatis Roze,
Author, "Tensile Trading"
Fair warning: everyone has some comments to offer when you write an investment book. And they do.
For 25 years now, I’ve operated under the caveat: “if it ain’t broken, don’t try to fix it.” As a former entrepreneur, my customers reviewed my performance daily. As an...
READ MORE
MEMBERS ONLY
Defense Leads Thursday Rally

by Tom Bowley,
Chief Market Strategist, EarningsBeats.com
Market Recap for Thursday, June 16, 2016
Okay, this really is getting old. Early in the session, it appeared as if the U.S. would follow the lead of global markets and sell....and sell....and sell. Volatility ($VIX) hit an intraday high of nearly 23, its highest level since...
READ MORE
MEMBERS ONLY
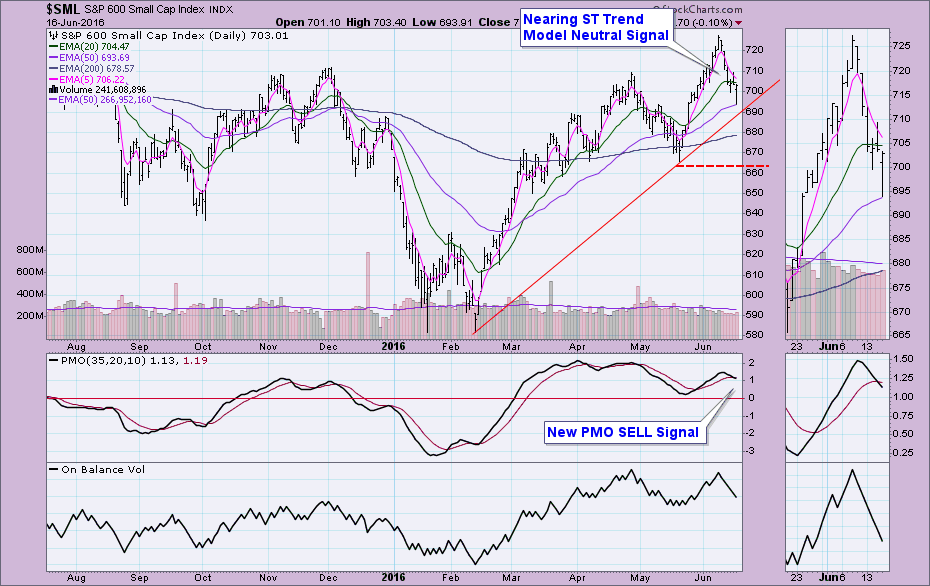
PMO SELL Signal Triggers on S&P 600 ($SML)

by Erin Swenlin,
Vice President, DecisionPoint.com
We saw on Tuesday four new Price Momentum Oscillator (PMO) SELL signals on the DecisionPoint Scoreboards which I wrote about in Tuesday's article. It isn't surprising to see Small Caps share a similar fate.
I've annotated the new PMO SELL signal on the daily...
READ MORE
MEMBERS ONLY

FOREIGN STOCKS LEAD US STOCKS LOWER -- EUROPE ETFS TUMBLE -- TEN-YEAR TREASURY YIELD FALLS TO FOUR-YEAR LOW -- FALLING FOREIGN CURRENCIES BOOST DOLLAR -- BOUNCING DOLLAR HURTS OIL, WHILE FALLING YIELDS BOOST GOLD -- BANK STOCKS LEAD U.S. STOCKS LOWER

by John Murphy,
Chief Technical Analyst, StockCharts.com
FOREIGN SHARES TUMBLE... Foreign shares continue to fall sharply and are pulling U.S. shares lower. The biggest drops are being seen in developed markets. Chart 1 shows MSCI iShares (EFA) falling to the lowest level in early three months. The biggest losses are being seen in Europe and Japan....
READ MORE
MEMBERS ONLY
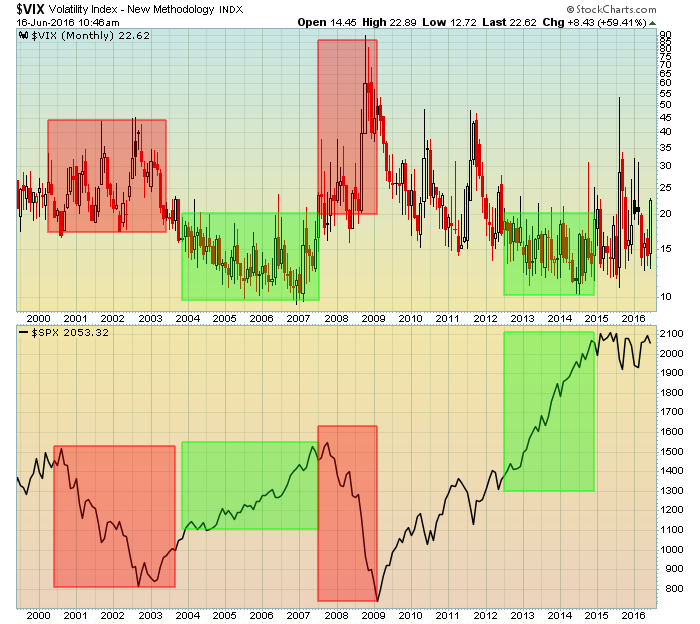
VIX Over 20 Can Be A Huge Problem
by Tom Bowley,
Chief Market Strategist, EarningsBeats.com
The Volatility Index ($VIX) is often times referred to as the fear index and fear is a necessary component of bear markets. So the recent surge in the VIX should not be taken lightly. We can and do see the VIX spike quickly during bull markets - only to settle...
READ MORE
MEMBERS ONLY
Fed Leaves Rates Unchanged, Equities Drop
by Tom Bowley,
Chief Market Strategist, EarningsBeats.com
Market Recap for Wednesday, June 16, 2016
The much-awaited FOMC policy statement was released at 2pm EST on Wednesday afternoon and the market collectively yawned for an hour before selling kicked in during the final hour. Beneficiaries on the session included basic materials (XLB, +0.45%) and the defensive REITs...
READ MORE
MEMBERS ONLY
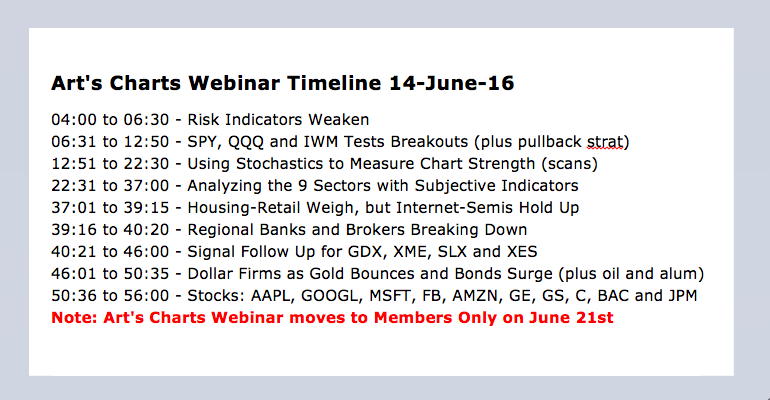
Using Vortex with SPY - Finance Weighs - Wild Ride in Tech ETFs - Aluminum ETF Surges to High of Year

by Arthur Hill,
Chief Technical Strategist, TrendInvestorPro.com
Finance Sector Weighs on Broader Market // Using Vortex Indicators with SPY // QQQ Lags with Lower High // A Choppy Advance for IWM // 5-yr Yield hits 2016 Low // Oil Falls within Rising Channel // New High, New Low and Back Again // Large-cap Techs Weigh on XLK // Aluminum Surges to High of the Year...
READ MORE
MEMBERS ONLY

WHY Price is so Important

by Greg Morris,
Veteran Technical Analyst, Investor, and Author
I often hear technical analysts performing their craft on economic data, derivative data such as the AD line, and a host of other data sets that do not trade. Why would you do that? The most basic premise of technical analysis is PRICE, the price that is determined in the...
READ MORE
MEMBERS ONLY
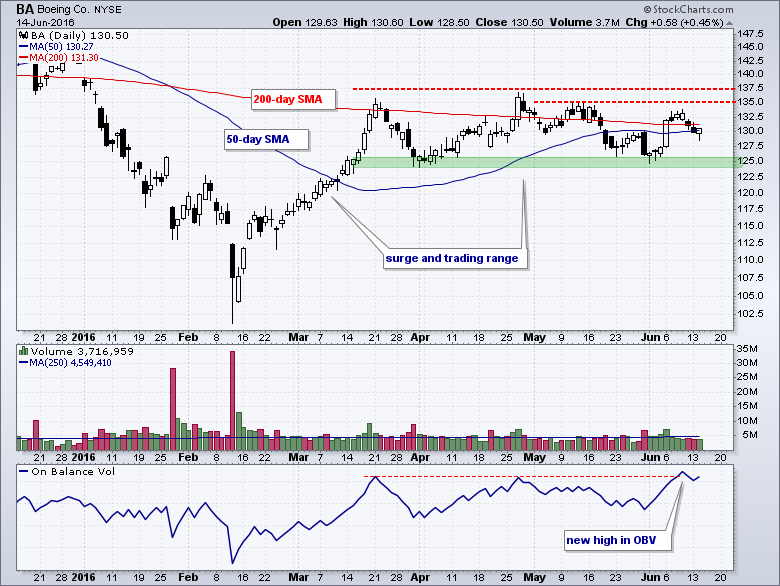
Key Moving Averages Converge as Boeing shows Signs of Accumulation
by Arthur Hill,
Chief Technical Strategist, TrendInvestorPro.com
Boeing has been stuck in a trading range since late March and signs of accumulation suggest an upside breakout. On the price chart, notice that BA surged from the 102 area to 135 from mid February to mid March. The stock was certainly entitled to a consolidation after a 30+...
READ MORE
MEMBERS ONLY
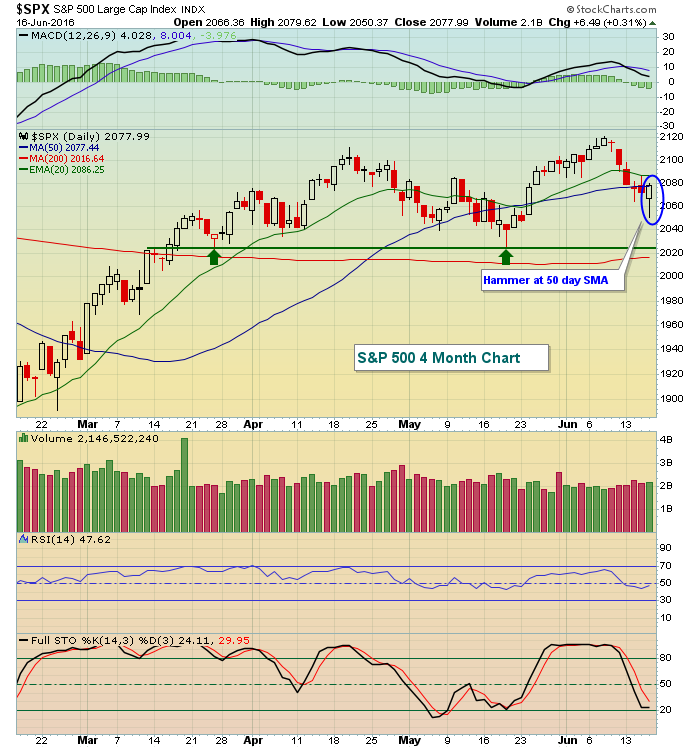
Watch These Key Support Levels
by Tom Bowley,
Chief Market Strategist, EarningsBeats.com
Market Recap for Tuesday, June 14, 2016
It was more of the same on Tuesday. Most of the selling took place in the first hour and then our major indices rallied. The problem, once again, was that leadership came in the form of utilities (XLU, +0.53%) and consumer staples...
READ MORE
MEMBERS ONLY

Decline Shakes Up the DP Scoreboards
by Erin Swenlin,
Vice President, DecisionPoint.com
Nearly all of the short-term BUY signals on the DecisionPoint Scoreboards (found in the DP Chart Gallery) were lost today. It is a result of the rather steep decline yanking 5-EMAs and Price Momentum Oscillators (PMOs) downward. However, they have arrived just as the indexes have landed close to support...
READ MORE
MEMBERS ONLY
VIX Soars, More Losses Likely
by Tom Bowley,
Chief Market Strategist, EarningsBeats.com
Market Recap for Monday, June 13, 2016
It was not a good day for the bulls. Global markets were weak and that set the stage for selling here in the U.S. Losses were fairly contained throughout the early part of the day, but the final hour saw the losses...
READ MORE
MEMBERS ONLY
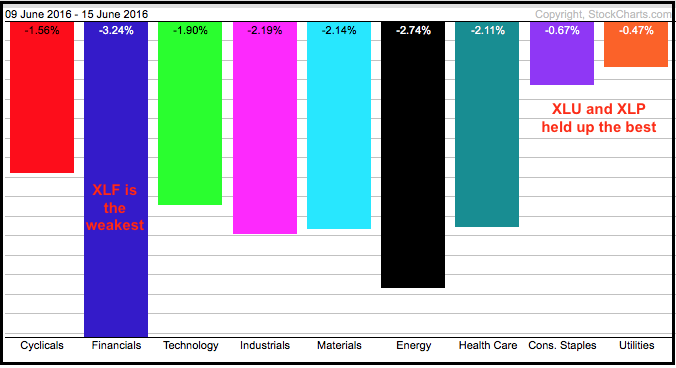
Weight of the Evidence Says? - Ranking the 9 Sectors - Using Stochastics to Evaluate Price Action
by Arthur Hill,
Chief Technical Strategist, TrendInvestorPro.com
A Weight of the Evidence Approach // Consumer Discretionary Remains the Weakest Link // Finance Sector Struggles // Technology Does the Splits // Staples and Utilities Lead with New Highs // Ranking the Nine Sectors // Evaluating Price Action with the Stochastic Oscillator // Webinar Preview //// .....
A Weight of the Evidence Approach
I will break down the...
READ MORE
MEMBERS ONLY
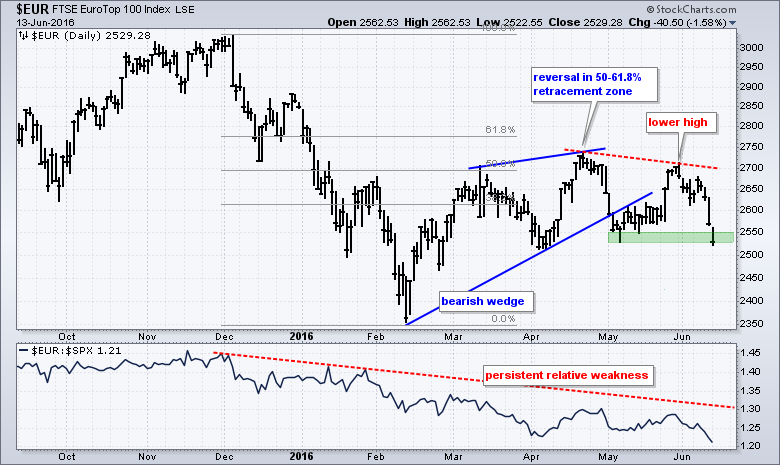
Eurotop 100 Breaks Key Levels and Leads Lower
by Arthur Hill,
Chief Technical Strategist, TrendInvestorPro.com
Large-caps in Europe continue to underperform large-caps in the US and the EuroTop 100 ($EUR) is breaking down on the price chart. First, the price chart shows $EUR falling sharply from December to mid February and then recovering 50-61.8% of this decline with a bounce back to the 2700-2750...
READ MORE
MEMBERS ONLY
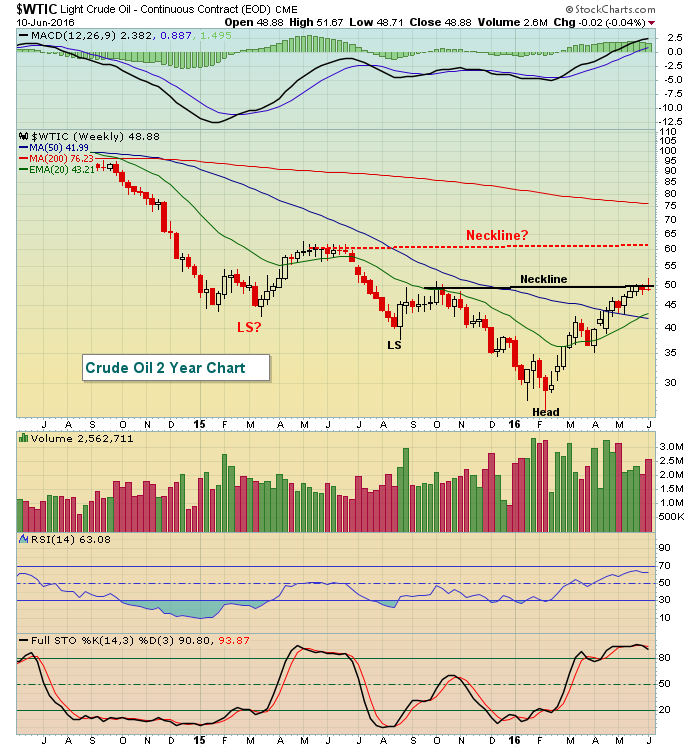
Crude Oil Reversal Last Week Troubling For XLE
by Tom Bowley,
Chief Market Strategist, EarningsBeats.com
Market Recap for Friday, June 10, 2016
Consumer staples (XLP, +0.07%) eked out a tiny gain on Friday, but otherwise sector performance was weak. The eight remaining sectors all finished in the red with energy (XLE, -2.16%) leading the pack. The weekly candle on crude oil prices ($WTIC)...
READ MORE
MEMBERS ONLY

How to show "currency rotation" on a Relative Rotation Graph.

by Julius de Kempenaer,
Senior Technical Analyst, StockCharts.com
Currencies or Forex are a strange beast in financial markets. The FX market is the biggest in the world with trillions of dollars (worth) traded around the clock but no central marketplace. There is no such thing as the 'New York Currency Exchange' or the 'European Currency...
READ MORE
MEMBERS ONLY
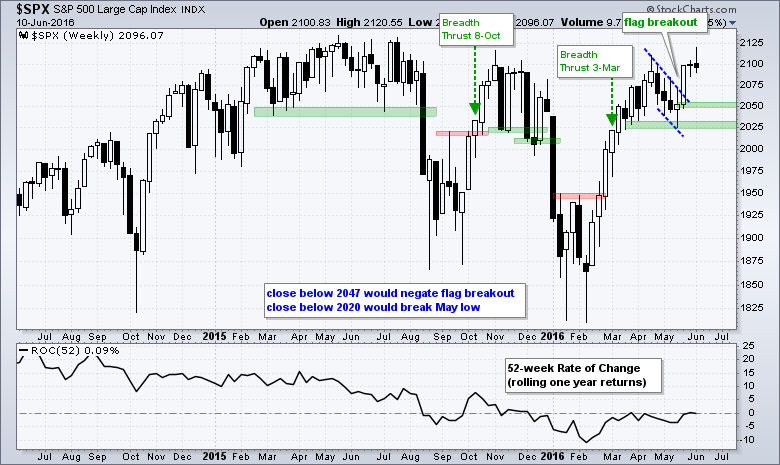
Perspective on Failed Rally - New Highs Expand, but Breadth Takes a Hit - T-Yield Plunge Shakes the Markets
by Arthur Hill,
Chief Technical Strategist, TrendInvestorPro.com
Perspective on Last Week's Failed Rally // Lower High Takes Shape for Nasdaq 100 // Russell 2000 Earned the Right to Correct // Broad Selling hits key Breadth Indicator // New Highs Actually Expanded Last Week // Plunge in Yields Shakes up the Markets // .....
Perspective on Last Week's Failed Rally
Stocks...
READ MORE
MEMBERS ONLY
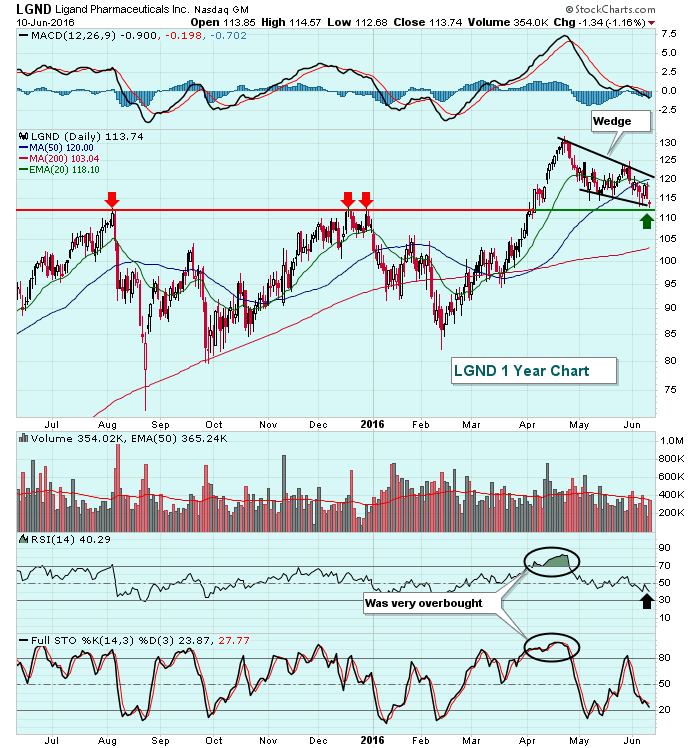
Ligand's Bullish Wedge Touches Price Support
by Tom Bowley,
Chief Market Strategist, EarningsBeats.com
Ligand Pharmaceutical (LGND) broke out above price resistance in April with solid volume confirmation. But the stock was extremely overbought and in need of a pullback to unwind its momentum oscillators. RSI had touched the 80s with stochastic elevated in the 90s. LGND has lost approximately 12%-13% over the...
READ MORE
MEMBERS ONLY
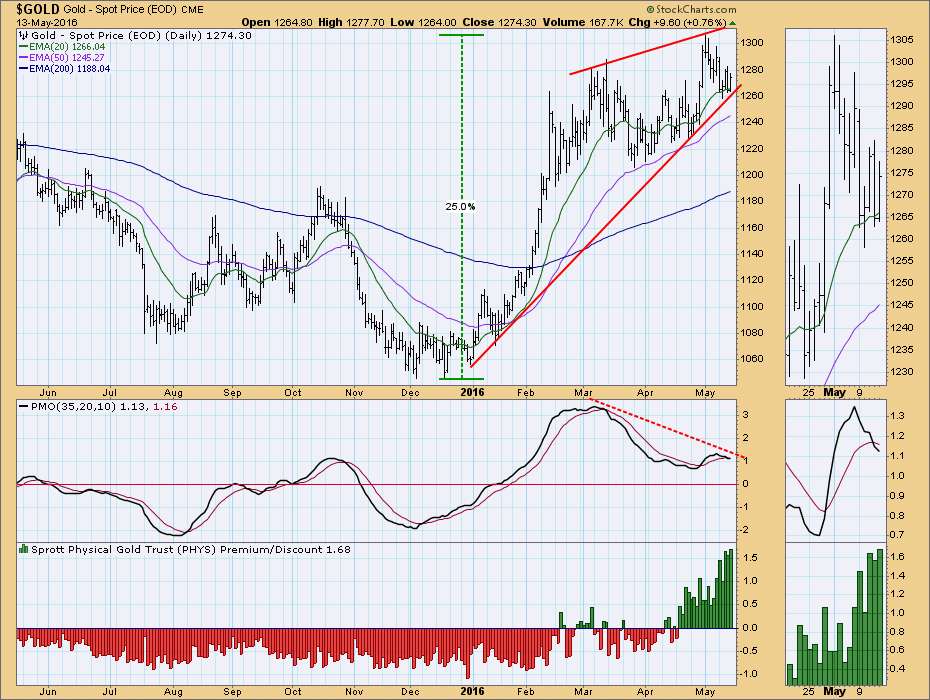
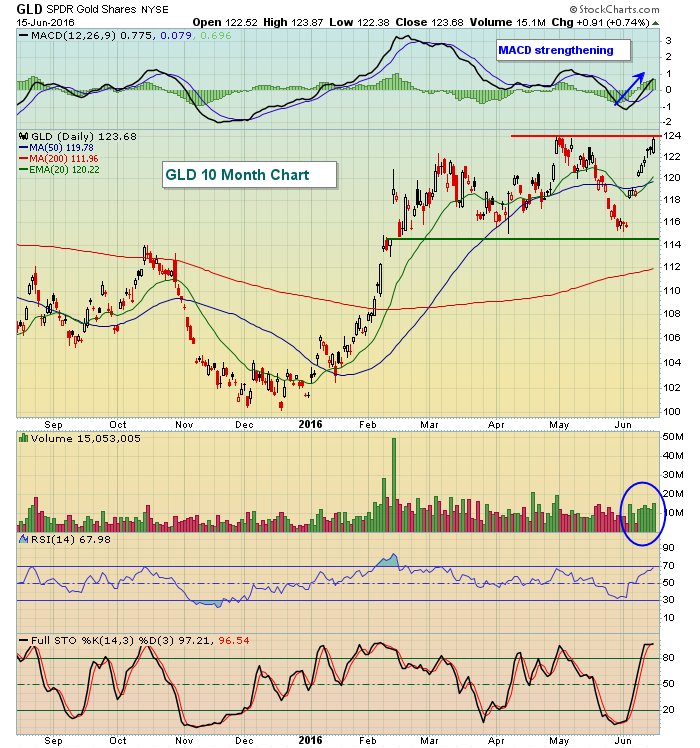
GOLD: Bullish and No "Buts"

by Carl Swenlin,
President and Founder, DecisionPoint.com
It has been almost a month since my last commentary on gold, at which time I asserted that gold was bullish but vulnerable for a pullback. On the chart below dated May 13 the primary evidence supporting a pullback was that: (1) price had formed a bearish rising wedge, a...
READ MORE
MEMBERS ONLY

A Funny Thing Happened On The Way To The Rally

by Martin Pring,
President, Pring Research
* Some short-term equity market cracks are starting to appear
* Rates are starting to breakdown
* Keep watching those credit spreads
Some short-term equity market cracks are starting to appear
In my last article, I pointed out that most of the short-term oscillators were in a bullish configuration. Moreover, they were not...
READ MORE
MEMBERS ONLY

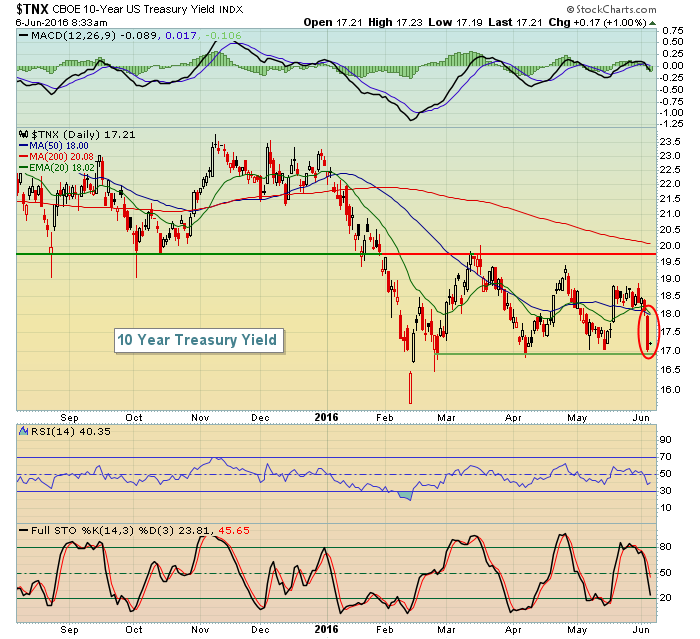
PLUNGE IN GLOBAL BOND YIELDS SPARKS FLIGHT TO SAFETY -- RECORD LOW FOREIGN YIELDS PULL 10-YEAR TREASURY YIELD TO THREE-YEAR LOW -- BREXIT FEARS HIT POUND AND EUROPE -- OVERBOUGHT OIL MARKET DUE FOR A PULLBACK -- SO IS THE S&P 500
by John Murphy,
Chief Technical Analyst, StockCharts.com
FALLING FOREIGN YIELDS PULL TREASURIES LOWER... The big story this week was the plunge in global bond yields, many of which fell to record lows and deeper into negative territory. Chart 1 compares 10-Year yields of the U.S. (green), Britain (red), Germany (blue), and Japan (orange). The last three...
READ MORE
MEMBERS ONLY

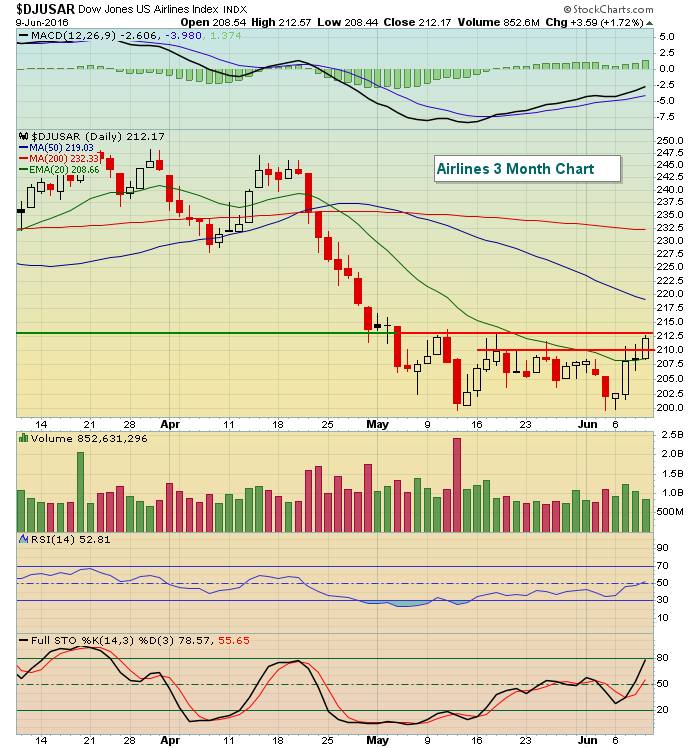
The Unfriendly Skies

by Bruce Fraser,
Industry-leading "Wyckoffian"
Mr. Wyckoff’s counsel was to learn how to read the tape and then to determine buying and selling decisions by the price action. For Mr. Wyckoff ‘reading the tape’ was best done by plotting the price onto a chart and then interpreting the chart. Our mission in ‘Wyckoff Power...
READ MORE
MEMBERS ONLY

The Four Crucial Beliefs Necessary to Achieve Stock Market Mastery
by Gatis Roze,
Author, "Tensile Trading"
Galloping through the markets without recognizing the impact of your essential beliefs is an investing tragedy of Shakespearean proportions. If this describes your style, money management will be like trying to nail Jello to the wall.
We use to joke that my high school buddy, Brian Maxwell, was a force...
READ MORE
MEMBERS ONLY
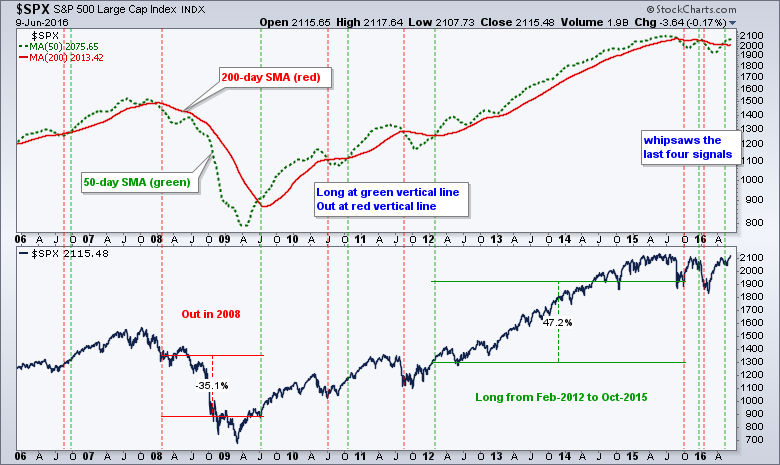
SystemTrader - Testing the Golden Cross with the Nasdaq 100 and Russell 2000 - Do Short Positions Add Value?
by Arthur Hill,
Chief Technical Strategist, TrendInvestorPro.com
SystemTrader - Tweaking the Golden Cross // Testing Other Indexes // Testing the Golden Cross with Short Positions // Testing with Exponential Moving Averages // The Pitfalls of Optimization // Optimizing the Long-term Moving Average Cross // The Russell 2000 is a Different Beast // Final Thoughts //// ........
Last week I tested a trading system using the golden...
READ MORE
MEMBERS ONLY
Rotation Towards Defense A Big Problem
by Tom Bowley,
Chief Market Strategist, EarningsBeats.com
Market Recap for Thursday, June 9, 2016
Utilities (XLU, +0.86%) and consumer staples (XLP, +0.39%) - two defensive sectors - led the action on Thursday and contributed heavily to the reversal in U.S. equities after a weak opening hour. Unfortunately, we want to see traders turn more...
READ MORE
MEMBERS ONLY
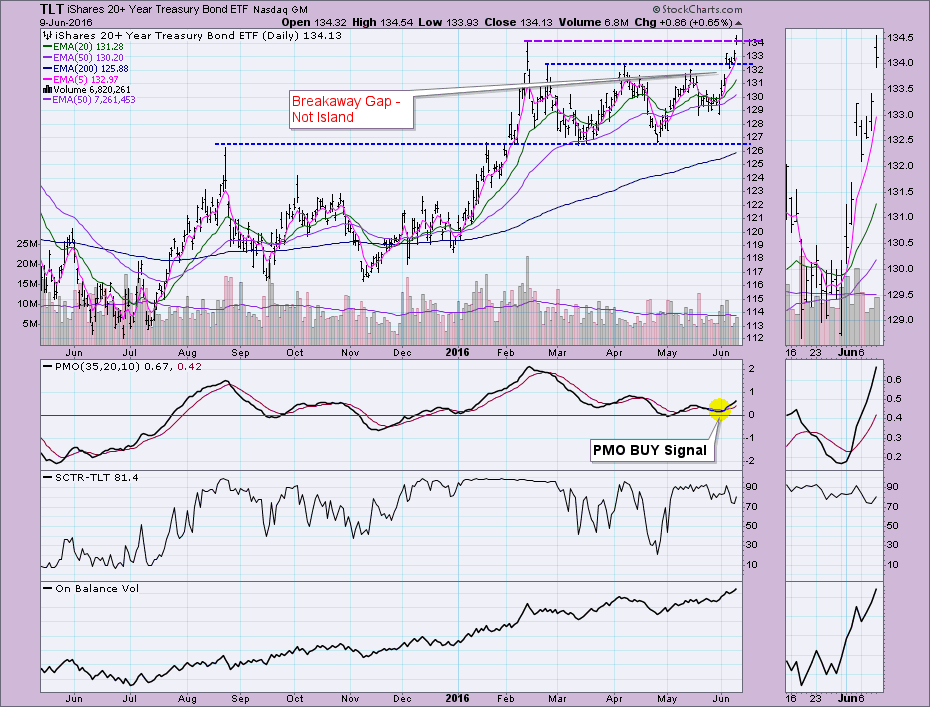
TLT Hits New All-Time High - More to Come?
by Erin Swenlin,
Vice President, DecisionPoint.com
Yesterday it appeared that TLT had formed a reverse island formation. However, with the Price Momentum Oscillator (PMO) on a BUY signal, the SCTR with a healthy 75+ reading and an OBV line trending higher, I knew it wasn't a good fit. I suggested it might be a...
READ MORE
MEMBERS ONLY
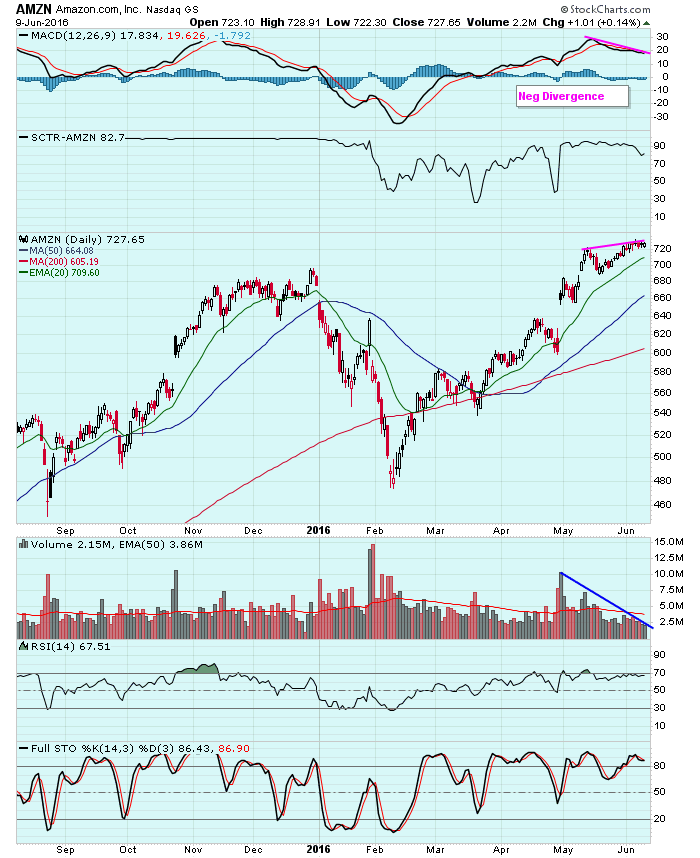
Amazon's Negative Divergence Could Spell Trouble
by Tom Bowley,
Chief Market Strategist, EarningsBeats.com
Amazon.com (AMZN) has been one of the strongest performers in 2016 and just recently broke out on a relative basis vs. the S&P 500 when it impressed Wall Street with its latest quarterly earnings results. But there are now a couple warning signs that indicate AMZN may...
READ MORE
MEMBERS ONLY
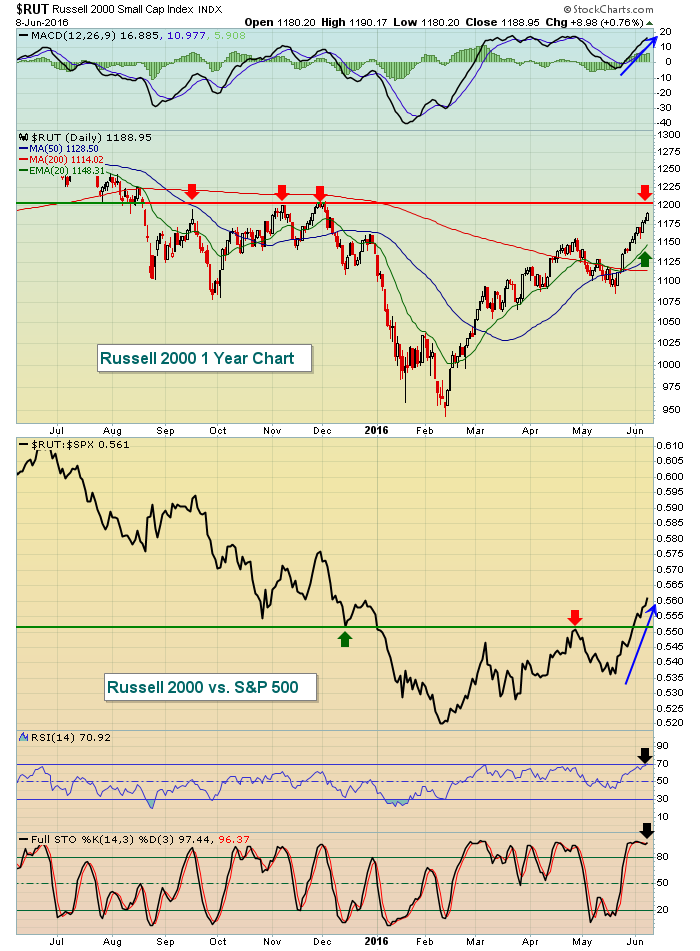
Is The VIX Warning Us?
by Tom Bowley,
Chief Market Strategist, EarningsBeats.com
Market Recap for Wednesday, June 8, 2016
Our major indices pushed higher once again on Wednesday with the S&P 500 climbing within 12 points of its all-time high close of 2131. But the strongest index was clearly the small cap index, or Russell 2000, which gained 0.76%...
READ MORE
MEMBERS ONLY
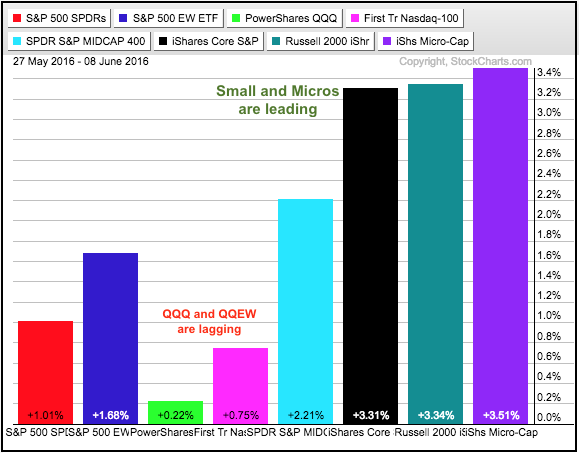
Big Techs Weigh on QQQ - MSFT, GOOGL and APPL Hit Gap Zones - Small Cap New Highs Surge - 8 Stocks to Watch
by Arthur Hill,
Chief Technical Strategist, TrendInvestorPro.com
Small and Micros Continue to Lead // Big Techs Weigh on QQQ // QQQ Extends Stall // SPY Hits a New High // IWM Leaves the others in the Dust // 4 of 5 Small-cap Sector ETFs Hit New Highs // Most New Highs since June // Stocks of Interest: TJX, FCX, GS, CVS, DIS, F, ADP,...
READ MORE
MEMBERS ONLY

INDUSTRIAL SPDR NEARS NEW RECORD -- RAILS ARE BACK ON TRACK LED BY CSX AND UNION PACIFIC -- COMMODITY INDEXES REACH BULL MARKET THRESHOLD -- MATERIALS ALSO SHOW MARKET LEADERSHIP -- NUCOR LEADS STEEL STOCKS HIGHER -- FALLING BOND YIELDS HELP GOLD
by John Murphy,
Chief Technical Analyst, StockCharts.com
INDUSTRIAL SPDR NEARS RECORD ... One of the positive signs for the stock market is that it's being led higher by economically sensitive stock groups. Chart 1, for example, shows the Industrial Sector SPDR (XLI) testing its April high. The XLI scored a bullish breakout during March when it...
READ MORE
MEMBERS ONLY
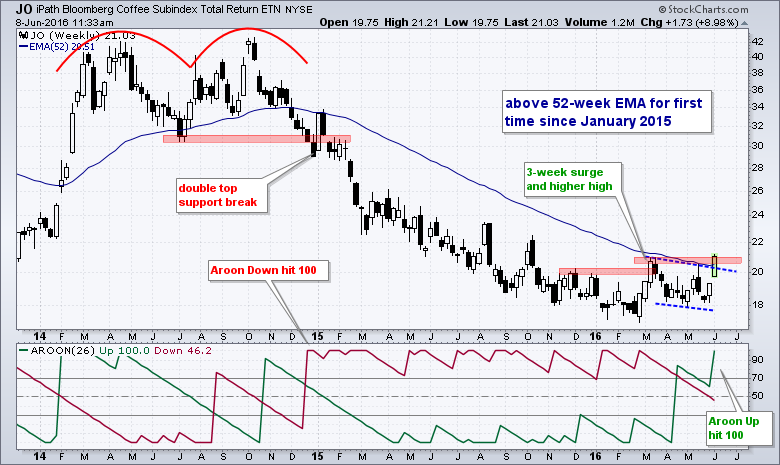
JO Makes a Big Jump
by Arthur Hill,
Chief Technical Strategist, TrendInvestorPro.com
The Coffee ETF (JO) is one of leading commodity ETFs this week with an 8+ percent gain in just three days. The chart shows JO trending lower from the October 2014 peak until the February 2014 trough. JO then surged with a sharp three week advance that exceeded 20 and...
READ MORE
MEMBERS ONLY
Late Day Selling Leaves Bifurcated Market
by Tom Bowley,
Chief Market Strategist, EarningsBeats.com
Market Recap for Tuesday, June 7, 2016
Our major indices were strong throughout much of the day on Tuesday, only to see most of those gains vanish by the close. The NASDAQ was the target of most of the selling as this tech-influenced index finished in negative territory. The other...
READ MORE
MEMBERS ONLY

Odds and Ends
by Greg Morris,
Veteran Technical Analyst, Investor, and Author
Webster defines Odds and Ends as different kinds of things that are usually small and unimportant. I would prefer to define them as sort of important. I’ll use this format for issues that I cannot justify an entire article on. So expect Odds and Ends II at some point....
READ MORE
MEMBERS ONLY

Only Sector with Declining Momentum is... the Financial (XLF, RYF) Sector
by Erin Swenlin,
Vice President, DecisionPoint.com
I have been watching the DecisionPoint Market/Sector Summary Daily Report (located in the "DP Reports" blog) closely, actually, one table in particular. The "PMO Crossover Signals" table identifies whether a particular sector is on a Price Momentum Oscillator (PMO) BUY or SELL Signal. You'...
READ MORE
MEMBERS ONLY
S&P 500 Closes At Highest Level Since Early November
by Tom Bowley,
Chief Market Strategist, EarningsBeats.com
Market Recap for Tuesday, June 7, 2016
The benchmark S&P 500 closed at 2109.41 on Monday, it's highest close since November 3, 2015 when it finished at 2109.79. This finish is just 1% away from its all-time high close of 2130.82 on May...
READ MORE
MEMBERS ONLY
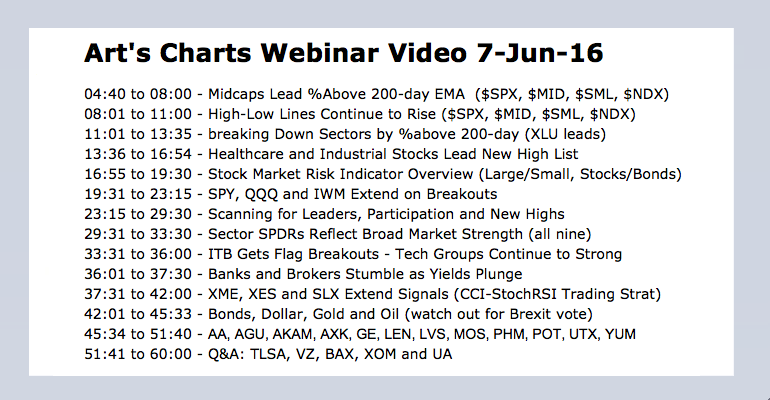
Healthcare and Industrials Lead New High List - Managing a Long Trade - Webinar Video
by Arthur Hill,
Chief Technical Strategist, TrendInvestorPro.com
Midcaps Lead %Above 200-day EMA // High-Low Lines Continue to Rise // Healthcare and Industrials Lead New High List // Sectors Reflect Broad Market Strength // XLE and XLB Extend Breakouts // Metals & Mining and Oil & Gas Equip & Services SPDRs Extend Signals // Webinar Preview //// ....
Midcaps Lead %Above 200-day EMA
Stock market breadth...
READ MORE
MEMBERS ONLY

GLOBAL STOCKS CONTINUE RALLY -- OIL SERVICE STOCKS LEAD MARKET HIGHER ON RISING OIL -- S&P 500 ATTEMPTING NEW HIGH -- SMALL CAPS ARE ALSO LEADING
by John Murphy,
Chief Technical Analyst, StockCharts.com
OIL SERVICE STOCKS SURGE ... Strong buying in energy shares is helping lead global stocks higher. That's especially true of oil service stocks. Chart 1 shows the VanEck Vectors Oil Services ETF (OIH) surging near 7% today. Its relative strength ratio (top of chart) is surging as well. Crude...
READ MORE
MEMBERS ONLY
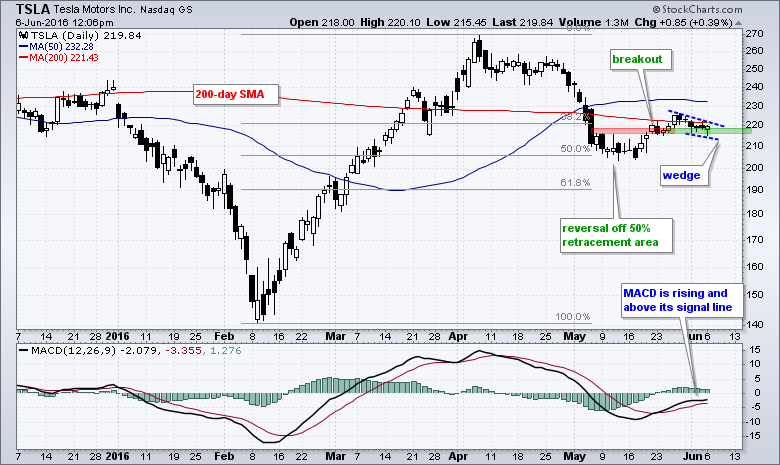
Tesla Battles Key Moving Average as Momentum Improves
by Arthur Hill,
Chief Technical Strategist, TrendInvestorPro.com
Tesla was hit hard in early May, but the stock managed to reverse near the 50% retracement and a bullish wedge is taking shape near the 200-day simple moving average. The stock surged from 140 to 270 from mid February to early April. This was a 90% advance in less...
READ MORE
MEMBERS ONLY
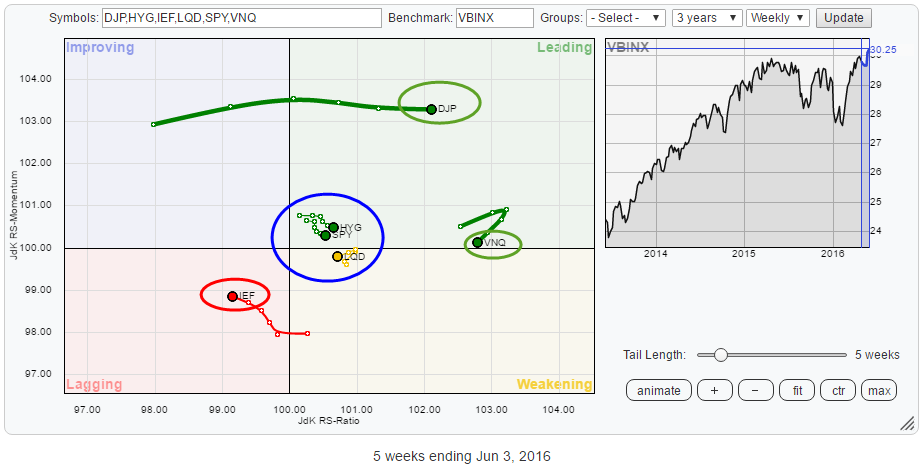
Commodities (DJP) on the move?
by Julius de Kempenaer,
Senior Technical Analyst, StockCharts.com
The rotational pattern of the various asset classes on a Relative Rotation Graphs is showing interesting patterns at the moment. The RRG below holds a number of ETFs that cover Equities, Government Bonds, Corporate Bonds, High Yield Bonds, Real-Estate and Commodities. The benchmark is VBINX, the Vanguard Balanced Index Fund...
READ MORE
MEMBERS ONLY
Worst Jobs Report In Six Years Sends U.S. Stocks Lower
by Tom Bowley,
Chief Market Strategist, EarningsBeats.com
Market Recap for Friday, June 3, 2016
The nonfarm payrolls report on Friday was horrid. Wall Street was expecting 158,000 jobs and the government reported 38,000. It was the lowest number in six years and futures immediately dropped on the news at 8:30am EST Friday morning. The...
READ MORE