MEMBERS ONLY

TLT HITS MOMENT-OF-TRUTH, 30-YR T-YIELD TESTS, YIELD CURVE REMAINS POSITIVE, CRUDE SUFFERS BIGGEST DECLINE, COMMODITIES BOOSTS BONDS, UTILITIES LEAD IN JULY, REITS BOUNCE WITH BONDS

by John Murphy,
Chief Technical Analyst, StockCharts.com
TLT HITS MOMENT-OF-TRUTH WITH BIG WEEK ... Link for today's video. The first week of the month is always packed with economic reports and employment data, which makes it a big week for bonds. Bonds caught a bid over the last three weeks as the 20+ YR T-Bond ETF...
READ MORE
MEMBERS ONLY
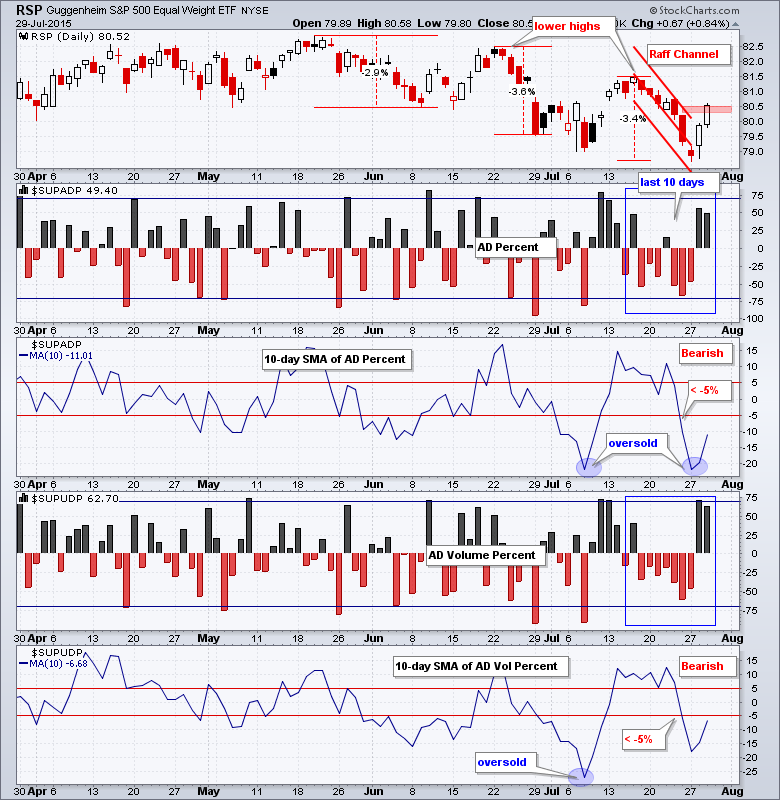
SPY Hits Middle of Range as TLT Extends Uptrend

by Arthur Hill,
Chief Technical Strategist, TrendInvestorPro.com
It was a choppy week, but the major index ETFs managed to finish with small gains. The S&P MidCap SPDR (MDY) led with a 1.85% advance and QQQ lagged with a .77% gain. The sectors were mostly higher with industrials, materials and healthcare leading. Healthcare has been...
READ MORE
MEMBERS ONLY
Acting on Impulse with Elder Impulse Bars
Hello Fellow ChartWatchers!
It was a fairly positive week for the markets last week following a big down move during the week before. For the month of July, the Nasdaq was the big winner rising 2.3% and the Russell 2000 was the loser falling 1.4%.
(Click the chart...
READ MORE
MEMBERS ONLY
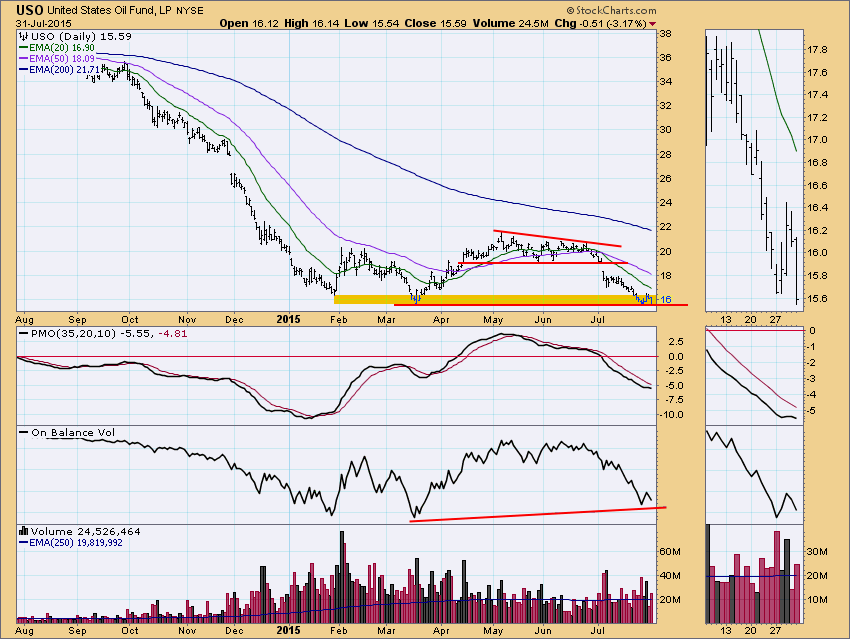
Crude Testing Important Support

by Carl Swenlin,
President and Founder, DecisionPoint.com
The price of crude oil is certainly getting a lot of headlines, but, as usual, we need to look at some charts to get the true picture. Our surrogate for crude is the U.S. Oil Fund ETF (USO), which reflects the price of oil less the costs of actually...
READ MORE
MEMBERS ONLY
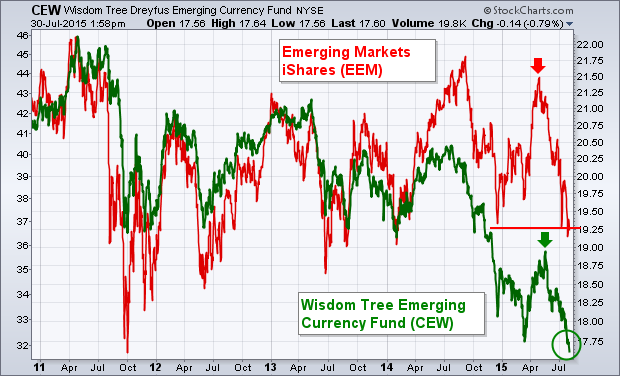
Emerging Market Currencies Pull Stocks Lower
by John Murphy,
Chief Technical Analyst, StockCharts.com
Emerging market assets are suffering from the dual threat of rising U.S. interest rates and a stronger dollar. The most direct result is seen in EM currencies. The green line in Chart 9 shows the Wisdom Tree Emerging Currency Fund (CEW) falling to the lowest level in five years....
READ MORE
MEMBERS ONLY
Earnings Season Shows Mixed Market Reaction

by John Hopkins,
President and Co-founder, EarningsBeats.com
We are deep into earnings season at this point. There have been enough companies reporting so far to make an assessment of what the market thinks of the overall earnings picture as July comes to an end. You can read all kinds of articles and opinions of analysts as to...
READ MORE
MEMBERS ONLY
The Bulls Want Small Cap Leadership To Resume

by Tom Bowley,
Chief Market Strategist, EarningsBeats.com
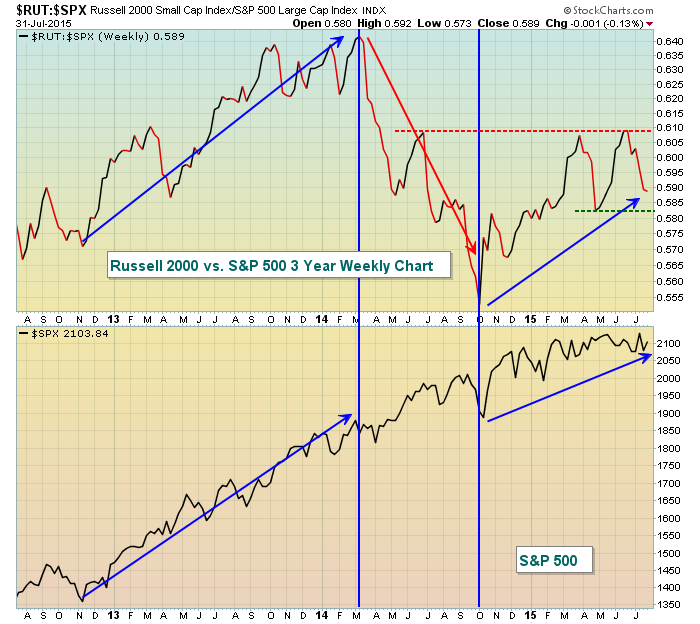
Advances in the stock market are much more bullish and likely more sustainable if small cap stocks are outperforming their large cap counterparts. Over the past three years, we've seen very volatile relative action between the S&P 500 and Russell 2000. During periods when the Russell...
READ MORE
MEMBERS ONLY
Are We Primed For An October-Like Selloff?
by Tom Bowley,
Chief Market Strategist, EarningsBeats.com
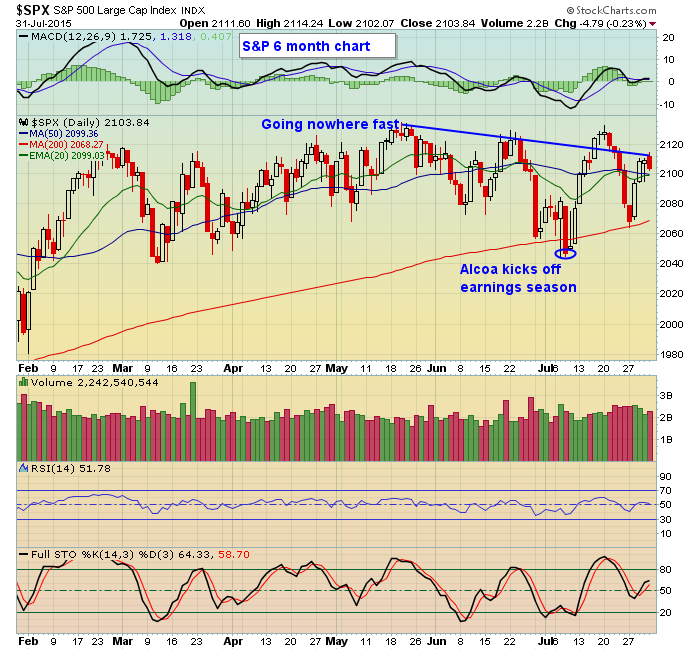
I don't think so. I'm always a bit leery of August and September because of the historical tendency for the stock market to struggle during the late summer season. Throughout the current 6+ year bull market, the Aug-Sept period has racked up gains four out of...
READ MORE
MEMBERS ONLY
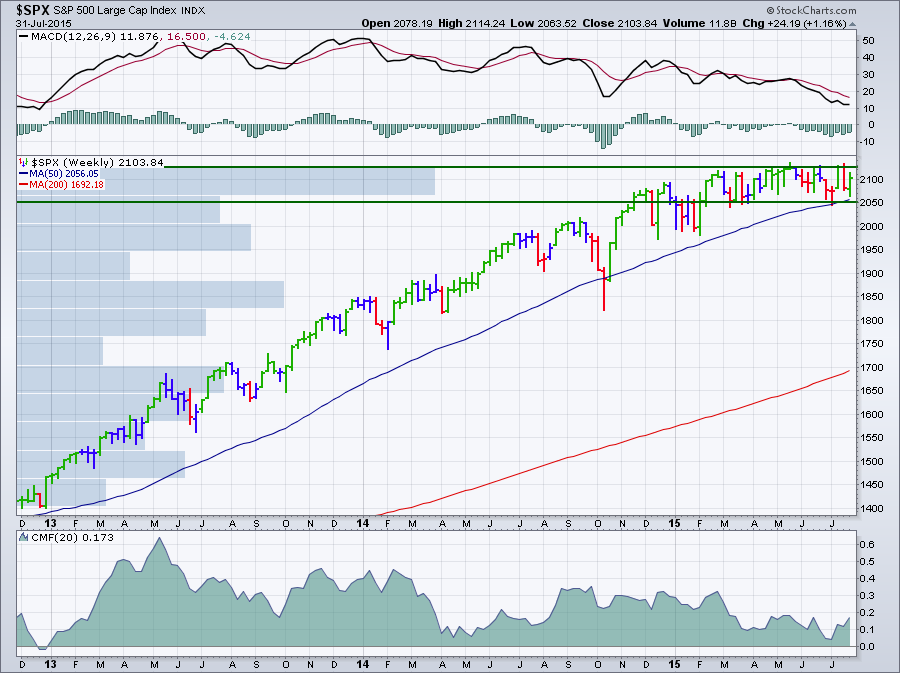
S&P 500 Hasn't Done this in over 20 Years
by Arthur Hill,
Chief Technical Strategist, TrendInvestorPro.com
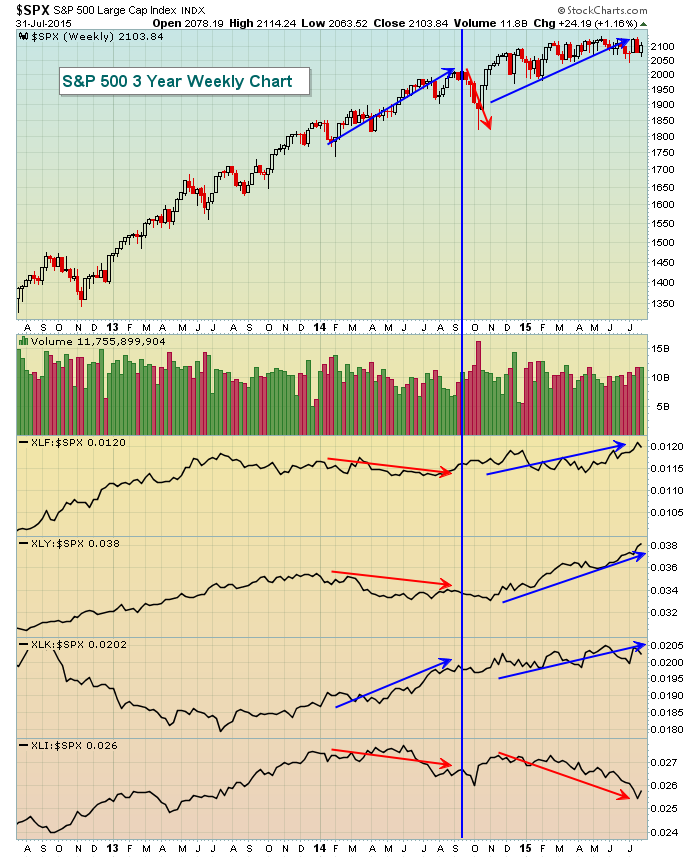
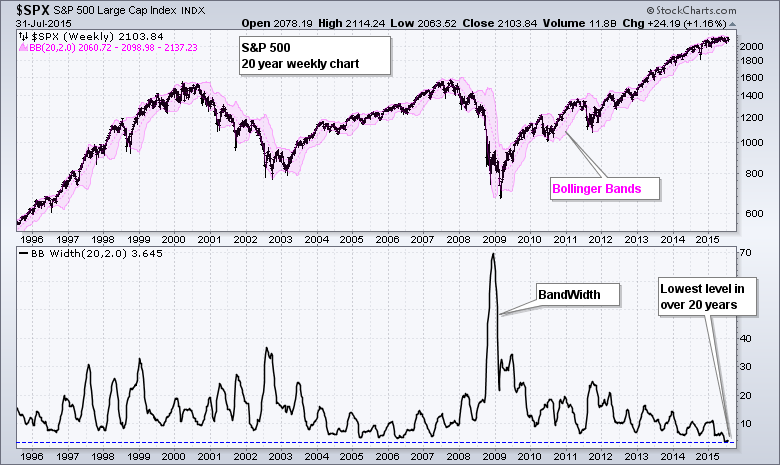
The S&P 500 is locked in a 100 point trading range (2040-2140) since March because of a serious split in sector performance. At less than 5% this is the narrowest range in several years. Note that Bollinger Bandwidth on the weekly chart reached a 20+ year low in...
READ MORE
MEMBERS ONLY
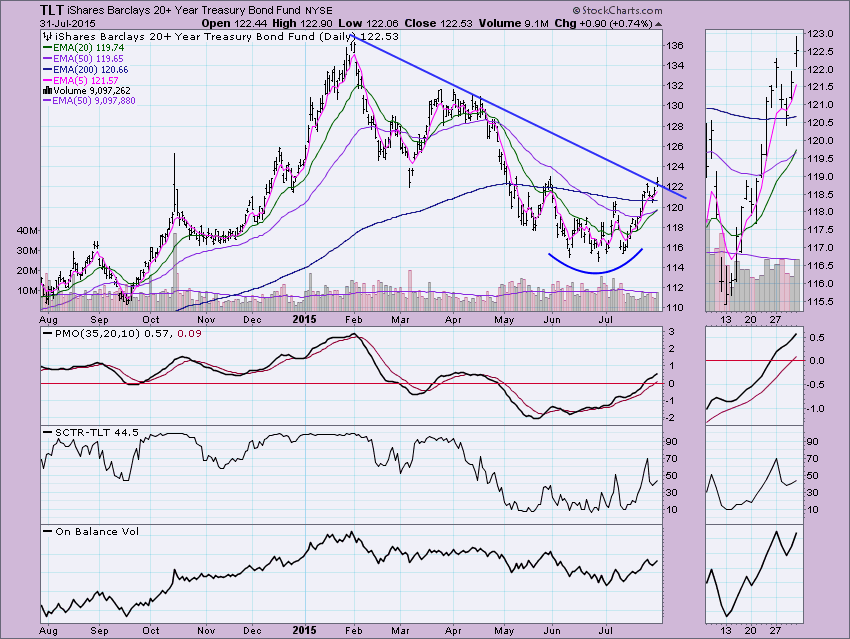
20-Year Treasuries ETF (TLT) Forms a Bullish Reversal Pattern

by Erin Swenlin,
Vice President, DecisionPoint.com
With the new Intermediate-Term Trend Model (ITTM) BUY signal on TLT and the breakout for the second time above the March low, I decided it was definitely time to abort the bearish Adam and Eve double-top pattern that I have been watching in earnest. Instead, I'm now seeing...
READ MORE
MEMBERS ONLY

Reaccumulation Roundup

by Bruce Fraser,
Industry-leading "Wyckoffian"
During this and the next several posts we will focus our attention on Reaccumulation formations. These are among the most useful and powerful setups that a Wyckoffian can master. Let’s concentrate on charts in this post and become familiar with Reaccumulations in some of their many varied formations. Wyckoffians...
READ MORE
MEMBERS ONLY

SPY HOLDS UPTREND, SECTOR SPLIT DEFINES RANGE, REVIEWING 2007 TOP, SECTOR BREADTH IN 2007-2008, SECTOR BREADTH IN 2015, HEALTHCARE PROVIDERS ETF CORRECTS, SOFTWARE ETF CONSOLIDATES, AIRLINES TRY TO TAKE OFF
by John Murphy,
Chief Technical Analyst, StockCharts.com
SPY UPTREND CONTINUES TO HOLD... Link for today's video. By now we are all aware of deteriorating breadth on the NYSE and relative weakness in small-caps. We are also well aware of the trading range for the S&P 500 since March. The trading ranges for the...
READ MORE
MEMBERS ONLY

Nine Reasons for You to Join Our Club: ChartPack Update 7.25

by Gatis Roze,
Author, "Tensile Trading"
Once a quarter, I update my Tensile Trading ChartPack. With such a large number of users now it was easy to poll some of these investors to ask how and why they use the ChartPack. Their reasons were enlightening, so I’m summarizing a few of their comments in this...
READ MORE
MEMBERS ONLY
Learn To Stalk Stocks, Then Pounce
by Tom Bowley,
Chief Market Strategist, EarningsBeats.com
Risk management is paramount to a successful trader. It sounds easy enough, but what does it mean? Well, it can mean lots of different things to different people. The easiest way to manage risk is to remain in cash. You can sleep without worrying what happened in China overnight. But...
READ MORE
MEMBERS ONLY
SPY Holds Short-term Uptrend, UUP Holds Break and TLT Tests Support
by Arthur Hill,
Chief Technical Strategist, TrendInvestorPro.com
The major index ETFs closed fractionally higher in listless trading. QQQ led with a .48% bounce. MSFT and GILD lifted QQQ and have bullish looking charts. The sectors were mixed with energy and consumer staples losing ground. The consumer discretionary, finance and materials sectors gained. Of note, the Home Construction...
READ MORE
MEMBERS ONLY

What's Up with the Dow? Is it Leading or Lagging?
by Erin Swenlin,
Vice President, DecisionPoint.com
If you check out the DP Chart Gallery Scoreboards, you'll see that the picture for the Dow Industrials is bearish while the other indexes (SPX, NDX and OEX) are looking much more bullish. The question becomes, are the Dow Industrials lagging or will they lead the market lower?...
READ MORE
MEMBERS ONLY

NYSE COMPOSITE REMAINS IN CONSOLIDATION -- % OF NYSE STOCKS ABOVE MOVING AVERAGES NEEDS TO SHOW IMPROVEMENT -- S&P INDEXES BOUNCE OFF 200-DAY AVERAGES -- SMALL CAPS NEED TO DO BETTER -- TRANSPORTS FINALLY SHOW SOME BOUNCE -- DOLLAR REBOUND CONTINUES
by John Murphy,
Chief Technical Analyst, StockCharts.com
NYSE COMPOSITE FINDS SUPPORT AT MARCH LOW... I wrote a message three Thursdays ago (July 9) on Elliott Waves which suggested that the May high on the NYSE Composite Index had completed a major upwave from its 2011 bottom (Wave 3), and was entering a Wave 4 period of correction...
READ MORE
MEMBERS ONLY
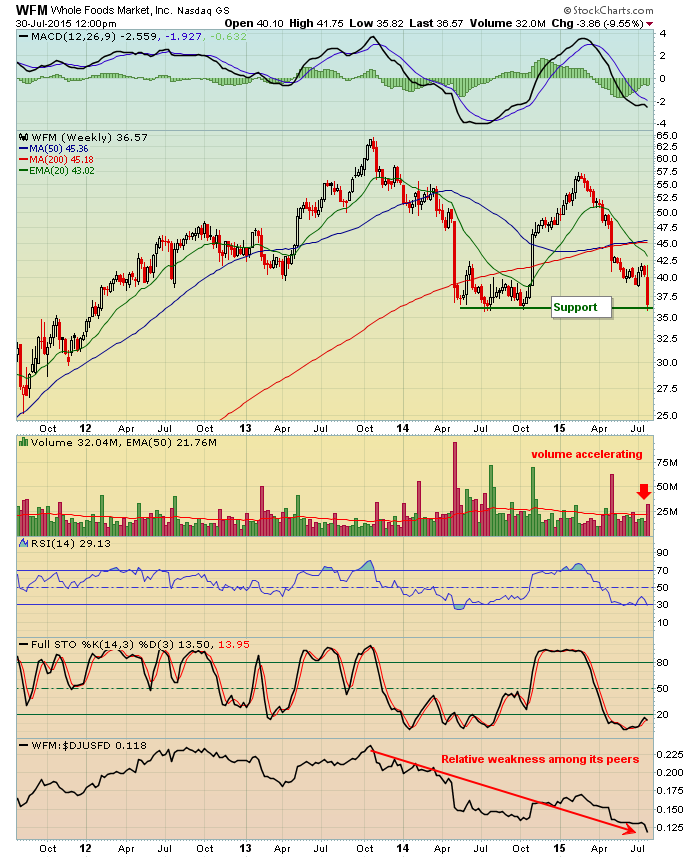
Whole Foods Market (WFM) Poor Results Test Support
by Tom Bowley,
Chief Market Strategist, EarningsBeats.com
WFM posted underwhelming quarterly earnings results and the stock is down significantly in early action today. More importantly, however, is the longer-term price support that's being tested. WFM has not had an open or a close beneath 35.90 since early 2012 although WFM has tested this area...
READ MORE
MEMBERS ONLY

Zahorchak Measure

by Greg Morris,
Veteran Technical Analyst, Investor, and Author
I'm quite certain the title of this article caused curiosity. I often use the word Measure instead of Indicator when referring to indicators that are used to measure something, such as a trend, a level of volatility, etc. I have mentioned Michael Zahorchak before. His book, “The Art...
READ MORE
MEMBERS ONLY
SPY Leads Again, IWM and QQQ Lag, GLD Forms Mini-Flag
by Arthur Hill,
Chief Technical Strategist, TrendInvestorPro.com
Stocks moved higher on Wednesday, but the bounce was rather lopsided. Large-cap techs weighed on QQQ as the ETF gained .38%. The Nasdaq 100 Equal-Weight ETF (QQEW), in contrast, gained .93% on the day. The Russell 2000 iShares (IWM) gained just .28% and continues to lag. The S&P...
READ MORE
MEMBERS ONLY
MACD Trading Secrets
by Tom Bowley,
Chief Market Strategist, EarningsBeats.com
The MACD is an awesome indicator, one that I use in my trading decisions every day. But there are misinterpretations at times, in my opinion, and I want to share a few of those with you. In my most recent article, "The Power of the MACD", I shared...
READ MORE
MEMBERS ONLY
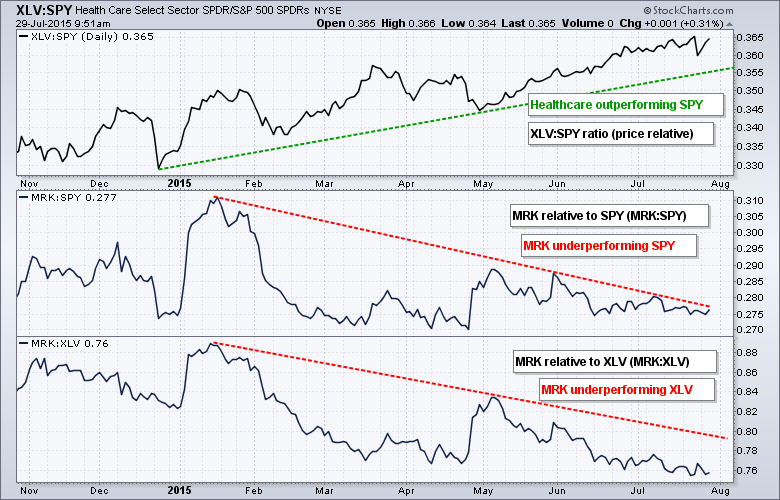
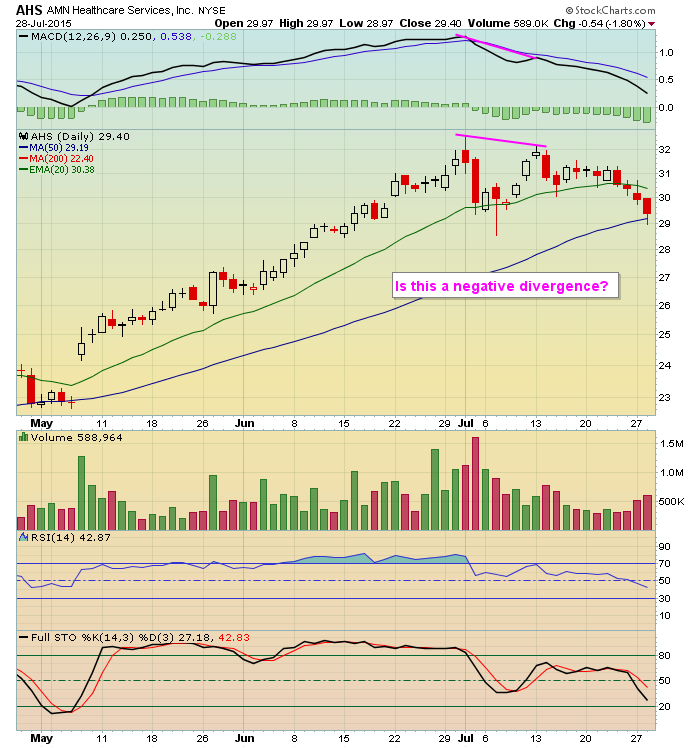
Merck Forms Key Outside Reversal on High Volume
by Arthur Hill,
Chief Technical Strategist, TrendInvestorPro.com
The HealthCare SPDR (XLV) has been one of the strongest sectors in 2015, but Merck (MRK) has lagged both the market and the sector. The first chart shows the HealthCare SPDR (XLV) relative to the S&P 500 SPDR (SPY) using the price relative (XLV:SPY ratio). This ratio...
READ MORE
MEMBERS ONLY
SPY Leads Oversold Bounce - UUP Tests Uptrend Support
by Arthur Hill,
Chief Technical Strategist, TrendInvestorPro.com
Stocks bounced with gains across the board. Most of the major index ETFs gained over 1%, but the Russell 2000 iShares (IWM) lagged with a .85% gain. All sectors were up with the oversold sectors getting the biggest bounces (energy, materials and industrials). The finance, consumer discretionary and technology sectors...
READ MORE
MEMBERS ONLY

Thrust and Parry Revisited
by Erin Swenlin,
Vice President, DecisionPoint.com
I recently received an email from one our DecisionPoint veterans who followed us in our early years. He asked about the Thrust/Trend Model (T/TM) which we used to employ instead of the Trend Model to determine our timing signals. Before we moved to StockCharts.com, Carl opted out...
READ MORE
MEMBERS ONLY

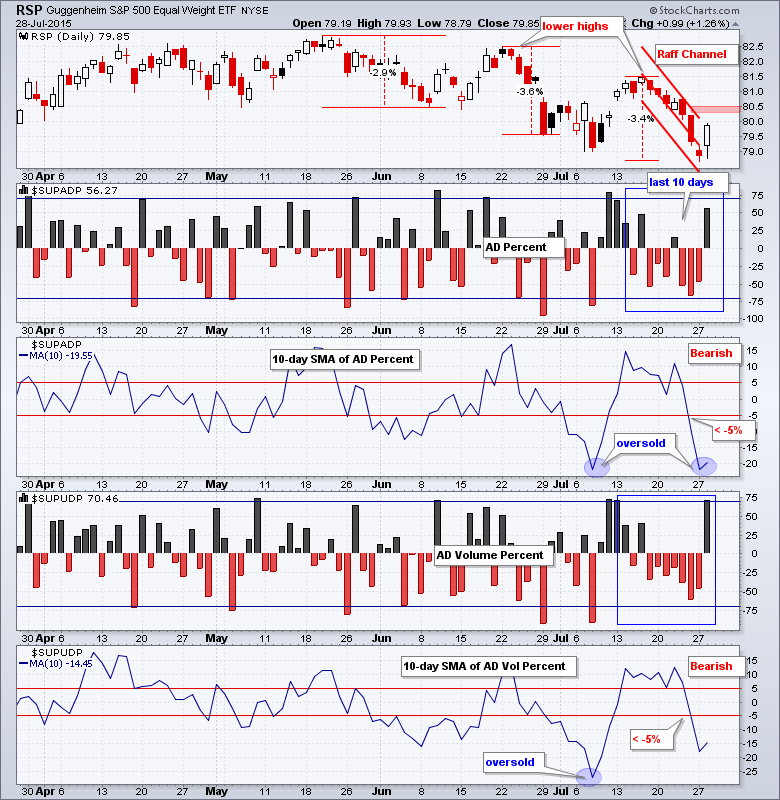
SECTORS FOR FOCUS, EW S&P 500 CORRECTS, PPO AS A TREND INDICATOR, AMAZON EFFECT DISSIPATES IN RCD, RETAIL WEAKENS AS HOUSING HOLDS, HEALTHCARE-STAPLES LEAD, TWO INTERNATIONAL ETFS TO WATCH, WEBINAR EXTRAS
by John Murphy,
Chief Technical Analyst, StockCharts.com
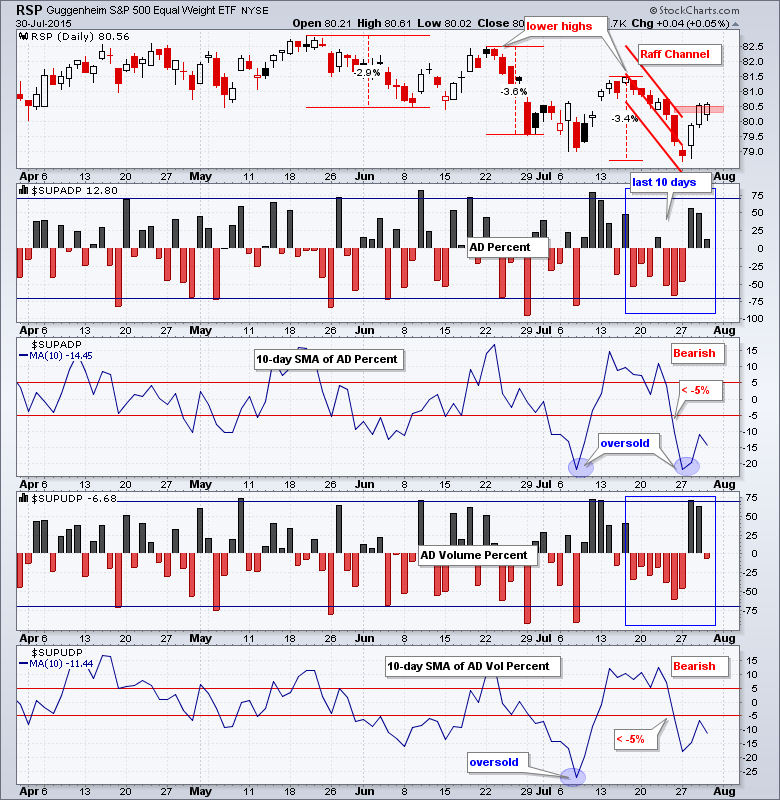
FOUR SECTORS FOR FOCUS ... Click here for the webinar recording. The materials and energy sectors are weighing on the broader market with outsized losses, but the broader market is still holding up relatively well. PerfChart 1 shows the performance for RSP and the nine equal-weight sectors since the beginning of...
READ MORE
MEMBERS ONLY
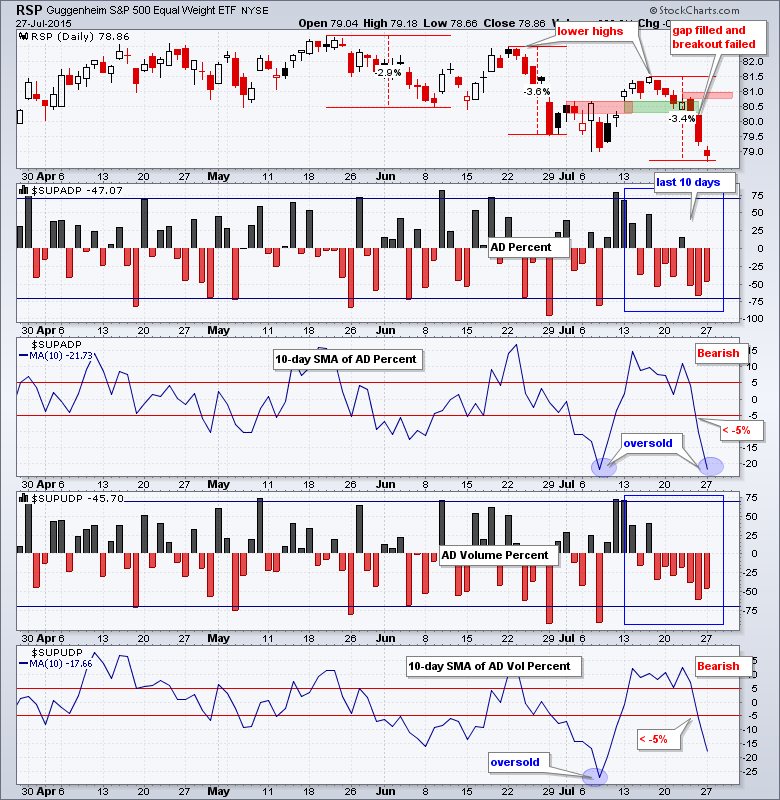
Breadth Becomes Short-Term Oversold
by Arthur Hill,
Chief Technical Strategist, TrendInvestorPro.com
Stocks were hit with further selling pressure on Monday, but selling pressure was rather contained. IWM, QQQ and SPY declined between .50% and 1%. Eight of the nine sectors were down with utilities bucking the selling pressure. Healthcare and consumer staples also held up relatively well with fractional declines. The...
READ MORE
MEMBERS ONLY
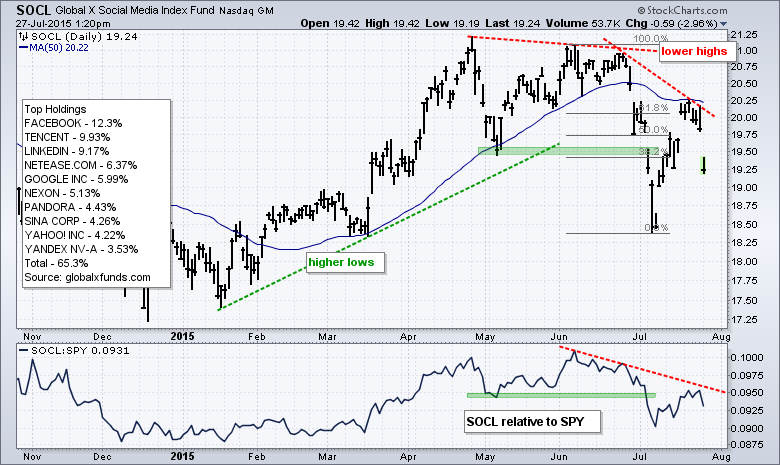
Chinese Holdings Weigh on Global X Social Media ETF
by Arthur Hill,
Chief Technical Strategist, TrendInvestorPro.com
The Social Media Global ETF (SOCL) fell sharply on Monday to signal a continuation of the prior decline. The chart below shows SOCL breaking support with a sharp decline in late June and early July. This is the break that broke the bull's back. Notice how the ETF...
READ MORE
MEMBERS ONLY

MARKING SUPPORT FOR BIOTECH ETFS, BANKING ETFS MAINTAIN TRENDS, FINANCE-STAPLES-HEALTHCARE LEAD NEW HIGHS, CHINESE STOCKS FALL FROM RETRACEMENT, HIGH-LOW PERCENT INDICATORS TURN, SECTOR RANKINGS REMAIN UNCHANGED
by John Murphy,
Chief Technical Analyst, StockCharts.com
MARKING KEY SUPPORT FOR BIOTECH ETFS... Link for today's video. Biotechs were star performers in 2012, 2013 and 2014. These stocks, and their respective ETFs, are also leading in 2015, even after last week's big decline. The Biotech iShares (IBB) and Biotech SPDR (XBI) are both...
READ MORE
MEMBERS ONLY
IWM Leads Lower and QQQ Tests Resistance Break
by Arthur Hill,
Chief Technical Strategist, TrendInvestorPro.com
Stocks were hit with selling pressure last week as the Russell 2000 iShares (IWM) fell 3.32% and the S&P 500 SPDR (SPY) declined 2.11%. IWM is in a short-term downtrend because it is already testing the early July low. QQQ is holding up the best and...
READ MORE
MEMBERS ONLY
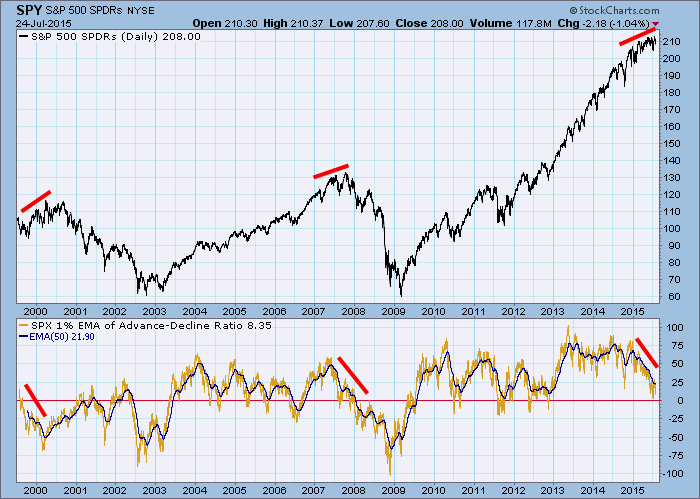
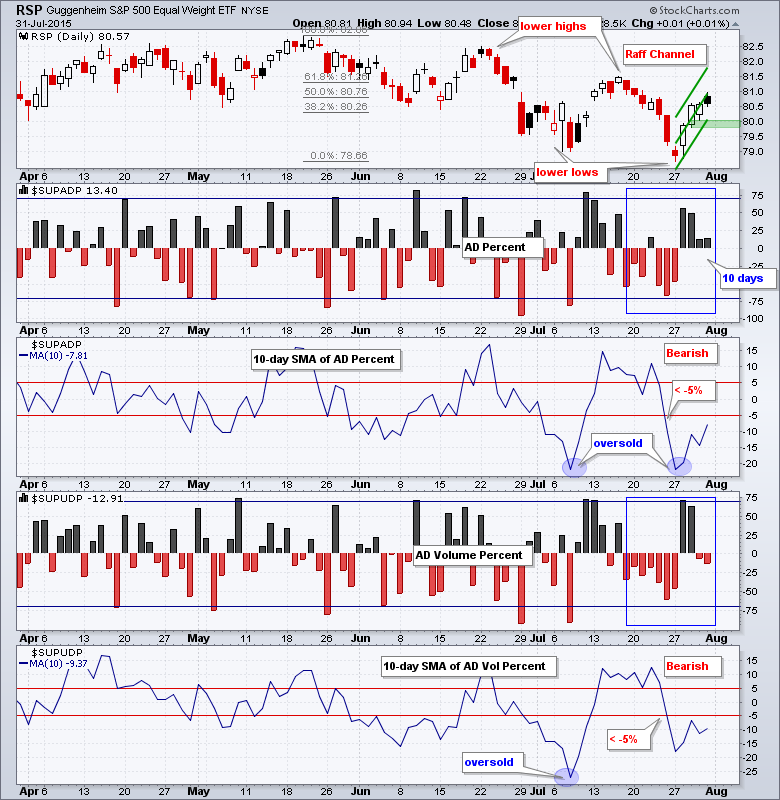
Longer-Term Indicators Continue to Show Internal Erosion
by Carl Swenlin,
President and Founder, DecisionPoint.com
The price index on the chart below has continued to edge higher, but we can see that pattern is becoming congested. The lower panel shows the 1% EMA of the Advance-Decline Ratio* and its 50EMA. The daily data is pretty volatile, so the 50EMA is easier to interpret. Also, when...
READ MORE
MEMBERS ONLY
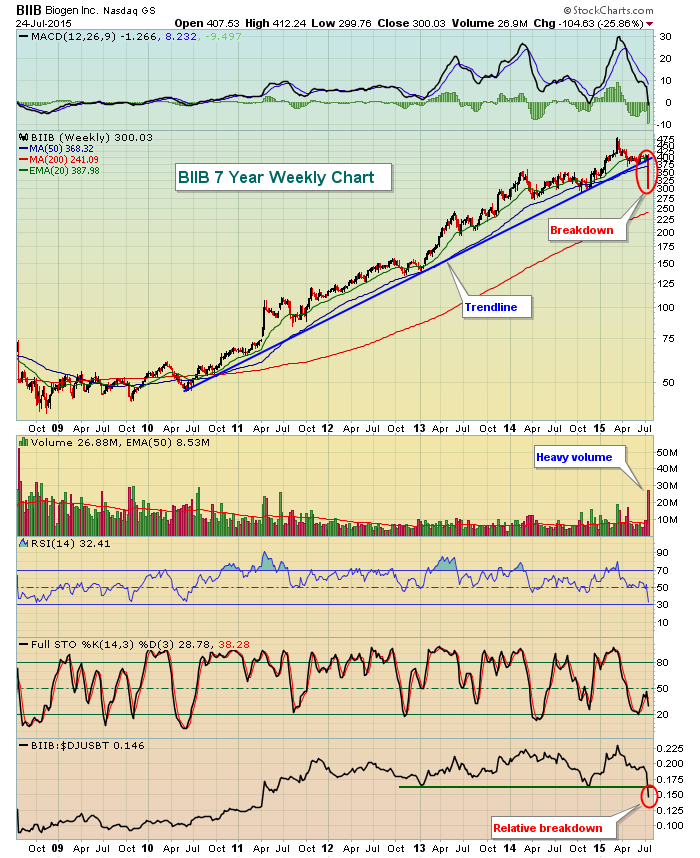
Biogen Inc (BIIB) Suffers Massive Breakdown
by Tom Bowley,
Chief Market Strategist, EarningsBeats.com
There are pullbacks in uptrends and then flat out trend reversing breakdowns. We never know for sure which is which until history plays out. But Biogen's (BIIB) massive selling on Friday has all the makings of the latter. Any time a company rises more than ten fold in...
READ MORE
MEMBERS ONLY

Is it Time to Pull the Plug?

by Martin Pring,
President, Pring Research
* NASDAQ, IWM and NYSE Composite face key tests early next week.
* Confidence in the bond market about to snap?
* Dow violates key bull market trendline.
Market tops are not usually straight up and down affairs but typically experience a trading range separating the primary bull from the bear. During that...
READ MORE
MEMBERS ONLY

DOW ENDS THE WEEK BELOW 200-DAY AVERAGE -- INDUSTRIAL SPDR DROPS TO NINE-MONTH LOW -- S&P 500 ENDS BELOW 50-DAY LINE -- SMALL AND MIDCAP STOCKS THREATEN 200-DAY LINES -- NYSE ADVANCE-DECLINE LINE HITS NEW LOW -- CRB INDEX FALLS TO SIX-YEAR LOW
by John Murphy,
Chief Technical Analyst, StockCharts.com
DOW ENDS BELOW 200-DAY LINE -- XLI FALLS TO NEW 2015 LOW... The stock market had a bad chart week. Chart 1 shows the Dow Industrial Average closing well below its 200-day moving average and within striking distance of its July low. [Friday's drop marked the first "...
READ MORE
MEMBERS ONLY

Trading the News: Lessons From My Personal Trading Journal
by Gatis Roze,
Author, "Tensile Trading"
The motto in the news business seems to be “If it bleeds, it leads.” Investors must appreciate that our news is packaged by the news media in a manner to motivate the audience to tune in. It is thus sold for the benefit of sponsors, not for the benefit of...
READ MORE
MEMBERS ONLY

UPTRENDS UNDER THREAT, BUT NOT REVERSED, SECTOR LEADERS ARE NEGATIVELY CORRELATED, CONSUMER DISCRETIONARY HOLDS THE KEY, HOUSING ETFS MAINTAIN UPTRENDS, RETAIL SPDR CONSOLIDATES WITHIN TREND, IS CORN FOR REAL?
by John Murphy,
Chief Technical Analyst, StockCharts.com
UPTRENDS ARE UNDER THREAT, BUT NOT YET REVERSED... Link for today's video. The major stock indices are still in uptrends, but price action has flattened over the last few months. Nevertheless, the S&P 500 is still around 2% from its all time high, while the S&...
READ MORE
MEMBERS ONLY
Rev Up with Reaccumulation Trading Ranges
by Bruce Fraser,
Industry-leading "Wyckoffian"
In the course of every long uptrend there are extended pauses. The longer the trend, the more pauses there will be. In terms of duration they can last as little as a few months or as long as a year or more. They are designed to torture long term holders...
READ MORE
MEMBERS ONLY
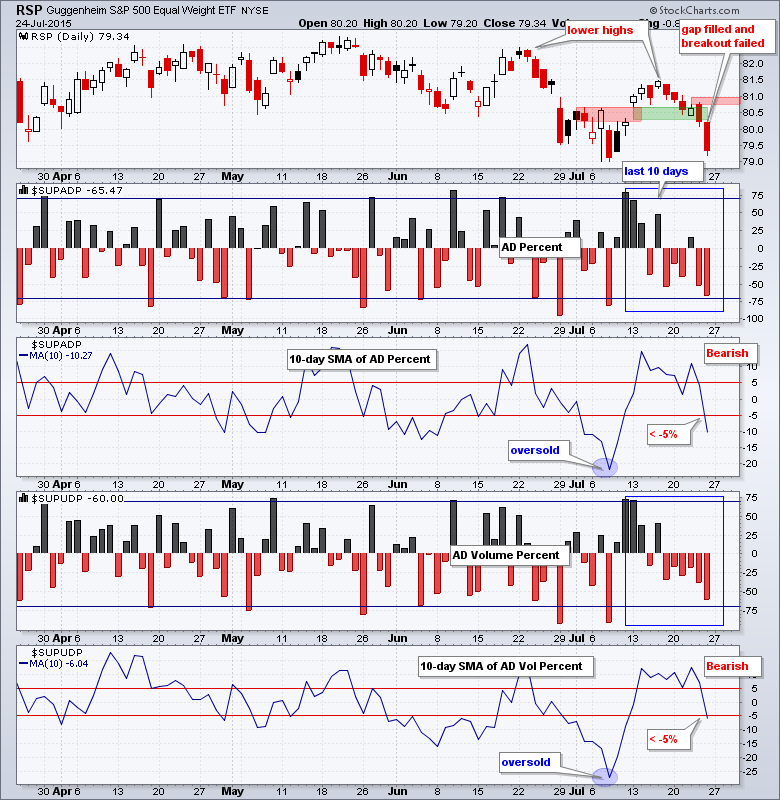
IWM Fills mid July Gap and TLT Breaks Out
by Arthur Hill,
Chief Technical Strategist, TrendInvestorPro.com
Stocks were hit with selling pressure on Thursday as the major index ETFs fell across the board. The Russell 2000 iShares (IWM) led the way with a 1.1% decline. All sector SPDRs were down and eight of the nine equal-weight sector ETFs were down. The EW Energy ETF was...
READ MORE
MEMBERS ONLY
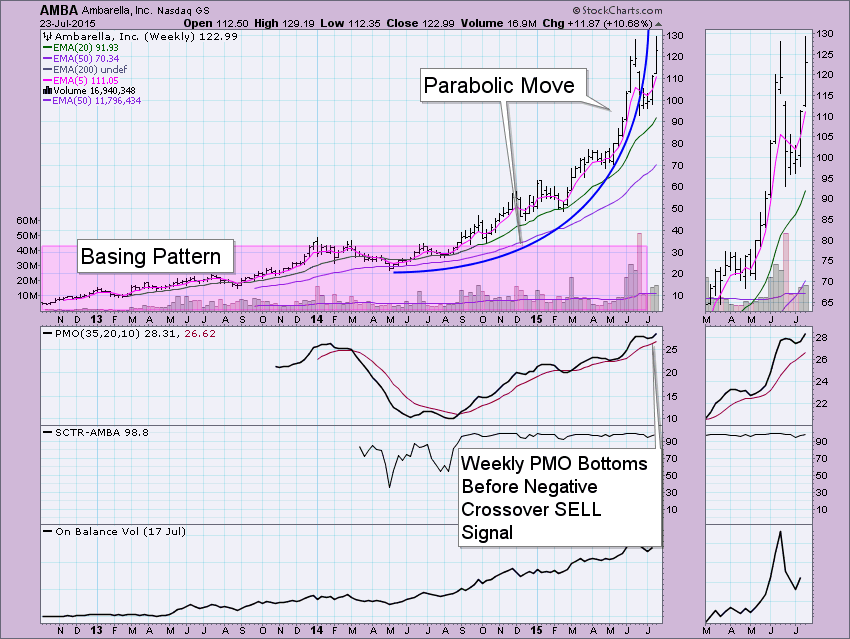
Ambarella (AMBA) Resolves Upward After Parabolic Breakdown
by Erin Swenlin,
Vice President, DecisionPoint.com
My obsession with this stock has not abated. It was one of the more "fun" stocks I've owned in a long time, so I keep revisiting it. After having ridden the parabolic move higher, I, like many, was wiping my brow and letting out a long...
READ MORE
MEMBERS ONLY
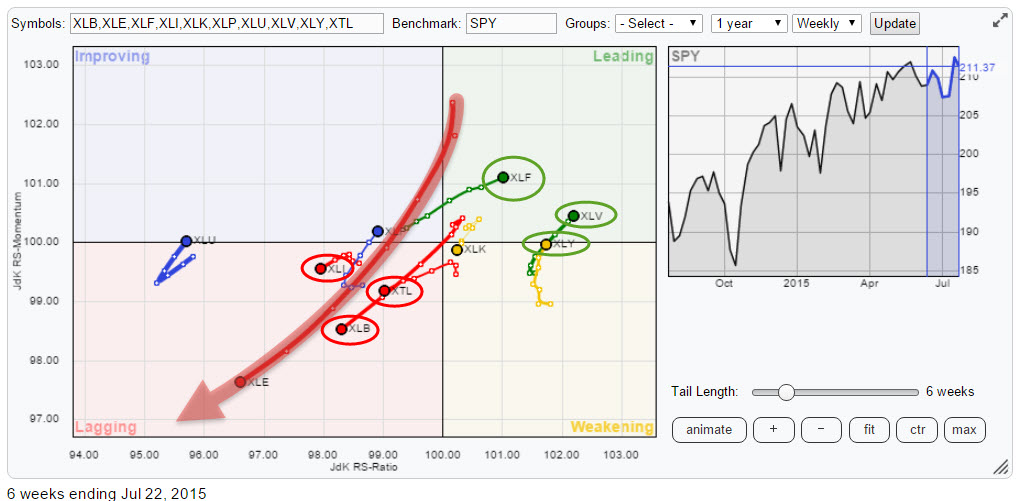
Energetic move for XLE!

by Julius de Kempenaer,
Senior Technical Analyst, StockCharts.com
On the Relative Rotation Graph holding the 10 SPDR sector ETFs comparing them to the S&P 500 index there is one sector standing out .... big time that is!! I am talking about XLE here, the Energy select sector SPDR.
Initial observations
As you can see on the RRG...
READ MORE
MEMBERS ONLY
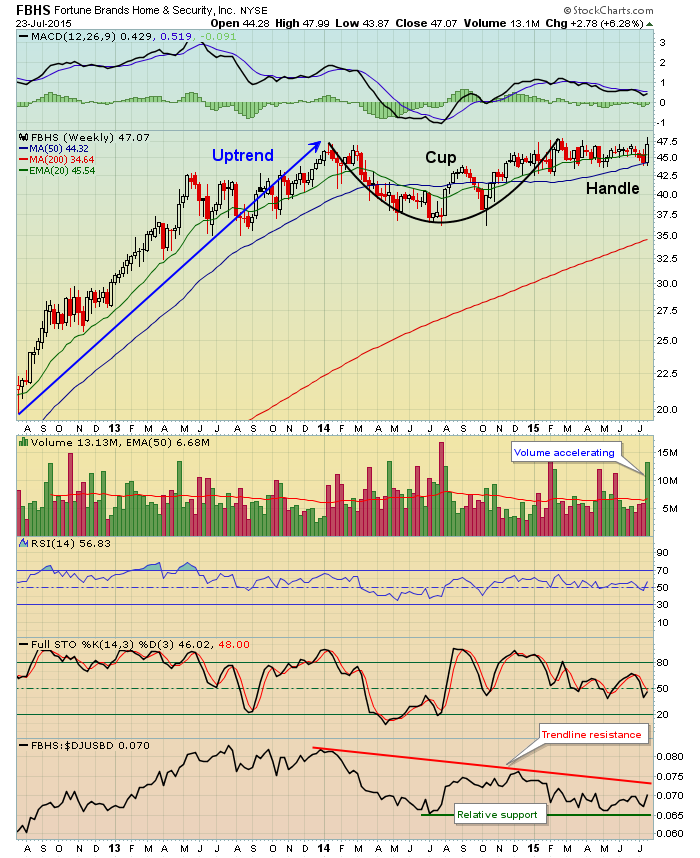
Should FBHS Be A Fixture In Your Portfolio?
by Tom Bowley,
Chief Market Strategist, EarningsBeats.com
Fortune Brands Home & Security, Inc (FBHS) surged in volume today and appeared to be on its way to a breakout above closing price resistance near 48.00. FBHS actually printed an intraday high of 47.99 before reversing and finishing weak the final two hours. From the weekly chart...
READ MORE
