MEMBERS ONLY

VARIOUS MARKET MEASURES SHOW AN OVERBOUGHT STOCK MARKET

by John Murphy,
Chief Technical Analyst, StockCharts.com
BOLLINGER BANDS SHOW OVER-EXTENDED MARKET... There are several ways to measure when a market has moved into overbought territory and is vulnerable to some profi-taking. One way is to use longer-range Bollinger bands. I've written in the past about converting weekly and monthly signals into...
READ MORE
MEMBERS ONLY

RETAIL HOLDERS NEAR RECORD HIGH -- GAP HITS 52-WEEK HIGH BUT STILL LOOKS CHEAP -- TARGET AND KOHLS ARE RETAIL LEADERS -- RISING DOLLAR KEEPS COMMODITIES UNDER PRESSURE
by John Murphy,
Chief Technical Analyst, StockCharts.com
RETAIL HOLDERS ARE TESTING 2005 HIGHS... A lot of attention has been paid lately to upside breakouts by the Dow Industrials to record highs and the S&P 500 to a five and half year high. Chart 1 shows a market group that may be on the verge of...
READ MORE
MEMBERS ONLY

KLA-TENCOR LEADS STRONG SEMICONDUCTORS -- GENENTECH JOINS BIOTECH RALLY -- NVIDIA AND GOOGLE HELP BOOST NASDAQ --- NASDAQ 100 STILL SHOWING UPSIDE LEADERSHIP
by John Murphy,
Chief Technical Analyst, StockCharts.com
GENENTECH TURNS UP... Last week I showed upside breakouts in the biotech group. I focused on Amgen which is the bellwether of the group and one of its biggest stocks. Here's another big one. Chart 1 shows Genetech (DNA) moving up to challenge its July high. The green...
READ MORE
MEMBERS ONLY
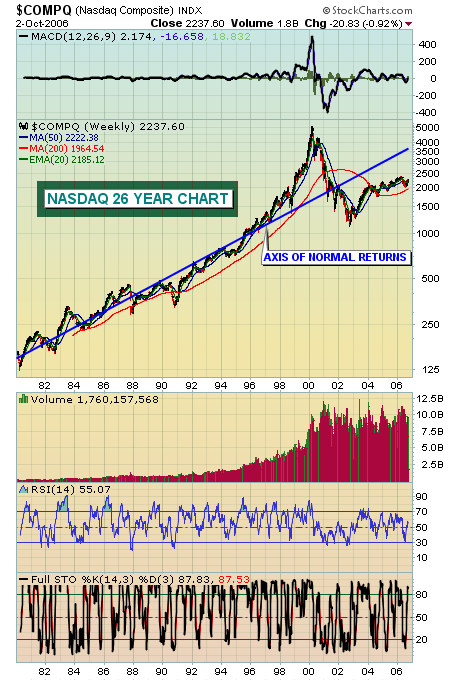
IS IT TOO LATE TO CATCH THE NASDAQ TRAIN?
After a decent run up in stock prices, one of the questions always heard is "is it too late to buy?" Well, there's never a guaranteed right answer and a lot of analysts would say the bull market is long in the teeth and has run...
READ MORE
MEMBERS ONLY
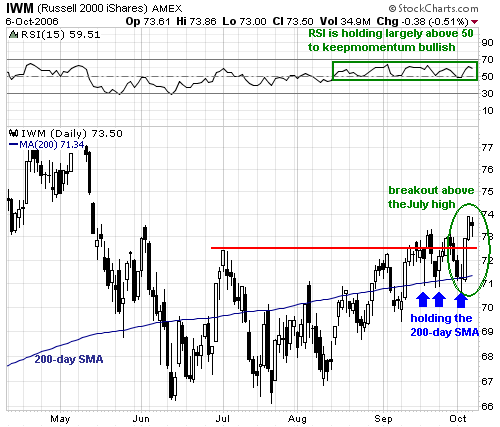
RUSSELL 2000 PERKS UP
After lagging QQQQ and SPY throughout September, the Russell 2000 iShares (IWM) got into the action last week with a surge from 71 to 74 (4.2%) on Wednesday and Thursday. The ETF remains well below its May high and is still lagging over the last few months, but this...
READ MORE
MEMBERS ONLY
MARKET HITS OVERHEAD RESISTANCE
The structure that has dominated the price pattern for nearly three years is a rising trend channel, which I have drawn on the S&P 500 chart below. As you can see, the price index has once more encountered the top of that channel, and that resistance will probably...
READ MORE
MEMBERS ONLY
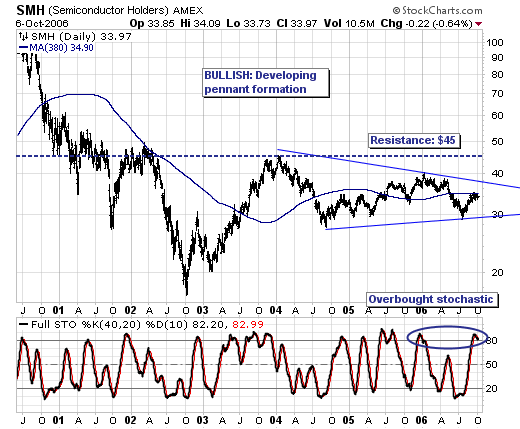
RALLYING TECH SHARES
The sharp technology share rally has caught many "off-sides" to be sure. Take for example the NASDAQ 100 "Q's" +13.4% rise off their June low; this is quite impressive indeed...but not as impressive as the +19.7% gain in the Semiconductor...
READ MORE
MEMBERS ONLY
HARDWARE UPGRADES
JOHN MURPHY ON THE RADIO - In case you missed it, John Murphy was on Invested Central's radio broadcast during last Friday's afternoon show. He discussed the current direction of the market and what was driving its current direction. You can listen to the program online right...
READ MORE
MEMBERS ONLY
DOLLAR SURGES ON STRONG JOB REPORT
The dollar is having one of its strongest days in months. Part of the reason is the drop in the U.S. September unemployment rate and some upward revisions in recent job creation. The report diminished hopes for rate reductions by the Fed in the near future. In addition, Japanese...
READ MORE
MEMBERS ONLY
WHAT HISTORY TEACHES US
Hello Fellow ChartWatchers!
Did you know that this is the most important time of the year for ChartWatchers that are looking to invest for the mid- to long-term? It is. Mention the month October to many investors and you will see them grow pale. "What about the 554...
READ MORE
MEMBERS ONLY

DOLLAR SURGES ON STRONG JOB REPORT -- DOLLAR STRENGTH EXPLAINS COMMODITY WEAKNESS -- AND WHY FOREIGN STOCKS ARE LAGGING THE US -- CANADA AND JAPAN ARE BEING HURT BY FALLING COMMODITIES
by John Murphy,
Chief Technical Analyst, StockCharts.com
EURO AND YEN TUMBLE ... The dollar is having one of its strongest days in months. Part of the reason is the drop in the U.S. September unemployment rate and some upward revisions in recent job creation. The report diminished hopes for rate reductions by the Fed in the near...
READ MORE
MEMBERS ONLY

WHY NASDAQ MAY PROVIDE GOOD VALUE -- LARGE CAP LEADERSHIP MAY HAVE STAYING POWER -- GE BREAKS OUT -- AMGEN LEADS BIOTECHS AND QQQQ HIGHER
by John Murphy,
Chief Technical Analyst, StockCharts.com
NASDAQ IS UNDERVALUED RELATIVE TO THE BIG BOARD ... Earlier in the week I wrote a piece on the relationship between the Nasdaq and the S&P 500. One of our readers suggested using the NYSE Composite Index in place of the S&P because of its smaller reliance...
READ MORE
MEMBERS ONLY

DOW COMPOSITE IMPROVES -- INTERNET LEADS NASDAQ TO FIVE-MONTH HIGH -- NEW CONSUMER DISCRETIONARY LEADERSHIP -- EARLY OIL PEAK MAY HAVE CAUSED EARLY FOUR-YEAR LOW
by John Murphy,
Chief Technical Analyst, StockCharts.com
DOW COMPOSITE BREAKS RESISTANCE LINE ... With all of the attention focused on the new record high reached by the Dow Industrials, I thought it a good time to revisit the Dow Jones Composite Index. The DJA includes all 65 stocks in the three Averages (30 industrials, 20 transports, and 15...
READ MORE
MEMBERS ONLY

A LOT OF NEGATIVE DIVERGENCES ARE STILL PRESENT ON THE CHARTS -- WATCHING THE NASDAQ RS LINE FOR SIGNS OF LEADERSHIP -- A REVIEW OF THE FOUR-YEAR CYCLE
by John Murphy,
Chief Technical Analyst, StockCharts.com
DOW TRANSPORTS AREN'T CONFIRMING INDUSTRIAL STRENGTH... Last Friday I gave a longer-term look at a lot of market indexes to demonstrate that the 2000 high hadn't been all that important to many of them. Some of them had already exceeded that long-term peak while...
READ MORE
MEMBERS ONLY

ALTHOUGH THE DOW IS TESTING ITS 2000 PEAK, SOME MARKET INDEXES HAVE ALREADY REACHED NEW RECORDS AND SOME AREN'T EVEN CLOSE -- THE DOW FELL THE LEAST AFTER 2000 AND HAS RISEN THE LEAST SINCE 2003
by John Murphy,
Chief Technical Analyst, StockCharts.com
THE TWO OTHER DOW AVERAGES HAVE EXCEEDED THAT HIGH ... Everyone's attention is fixed on the Dow Jones Industrials' challenge of the all-time high reached in January 2000. Which begs the question as to how significant that previous peak has been for the entire market. For a...
READ MORE
MEMBERS ONLY

A LOOK AT DOW LEADERS AS IT TESTS ALL-TIME HIGH -- MOST DOW STOCKS AREN'T EVEN CLOSE TO NEW RECORDS -- GE TRIES TO PLAY CATCH-UP
by John Murphy,
Chief Technical Analyst, StockCharts.com
DOW IS TESTING ITS ALL-TIME HIGH ... If you read newspapers or listen to radio or TV, you're no doubt aware that the Dow Industrials are within a hair of their January 2000 intra-day record at 11750. Chart 1 shows the Dow approaching that very important test....
READ MORE
MEMBERS ONLY

GOLD AND ENERGY STOCKS ARE BOUNCING OFF CHART SUPPORT AS DOW TESTS MAY HIGH
by John Murphy,
Chief Technical Analyst, StockCharts.com
ENERGY STOCKS BOUNCE OFF 2006 LOWS... Over the last couple of months, energy stocks have gone from one of the market's strongest groups to one of the weakest. At the same time, energy prices have fallen sharply. Charts 1 and 2 show, however, that both markets are attempting...
READ MORE
MEMBERS ONLY

A BULLISH AND BEARISH CASE FOR THE DOLLAR -- THE YIELD CURVE IS POTENTIALLY BEARISH -- GLOBAL MONEY FLOWS, HOWEVER, COULD SUPPORT THE DOLLAR -- WATCHING THE LOONIE
by John Murphy,
Chief Technical Analyst, StockCharts.com
INVERTED YIELD CURVE IS POTENTIALLY DOLLAR BEARISH ... Last Thursday I showed a potential "head and shoulders" bottom forming in the U.S. Dollar. I received a number of e-mails questioning a bullish case for the dollar. The main bearish argument for the dollar has to do with...
READ MORE
MEMBERS ONLY

RELATIVE WEAKNESS IN EMERGING MARKTS AND SMALL CAPS SHOWS MORE RISK AVERSION -- SO DOES THE BUYING OF BONDS AND DIVIDEND-PAYING STOCKS -- DOW'S LEADERSHIP COMING FROM DRUGS AND TELECOM
by John Murphy,
Chief Technical Analyst, StockCharts.com
EMERGING MARKETS ARE UNDERPERFORMING ... Yesterday I wrote about how foreign markets had been underperforming the U.S. market since May. I also recently wrote that the peak in commodity markets could start to have a negative impact on countries tied to commodity markets like Canada as well as emerging markets....
READ MORE
MEMBERS ONLY

FIRMING DOLLAR PULLS COMMODITIES LOWER -- GOLD / DOLLAR LINK REMAINS STRONG -- HEAD AND SHOULDERS DOLLAR BOTTOM?
by John Murphy,
Chief Technical Analyst, StockCharts.com
STRONGER DOLLAR HURTS COMMODITIES... One of the constant intermarkets principles is that the U.S. Dollar trends in the opposite direction of commodity prices. Chart 1 shows how well that inverse relationship has worked over the last sixteen years. Notice in particular that the major peak in the Dollar Index...
READ MORE
MEMBERS ONLY

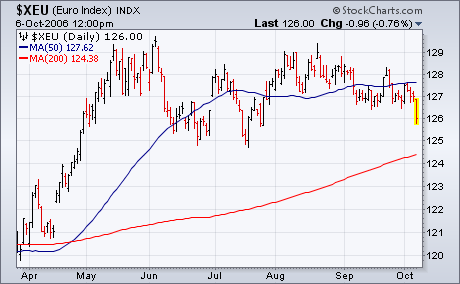
FIRMING DOLLAR IS CAUSING WORLD MARKETS TO LAG BEHIND THE U.S. -- WORLD INDEX HAS ALREADY REACHED MAJOR RESISTANCE BARRIER
by John Murphy,
Chief Technical Analyst, StockCharts.com
WORLD INDEX IS LAGGING BEHIND THE US ... I ended last night's message with the following chart to show that foreign stocks have been lagging behind the U.S. during the recent rally. The black bars in Chart 1 show the S&P 500 challenging its May peak....
READ MORE
MEMBERS ONLY

MARKET RALLIES ON FED INACTION -- NASDAQ REGAINS ITS 200-DAY LINE -- ORACLE BOOSTS SOFTWARE HOLDERS
by John Murphy,
Chief Technical Analyst, StockCharts.com
FED HOLDS RATES STEADY... To no one's surpise, the Fed left short-term rates unchanged today. The combination of falling commodity prices, lower inflation numbers, and the threat from a weak housing sector made another rate hike highly unlikely. The market was rallying into the news and stayed...
READ MORE
MEMBERS ONLY

WEAK HOUSING AND NEGATIVE PPI BOOST BONDS -- YAHOO PULLS NASDAQ BELOW 200-DAY AVERAGE -- S&P 500 STRUGGLES NEAR MAY PEAK
by John Murphy,
Chief Technical Analyst, StockCharts.com
BOND ETF HITS NEW HIGH ... Chart 1 shows the 7-10 Year Treasury Bond ETF (IEF) over the last eighteen months. I showed a similar chart last Friday to demonstrate how lower inflation pressures (signalled by falling commodity prices) were giving a boost to bond prices. We're seeing...
READ MORE
MEMBERS ONLY
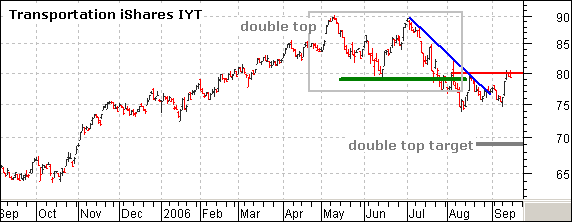
TRANSPORTS NOT OUT OF THE WOODS YET
The Dow Transportation iShares (IYT) recovered nicely this week, but the ETF is meeting resistance from broken support and a little more work is required for an upside breakout. On the daily chart, IYT formed a double top and confirmed this bearish reversal pattern with a break below the June...
READ MORE
MEMBERS ONLY
MARKET OVERBOUGHT BUT SENTIMENT STILL FAVORS BULLS
The S&P 500 Index is approaching new 52-week highs, but there is short-term overhead resistance immediately ahead, and our primary medium-term indicators are becoming modestly overbought. Does this spell trouble for the bulls? Probably not. Overbought conditions are not necessarily a problem in a bull...
READ MORE
MEMBERS ONLY
IS THE CORRECTION OVER?
Last week's commodity market decline was the most severe since 1980; which of course begs the question "is the correction over"? We don't believe that to be the case, as follow on selling will materialize taking prices far lower than one can believe.
In...
READ MORE
MEMBERS ONLY
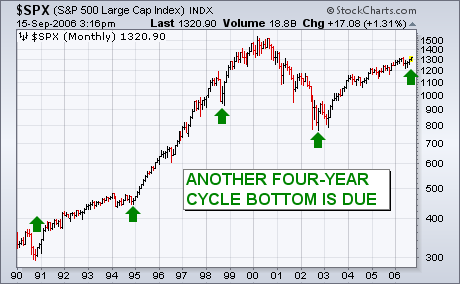
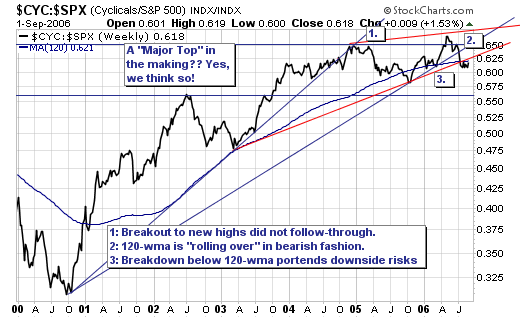
WHAT ABOUT THE FOUR-YEAR CYCLE
I've received a number of questions on the status of the four-year cycle. The stock market has shown a very consistent pattern of forming important bottoms every four years - usually during the fourth quarter. The last bottom took place in October 2002, which makes another one due...
READ MORE
MEMBERS ONLY
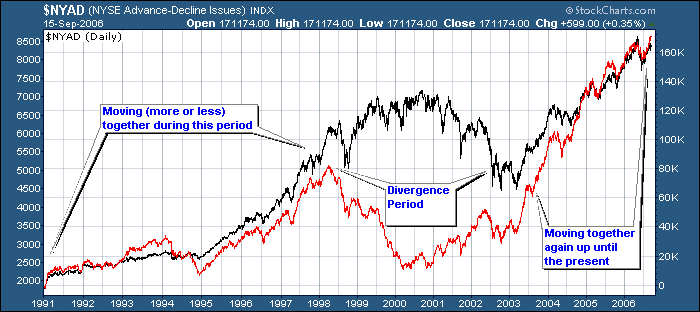
THE IMPORTANCE OF THE NY A-D LINE
Hello Fellow ChartWatchers!
OK, do I really need to write an article explaining this picture?
Seriously, there are more than the proverbial thousand words in the chart above. The NY Advance-Decline Line (the red one) is defined as the cumulative total of the daily NYSE advancers minus the daily...
READ MORE
MEMBERS ONLY

FALLING CRB BOOSTS BONDS -- ROTATION OUT OF ENERGY INTO CONSUMER DISCRETIONARY STOCKS -- BULLISH PERCENT INDEX TURNS UP -- FOUR-CYCLE LOW IS DUE THIS YEAR -- FALLING COMMODITIES ARE HURTING CANADA
by John Murphy,
Chief Technical Analyst, StockCharts.com
FALLING COMMODITIES BOOST BOND PRICES... The biggest story in the financial markets has been the breakdown in commodity prices and energy in particular. One of the immediate beneficiaries of falling commodities is usually the bond market. That's because bond prices are very sensitive to inflation trends. Historically, bond...
READ MORE
MEMBERS ONLY

BROKERS BREAKOUT TO THE UPSIDE -- THAT'S GOOD NEWS FOR THE MARKET -- RECENT ROTATIONS SHOW MORE OPTIMISTIC MOOD
by John Murphy,
Chief Technical Analyst, StockCharts.com
BROKERS PLAY CATCH-UP TO FINANCIALS ... The financial sector has been one of the market's strongest groups all year. That can be seen by the rising relative strength ratio of the Financials Sector SPDR (XLF) in Chart 1. Chart 1 also shows the XLF trading above its May...
READ MORE
MEMBERS ONLY

FALLING ENERGY PRICES BOOST RETAILERS WHICH SHOW NEW LEADERSHIP -- FALLING BOND YIELDS BOOST OVERSOLD HOMEBUILDERS -- DOW HITS NEW FOUR-MONTH HIGH
by John Murphy,
Chief Technical Analyst, StockCharts.com
FALLING OIL BOOSTS RETAILERS ... Over the last year, one of the market sectors most hurt by rising energy prices has been retailers. With oil prices falling to a five-month low, however, retailers have become one of the market's strongest groups. To show how closely the two markets...
READ MORE
MEMBERS ONLY

GOLD BREAKS ITS SUMMER LOWS AS COMMODITY PRICES CONTINUE TO FALL -- CRB INDEX HITS NEW 2006 LOW -- THAT MAY BE GOOD NEWS ON INFLATION BUT HINTS AT ECONOMIC SLOWING
by John Murphy,
Chief Technical Analyst, StockCharts.com
GOLD TUMBLES BELOW SUMMER LOW... Gold and silver have succumbed to selling pressure that has weighed on most commodity markets over the last month. With energy prices falling, and the CRB Index having broken its summer low, the entire commmodity price structure is crumbling. I thought that a weaker dollar...
READ MORE
MEMBERS ONLY

SEPTEMBER SELLING CONTINUES -- MACD LINES TURN NEGATIVE -- MACD HISTOGRAM GAVE EARLIER SIGNAL OF A WEAK RALLY
by John Murphy,
Chief Technical Analyst, StockCharts.com
S&P GIVES SHORT-TERM SELL SIGNAL ... The market continued its early September slide today. Several of our short-term technical indicators have turned negative. One of them them is the daily MACD (which happens to be one of my favorite indicators). Chart 1 shows the S&P...
READ MORE
MEMBERS ONLY

GOLD FALLS ON FIRMER DOLLAR -- FALLING ENERGY PRICES PULL CRB EVEN LOWER -- COMMODITY ETF IS ALSO ON THE DEFENSIVE
by John Murphy,
Chief Technical Analyst, StockCharts.com
GOLD ETF GAPS DOWN ... The price of gold is falling pretty hard today. By early afternoon, the Gold ETF (GLD) is down the equivalent of $16. Silver is falling as well along with most other commodities. Chart 1 puts today's gold selling into the context of its two-...
READ MORE
MEMBERS ONLY

MARKET PULLS BACK FROM OVERBOUGHT CONDITION -- SMALL CAPS AND NASDAQ ARE STILL BELOW 200-DAY LINE -- DOW TRANSPORTS REMAIN WEAK -- WATCH OUT FOR HEAVIER DOWNSIDE VOLUME IN SEPTEMBER
by John Murphy,
Chief Technical Analyst, StockCharts.com
SMALL CAPS CONTINUE TO LAG ... Last Friday I showed the Nasdaq Composite entering a resistance zone marked by its early July peak at 2190 and its 200-day moving average. I wrote that what the Nasdaq did in that zone would tell us a lot about its real strength and...
READ MORE
MEMBERS ONLY

GOLD INDEXES BREAKOUT TO THE UPSIDE AS GOLD JUMPS $13 -- FREEPORT MCMORAN COPPER AND GOLD BREAKS OUT ON METAL GAINS
by John Murphy,
Chief Technical Analyst, StockCharts.com
GOLD INDEXES BREAK OUT... Both of the precious metal stock indexes that I follow are breaking out to the upside today. Charts 1 shows the AMEX Gold Bugs Index (HUI) breaking through its summer highs to the highest level since mid-May. Chart 2 shows the PHLX Gold & Silver...
READ MORE
MEMBERS ONLY
RYDEX RATIO IMPLIES PRICES WILL GO HIGHER
After the decline that lasted from the beginning of May to mid-June, a second bottom was made in July, from which the current rally emerged. Both the bottoming process and the rally have been rough and tedious, causing a lot of anxiety among market participants, and resulting in strong,...
READ MORE
MEMBERS ONLY
GOLDILOCKS AND THE BEARS
While many believe a "goldlilocks" soft-landing is forthcoming for the US economy; we think the probability of this occurring is rather small given the ongoing weakness in the housing market. That said, we are bearish on equities given our overbought indicators, and the fact this rally is...
READ MORE
MEMBERS ONLY
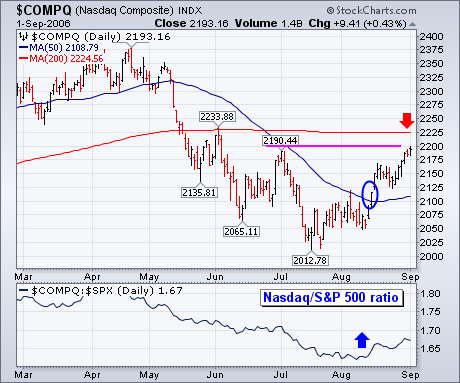
NASDAQ NEARS MOMENT OF TRUTH
It's very hard for the stock market to stage a major advance without help from the Nasdaq market. Fortunately, it's been getting some Nasdaq help since mid-July. The chart below shows the Nasdaq Composite gaining nearly 200 points (10%) since mid-July. The actual signal...
READ MORE
MEMBERS ONLY
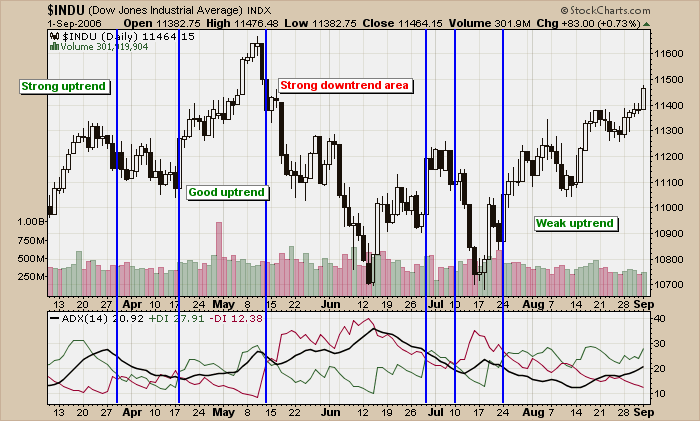
TRENDING UP, DOWN OR SIDEWAYS?
Trend analysis is one of the most important technical analysis skills anyone can have. Knowing if a stock is trending or oscillating can have a big impact on what kind of approach you take to trading it. Stocks that are in a strong uptrend should be bought and held until...
READ MORE
