MEMBERS ONLY

How Long Can the Fed Hold Off Raising Rates?

As interest rates around the world break to the upside, how long can the U.S. hold out against the trend?... READ MORE
As interest rates around the world break to the upside, how long can the U.S. hold out against the trend?... READ MORE


Sentiment has turned more bearish, but is it bearish enough to signal a market low? Join Dave Keller as he reviews the VIX, AAII survey, NAAIM exposure, and put/call ratios to show why conditions may not be extreme just yet.... READ MORE


Before We Dive In… You’re looking at two stocks. Both seem promising. Both are starting to move. But which one do you trade? Spend five minutes on social media forums and you’ll see this question pop up everywhere. Many traders choose based on the story, the brand, or... READ MORE


The Indian stock market declined this week, ending marginally in the red. Volatility remains elevated, suggesting nervousness among investors. Milan Vaishnav dissects the charts and suggests a defensive approach in the coming week.... READ MORE


How long will oil prices stay elevated? Mary Ellen McGonagle analyzes the industry against the backdrop of the broader market.... READ MORE
Oil reaching above $110 is driving inflation fears and pushing interest rates higher, increasing pressure on stocks. Mary Ellen McGonagle highlights the S&P 500 breaking support, rising volatility, and which sectors are holding up vs. breaking down.... READ MORE

Mega cap leaders are beginning to weaken beneath the surface of a rangebound market. Dave Keller, CMT, highlights bearish patterns in Microsoft, Amazon, and Tesla, raising concerns that deteriorating leadership could lead to further downside for the S&P 500 and Nasdaq.... READ MORE


Breadth in the SPY, QQQ, and IWM are getting close to their 200-day moving averages. Arthur Hill looks beneath the surface and uncovers the price structure in the ETFs and analyzes the BBB spread.... READ MORE


Are you struggling to make sense of a headline-driven stock market? Learn how a simple ChartList can help you stay focused, reduce uncertainty, and spot key market reversals.... READ MORE


Hot inflation data and Fed uncertainty triggered a sharp late-day selloff in stocks and bonds. Tom Bowley breaks down weakening breadth, rising volatility, and why the S&P 500’s key support level could determine what happens next.... READ MORE


A subtle but important shift is unfolding beneath the surface of the market. Follow along as Julius de Kempenaer breaks down where leadership is quietly emerging and where weakness still hasn’t resolved.... READ MORE

A market pullback with improving sentiment may be setting up the next move higher. Follow along as Joe Rabil highlights key signals and stocks showing constructive setups.... READ MORE


Investor pessimism is spiking. Discover what the critical sentiment signals say now and bookmark these charts to catch the moment the market reverses toward optimism.... READ MORE

Before We Dive In… When the S&P 500 makes a 1% move up, it feels like the market is exhibiting strength. But is it? Sometimes an index will rise because a handful of mega-caps are doing the heavy lifting. What you don’t see are the other stocks... READ MORE
Why hasn’t the market broken down, even amid weakening breadth? Dave Keller shows how a small group of mega-cap stocks may be holding the indexes together, and the key levels that could decide the next market move.... READ MORE
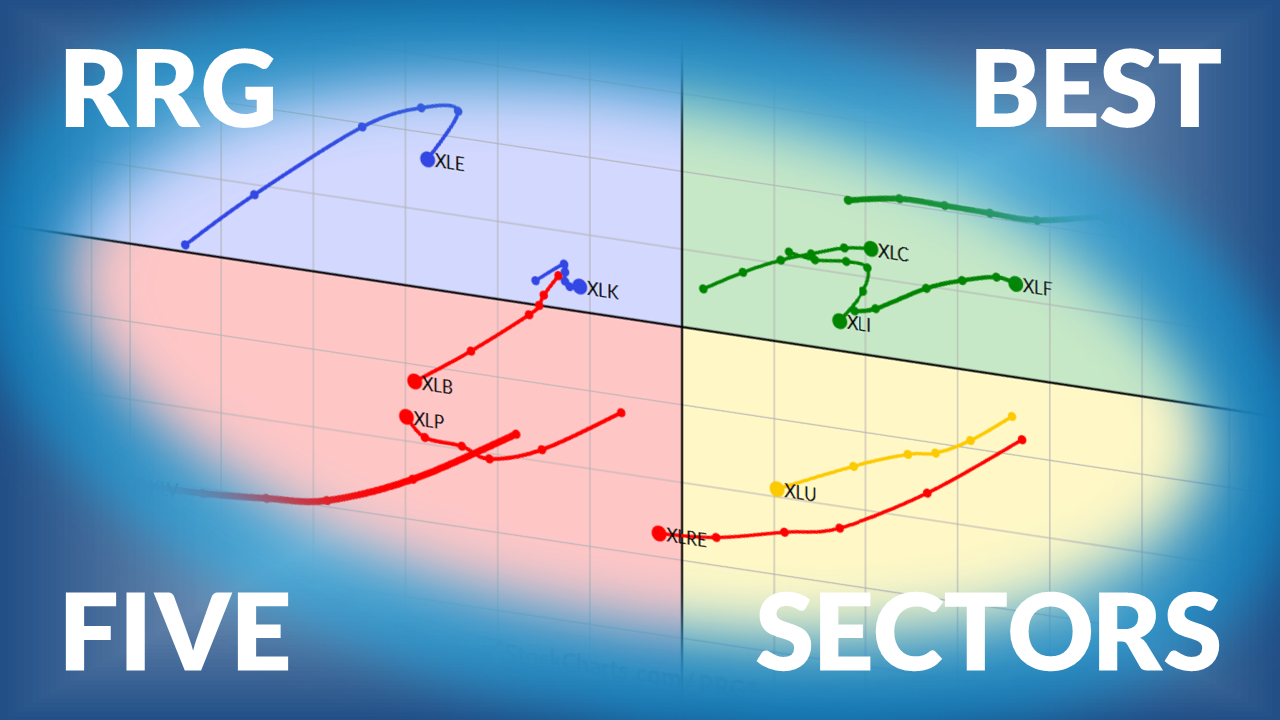
Julius de Kempenaer presents his weekly stock market update on sector rotation using Relative Rotation Graphs.... READ MORE

Defensive sectors such as Utilities, Staples, and Health Care are strengthening. Here's how you can monitor sector strength and position your portfolio appropriately.... READ MORE

Oil volatility is creating a chain reaction across markets as rising prices, fuel inflation fears, and push interest rates higher. Follow along as Mary Ellen McGonagle highlights the sectors weakening, the areas holding up, and the key levels investors should be watching.... READ MORE

Despite geopolitical tensions, the S&P 500 has held up well and is relatively close to its recent highs. When does the pullback turn into a long-term downtrend? Arthur Hill analyzes the market environment and highlights what investors should monitor.... READ MORE

The S&P 500 may look stable, but market breadth is quietly deteriorating. Dave Keller breaks down key breadth indicators and explains why weakening participation could signal trouble ahead.... READ MORE

Before the Iran conflict, the energy market had reached a point in the cycle where a major uptrend was overdue. Martin Pring does a deep dive into the technical backdrop of crude oil and shares his analysis.... READ MORE

Fear is rising across markets as volatility spikes and headlines pile up. In this video, Tom Bowley explains why key accumulation signals and improving growth leadership suggest buyers are still supporting this market.... READ MORE

The stock market is sending mixed signals. See what the charts reveal about current trends and why semiconductors may lead the next move.... READ MORE

Joe Rabil highlights several tech stocks forming constructive pullbacks that could soon trigger upside breakouts. He also reviews S&P 500 market conditions, key support levels, and how relative strength helps confirm emerging setups.... READ MORE


S&P 500 pullbacks keep attracting buyers, even as momentum signals weaken. Join Frank Cappelleri as he explains why dip-buying continues to support the market in spite of rising volatility and mixed technical signals.... READ MORE

Though Technology has been among the weakest performers of late, recent action in XLK suggests that the sector has the potential to reclaim a leadership role.... READ MORE

Nifty has slipped back and closed exactly at its 100-week moving average, which has historically been a support level. Is it at risk for more downside?... READ MORE

Even as market breadth deteriorates and the S&P 500 slips below key support, strong setups still exist. Dave Keller, CMT, highlights Marathon Petroleum, Target, and Palantir — three charts showing breakouts, trend strength, and improving momentum into March.... READ MORE

Money has moved into agricultural commodities, which offer true diversification in a portfolio. Arthur Hills analyzes the chart of DBA and zeroes in in soybeans, wheat, and livestock.... READ MORE

The stock market turned volatile as oil prices surged. Here's what the charts are telling investors about the market's next move.... READ MORE
The stock market has been rattled by geopolitical headlines, which have driven up crude oil prices. In this video, Tom Bowley shares his observations on what's happening beneath the surface.... READ MORE

Martin Pring analyzes the behavior of two inter-asset relationships, namely Stocks vs. Commodities and Stocks vs. Bonds. Read about his insights and know how to uncover the clues going forward.... READ MORE
Joe Rabil shows how a specific RSI setup can help traders identify the first pullback entry after a breakout. He also reviews S&P 500 volatility, sentiment, QQQ, IWM, and several stock setups.... READ MORE

As large-cap stocks dip to multi-month lows, some shifts are taking place that investors shouldn't ignore. Two indicators to watch are SPY distribution risk and the U.S. dollar's consolidation. Watch these charts closely.... READ MORE
With corporate earnings now behind us, investors can shift their focus to the trends taking shape in Q1. In this video, David Keller, CMT, shares the top 10 charts he's watching for March 2026, and more importantly, why they matter right now. Dave organizes his charts into three... READ MORE

Weekly update on sector rotation for US sectors using Relative Rotation Graphs®.... READ MORE

Geopolitical tensions resulted in a surge in oil prices. Here's a technical look at the charts and potential target prices.... READ MORE

With Nifty hovering about its 50-week moving average but trading below the 20-week, price action suggests a loss of upside momentum. What could it take to open the door for an up move?... READ MORE

The stock market is consolidating, not collapsing. Here's what sector rotation, moving averages, and the VIX reveal about what may come next.... READ MORE

The Mag 7 stocks have lost steam since November. However, four of the seven are showing long-term uptrends. Arthur Hill analyzes each of these charts and identifies potential reversal or continuation levels.... READ MORE