MEMBERS ONLY

The Stock Market Is Broadening Out: Three Charts Make the Case

Stock market breadth is expanding. Mary Ellen McGonagle looks at three market breadth indicators, which are showing a healthy expansion.... READ MORE
Stock market breadth is expanding. Mary Ellen McGonagle looks at three market breadth indicators, which are showing a healthy expansion.... READ MORE

Breadth in the S&P 500 and SPY is bullish, which means bullish outcomes are more likely than bearish ones. Arthur Hill analyzes market breadth in SPY and RSP and shows that the overall tone is bullish.... READ MORE


Before We Dive In… Whether you trade for the short-term or long-term, the first thing you probably do every morning is check the headlines: CNBC, Bloomberg, Fox Business, or whatever suits you. We all do this, because markets react to information. And we don't want to... READ MORE


The Consumer Staples sector is quietly staging a rally in Q2. Investors should monitor the trends in XLP:SPY and the charts of Walmart and Costco. ... READ MORE

Dave Keller explains how Ichimoku Cloud charts help traders identify bullish and bearish trend shifts using real examples from Ford, CrowdStrike, and the S&P 500. Learn how the cloud can act as dynamic support and resistance during major market moves.... READ MORE
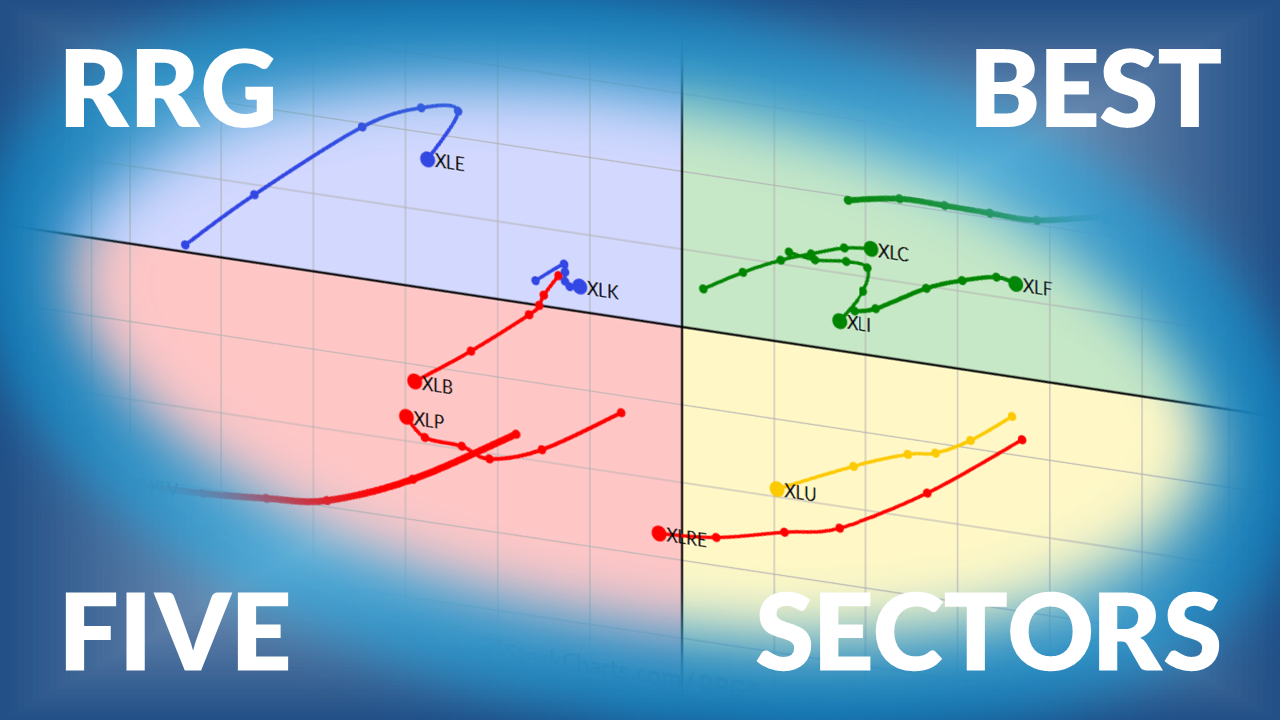

Julius de Kempenaer, creator of Relative Rotation Graphs, presents his weekly update on US sector rotation using RRG.... READ MORE


Martin Pring analyzes bond yields against CPI and international bond yields, and supports the thesis that a secular bull market is underway in U.S. Treasury yields. ... READ MORE

Healthcare stocks are showing signs of strength as earnings improve, Medicare Advantage updates lift sentiment, and GLP-1 developments fuel growth in key industry names.... READ MORE

Risk management should adapt to the chart’s trend phase. Dave Keller, CMT, compares Alphabet’s strong uptrend with Palantir’s sideways consolidation to explain how moving averages, support levels, and RSI can guide smarter stop loss and sell decisions.... READ MORE

Despite the strong move in Technology and Communication Services, Energy and Utilities have the highest percentage of stocks in uptrends. Arthur Hill analyzes these two sectors and shows that their bullish breadth may lead them higher.... READ MORE


AI stocks are driving the stock market higher, but rising yields, food prices, and weak market breadth could signal trouble beneath the surface of this bull rally.... READ MORE

Broadcom has broken to new all-time highs, but weakening momentum may signal a potential blowoff top. Dave Keller, CMT, explains how bearish momentum divergences can foreshadow major reversals, and what price and RSI signals could confirm AVGO’s next move.... READ MORE

Big winning stocks often spend months building a base before momentum begins to accelerate. Joe Rabil highlights several stocks showing signs they may be preparing for a much bigger move.... READ MORE

Retail stocks are underperforming the S&P 500. Will this change when major retailers start reporting earnings next week? These charts will paint the full picture.... READ MORE
Join David Keller as he explains how traders analyze price gaps.... READ MORE

With rising oil prices, a higher CPI is likely in the pipeline. If this is the case, how far can the CPI rise? Martin Pring studies the relationship between commodity prices and the CPI and discusses the likely outcome.... READ MORE

Is the S&P 500's 8.1% year-to-date gain entering the week on shaky footing? This analysis of the S&P 500's performance relative to other asset groups suggests that some sub-indexes and global equities are strengthening.... READ MORE

Technology stocks are once again dominating market performance, led by semiconductors and improving software charts. Dave Keller, CMT, uses breadth indicators, relative strength ratios, and sector ETFs to assess the sustainability of the 2026 tech rally and the warning signs to watch.... READ MORE

Investors are looking beyond AI and mega-cap tech as select retail and consumer stocks show strength. Here's where earnings momentum is broadening.... READ MORE

Despite Thursday's selloff, stocks remain bullish. Consumer sentiment, oil prices, and Friday's jobs report will test the market's risk-on momentum.... READ MORE


With many semiconductor names extended, Tom Bowley breaks down where money is rotating next and the key areas showing fresh strength right now.... READ MORE
Joe Rabil explains how to identify stocks showing new relative strength as they shift from weak to strong. He highlights key setups and reviews market conditions, including sentiment, volatility, and trend.... READ MORE

As the S&P 500 and technology sector push higher, select stocks are showing early signs of new uptrends. Dave Keller, CMT, highlights TTWO, RNG, and CRWD, three charts with improving momentum and key breakout levels that could confirm further upside in May.... READ MORE

Are bond prices in a new secular bear market? Martin Pring analyzes the relationship of bond prices to gold prices and the Dow Jones Transportation Index to determine the potential move in bond prices.... READ MORE

Julius de Kempenaer presents his weekly update on US sector rotation using Relative Rotation Graphs. ... READ MORE

With inflationary pressures still in play, how should investors position their portfolios heading into mid-year? Keep an eye on this key market-based barometer and sector. ... READ MORE
Mary Ellen McGonagle illustrates how earnings are driving this market, where leadership is emerging, and what’s working right now.... READ MORE

Five of the Mag 7 stocks reported earnings and sent the broader market higher. One stock among the five stood out. Mary Ellen analyzes the stock and shows why it has potential to move higher.... READ MORE

Arthur Hill presents a simple strategy for identifying long-term uptrends and short-term breakouts after corrections, using two important indicators.... READ MORE

The S&P 500, Nasdaq, and the S&P 600 closed at new highs despite inflation concerns and geopolitical tensions in the Middle East. What's driving this rally? Find out here.... READ MORE

The S&P 500 is pushing to new highs with RSI near 70, signaling strong momentum. Dave Keller, CMT, explains why overbought conditions can confirm an uptrend, how divergences warn of weakness, and what signals would indicate the current bullish phase is ending.... READ MORE
Joe Rabil explains how he measures the strength in SPX, digs into volatility, and examines some viewer-requested symbols.... READ MORE

Despite rising gas prices, earnings reports from Visa and Starbucks suggest the consumer is still resilient. Will the weakness in the Consumer Discretionary sector change the narrative? Find out here.... READ MORE

Follow along as David Keller breaks down one of his favorite technical indicators, the RSI. Dave explains what overbought and oversold really mean and how to best understand what RSI readings mean.... READ MORE

Is a primary bear market developing in gold? Martin Pring analyzes the charts of spot Gold and Silver and shows two indicators that are pointing to a possible reversal.... READ MORE

Technology is back in the top 5. Which other sectors made it to the top? Find out in this week's update on US sector rotation using Relative Rotation Graphs.... READ MORE

As oil prices rise, interest is shifting towards alternative sources such as solar, battery storage, and nuclear. NextEra and Eaton are showing signs of price breakouts and increased momentum. ... READ MORE

After surging above 7000, the S&P 500 has stalled, leaving investors to question the next move. Dave Keller, CMT, outlines four bullish and bearish scenarios through mid-June, helping investors weigh risks, opportunities, and key market signals ahead.... READ MORE

In this study, Cedric Thompson, CMT, CFA, deconstructs the S&P Bullish Percent Index and shows how it's a valuable tool for identifying high probability turning points in the S&P 500.... READ MORE

The stock market decline in March was a correction within a bull market. Arthur Hill highlights trend signals for sector ETFs and focuses on Industrials and Materials, two sectors that are set up for a bullish run. ... READ MORE