MEMBERS ONLY

Mid-Caps Make a Statement with a Breadth Thrust

by Arthur Hill,
Chief Technical Strategist, TrendInvestorPro.com
KEY TAKEAWAYS
* Short-term breadth became oversold in mid December.
* Stocks surged this week with mid-caps triggering a bullish breadth thrust.
* A small bullish divergence preceded the breadth thrust.
Mid-caps show leadership and were the first to trigger a breadth thrust. Stocks surged this week with mid-caps showing the highest participation...
READ MORE
MEMBERS ONLY

Quantum Computing: Top Stocks You Should Watch Now!

by Jayanthi Gopalakrishnan,
Director of Site Content, StockCharts.com
KEY TAKEAWAYS
* Quantum computing stocks may be bouncing back.
* Four stocks made it to the Top 10 SCTR Report in the mid-cap category.
* Watch for quantum computing stocks to gain momentum and revisit their 52-week highs.
Jensen Huang may have burst the quantum computing bubble when he said it would...
READ MORE
MEMBERS ONLY
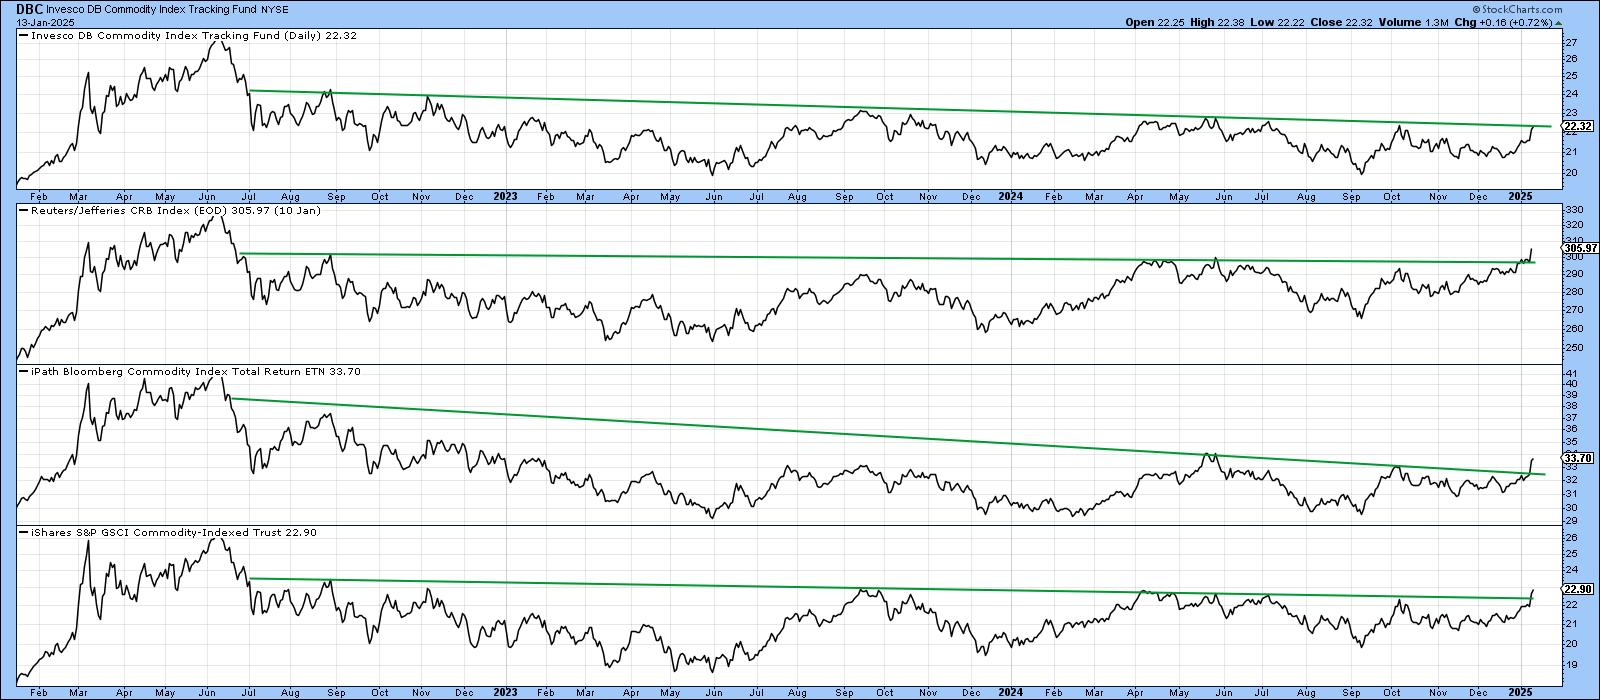
One Small Push by Commodities Could Lead to a Giant Leap for Commoditykind

by Martin Pring,
President, Pring Research
That may seem like a strange title, but it is intended to make the point that commodities look as though they are in the process of breaking out. Furthermore, this breakout, if successful, would jump-start a finely balanced long-term technical position into a primary bull market, all courtesy of our...
READ MORE
MEMBERS ONLY

Market Pullbacks Provide Opportunities <BR>to Build your WatchList - Here's How

by Arthur Hill,
Chief Technical Strategist, TrendInvestorPro.com
KEY TAKEAWAYS
* ETFs holding up during corrections often lead when the market turns up again.
* Ranking performance based on year-to-date and one month Rate-of-Change.
* ARTY and IHI show relative and absolute strength.
The stock market is in pullback mode with the S&P 500 EW ETF down 5.15%...
READ MORE
MEMBERS ONLY
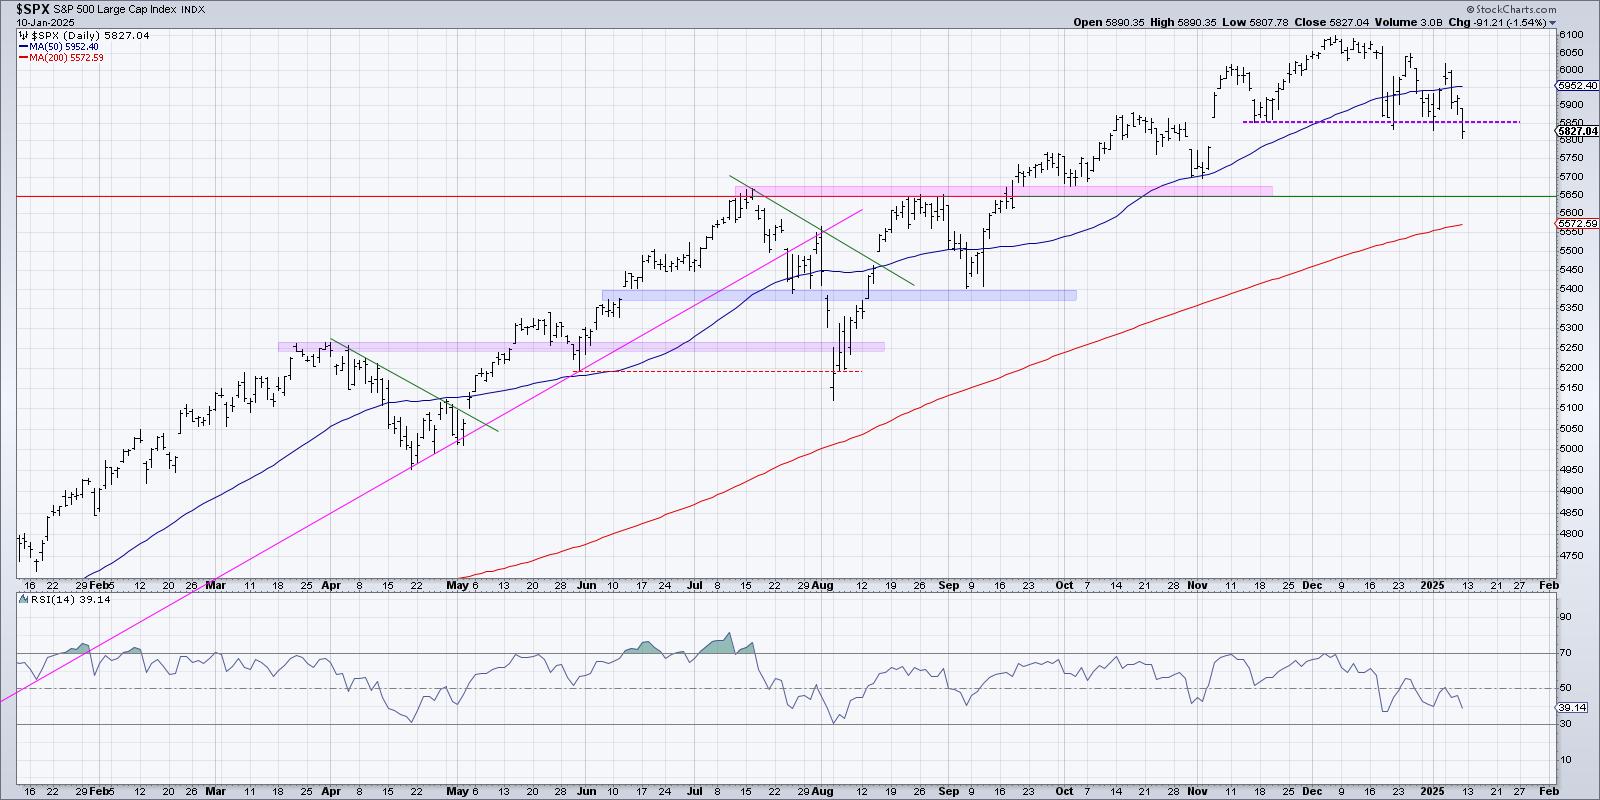
S&P 500 Breakdown Alert! Downside Targets Explained

by David Keller,
President and Chief Strategist, Sierra Alpha Research
KEY TAKEAWAYS
* The break of SPX 5850 suggests further downside in January for the equity benchmarks.
* Using price pattern analysis, we can use the height of the head and shoulders pattern to determine potential support around SPX 5600.
* We can further validate this downside target using Fibonacci Retracements and moving...
READ MORE
MEMBERS ONLY
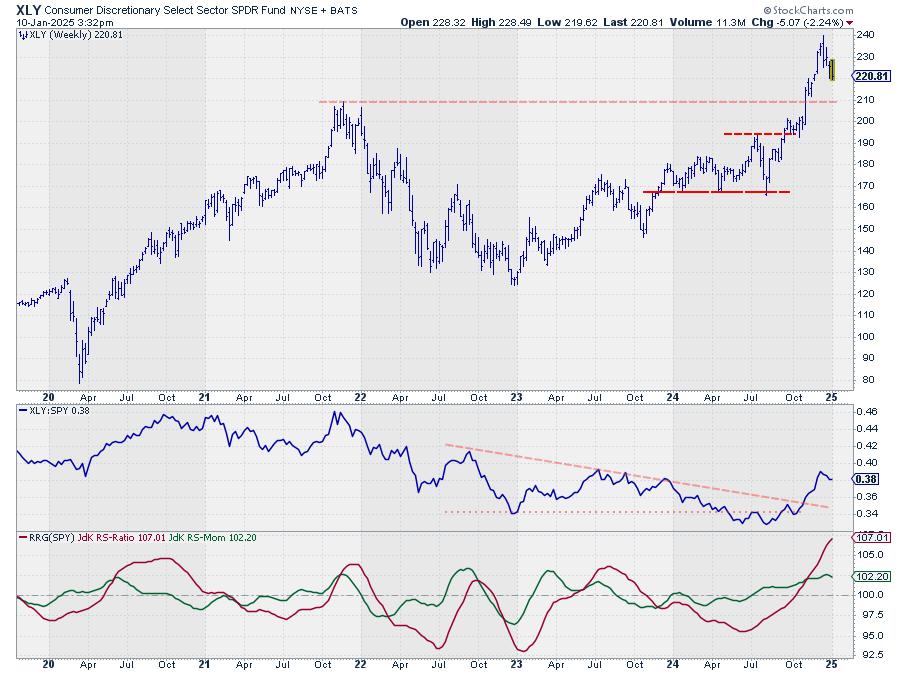
The Best Five Sectors, #2

by Julius de Kempenaer,
Senior Technical Analyst, StockCharts.com
KEY TAKEAWAYS
* The best five sectors remain unchanged.
* XLC and XLF are both starting to show weakness.
* XLI is holding above support, while XLK remains within rising channel.
The composition of the top five sectors remains unchanged this week, despite an interrupted trading week. This stability comes against a backdrop...
READ MORE
MEMBERS ONLY
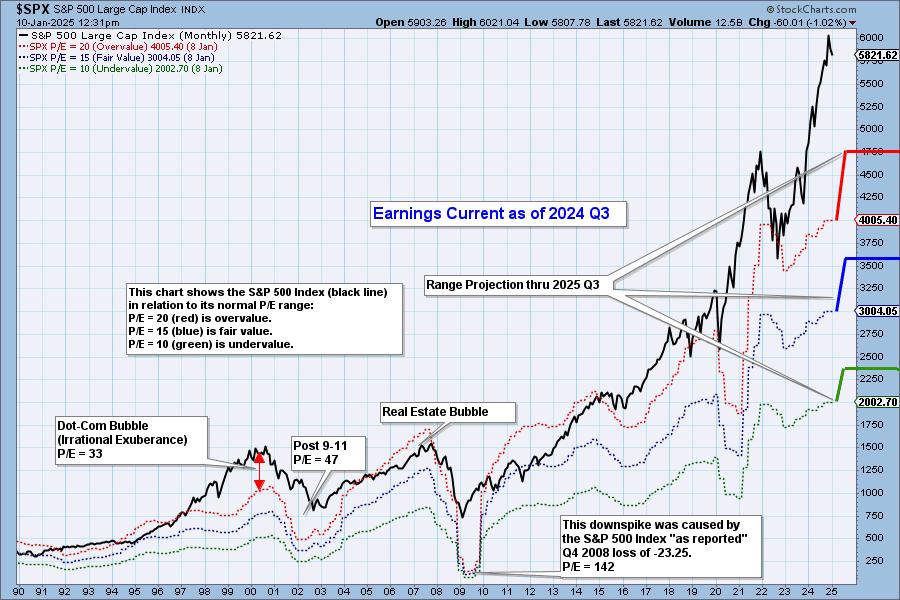
S&P 500 Earnings 2024 Q3: Still Overvalued

by Carl Swenlin,
President and Founder, DecisionPoint.com
S&P 500 earnings are in for 2024 Q3, and here is our valuation analysis.
The following chart shows the normal value range of the S&P 500 Index, indicating where the S&P 500 would have to be in order to have an overvalued P/E...
READ MORE
MEMBERS ONLY

Boston Scientific's Record Surge: Here's How I Found It

by Karl Montevirgen,
The StockCharts Insider
KEY TAKEAWAYS
* StockCharts' New Highs tool is invaluable for spotting outliers during market uncertainty.
* In the case of BSX stock, the New Highs spotted a stock that's significantly defied the healthcare sector's bearish trend.
* BSX may soon be approaching a buy point if you'...
READ MORE
MEMBERS ONLY

What Higher Rates Could Mean for the S&P 500

by David Keller,
President and Chief Strategist, Sierra Alpha Research
KEY TAKEAWAYS
* Higher interest rates can directly impact industry groups like homebuilders, which are driven by consumers borrowing money.
* While a normal shaped yield curve suggests optimism for economic growth, the transition from an inverted yield curve usually results in weaker stock prices.
* The market trend remains the most important...
READ MORE
MEMBERS ONLY

When to Pull the Trigger: Identifying the BEST Entry Point

by Joe Rabil,
President, Rabil Stock Research
In this exclusive StockCharts video, Joe shares how to identify the best entry point by using two timeframes, Moving Averages, MACD and ADX. He shows two different examples of when to pull the trigger. Joe highlights weakness in the Large Cap universe, and finally goes through the symbol requests that...
READ MORE
MEMBERS ONLY
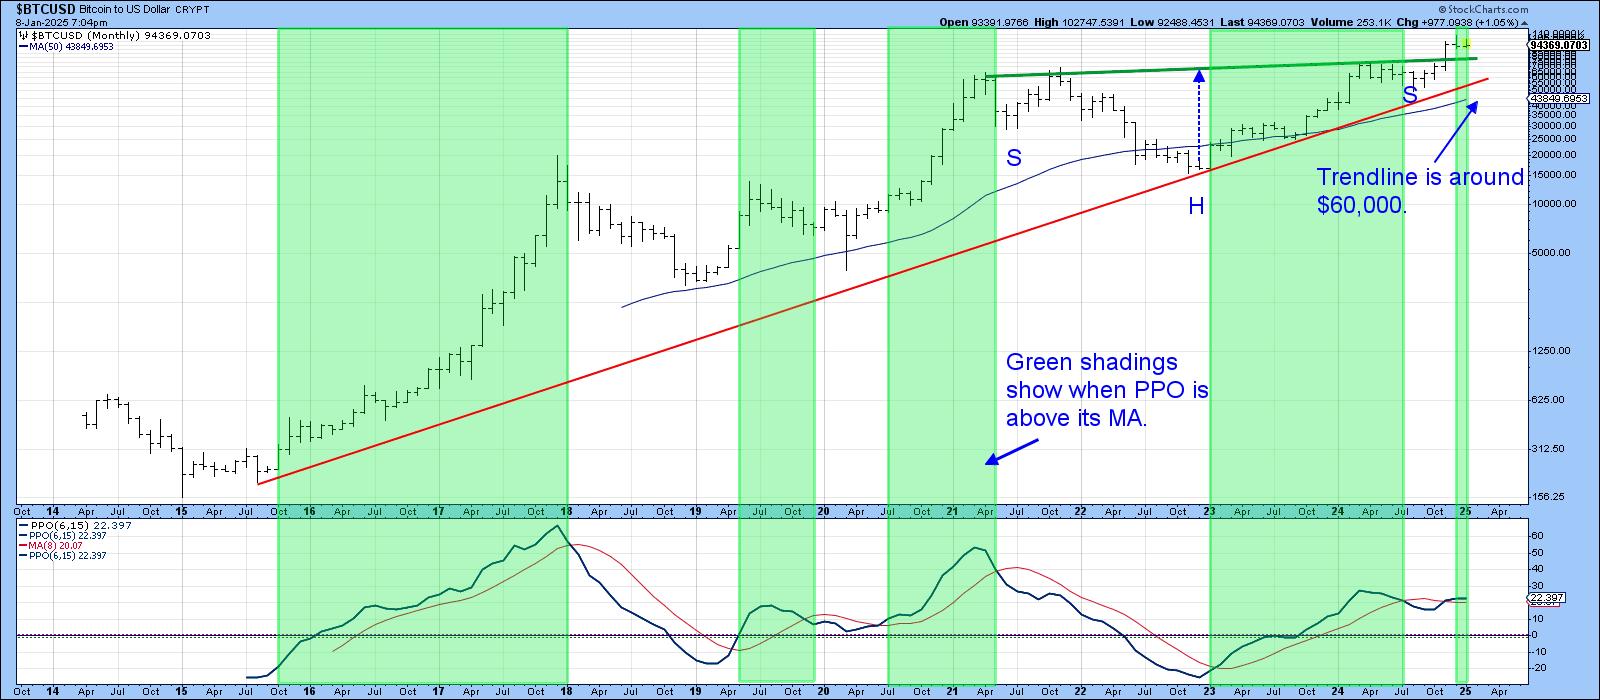
Is The First Domino About to Fall for the Bitcoin Bull Market?

by Martin Pring,
President, Pring Research
The Long-Term Picture
No market goes up forever and, at some point, Bitcoin will top out. It's currently down about 12% from its peak, set on December 17 less than 4 weeks ago, so there is scant evidence at this point indicating a primary bear market. For example,...
READ MORE
MEMBERS ONLY

Which Top AI Semiconductor Stocks are Positioned for Growth?

by Karl Montevirgen,
The StockCharts Insider
KEY TAKEAWAYS
* CES 2025 kicks off this week with many products likely to feature AI functionalities.
* Semiconductors are among the backbone components driving AI tech.
* Be sure to monitor the general industry and focus on key semiconductor stocks, a few of which may be approaching buy points.
On Tuesday, January...
READ MORE
MEMBERS ONLY

Rising Rates Suggest Weaker Stocks - Here's What I'm Watching!

by David Keller,
President and Chief Strategist, Sierra Alpha Research
In this video, Dave shares a long-term analysis of the Ten-Year Treasury Yield, breaks down how the shape of the yield curve has been a great leading indicator of recessionary periods and weaker stock prices, and outlines the chart he's watching to determine if early 2025 will look...
READ MORE
MEMBERS ONLY

DP Trading Room: Does This Rally Have Legs?

by Erin Swenlin,
Vice President, DecisionPoint.com
In today's free DP Trading Room Carl and Erin discuss whether this market rally can get legs and push the market even higher? Mega-caps are looking very positive with the Magnificent Seven leading the charge. Technology is showing new strength along with Communication Services.
Carl starts the trading...
READ MORE
MEMBERS ONLY

How to Trade Erratic Uptrends - An Example and Setup using IWM

by Arthur Hill,
Chief Technical Strategist, TrendInvestorPro.com
KEY TAKEAWAYS
* The Russell 2000 ETF (IWM) gained 10% in 2024 - but did it the hard way.
* Even when trending higher, IWM is prone to pullbacks and erratic price action.
* Chartists can put this to their advantage by using %B to identify tradable pullbacks.
The Russell 2000 ETF managed...
READ MORE
MEMBERS ONLY
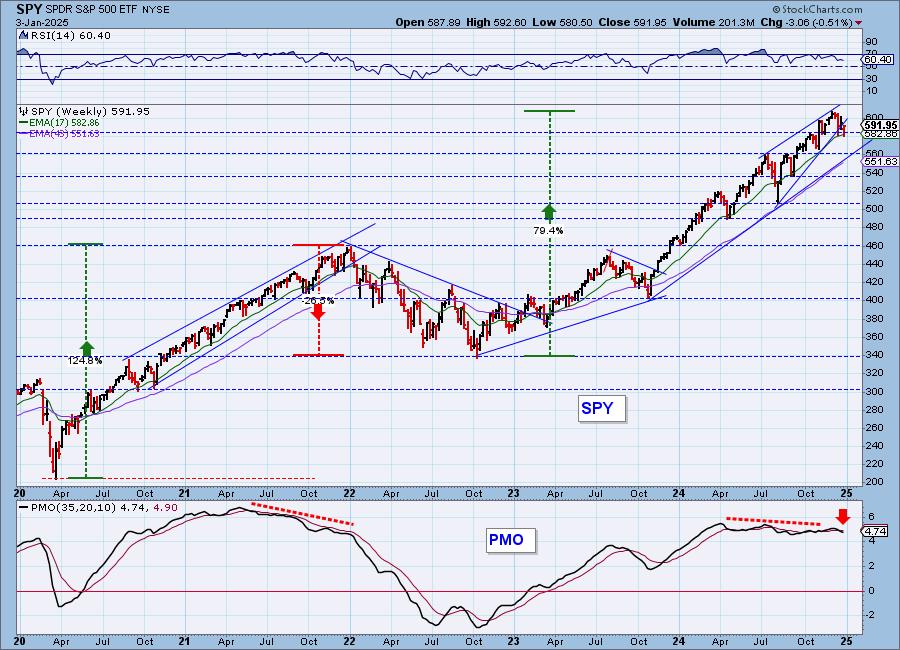
SPY Weekly Chart Breaking Down

by Erin Swenlin,
Vice President, DecisionPoint.com
We monitor the weekly SPY chart and present it to our subscribers every Friday in our DP Weekly Wrap. We have been watching a bearish rising wedge on the weekly chart. The rising wedge pattern implies that you will get a breakdown from the rising bottoms trendline. That is exactly...
READ MORE
MEMBERS ONLY
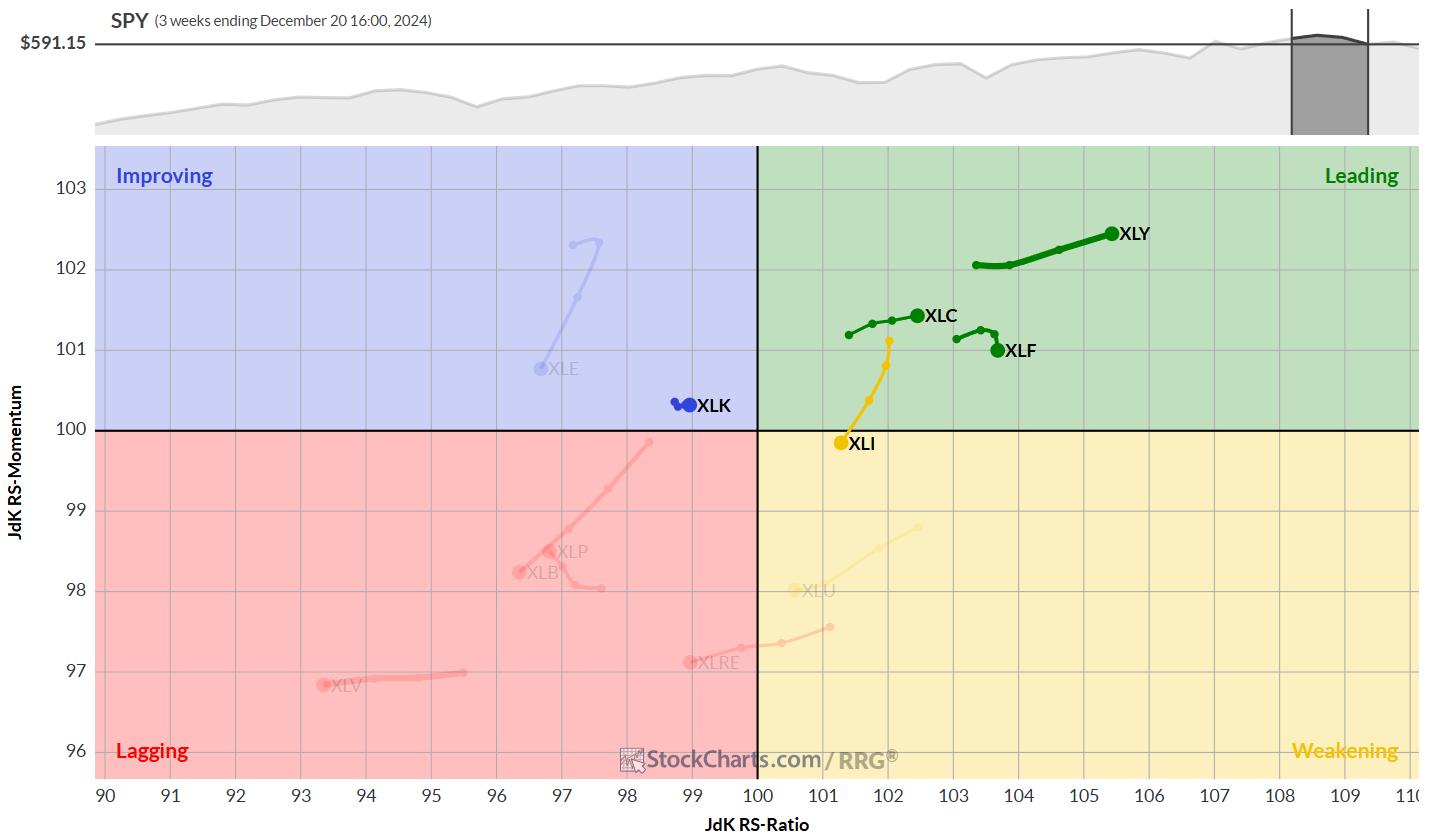
The Best Five Sectors, #1

by Julius de Kempenaer,
Senior Technical Analyst, StockCharts.com
HAPPY NEW YEAR!!!
Ever since the introduction of RRG back in 2011, many people have asked me questions like: "What is the track record for RRG" or "What are the trading rules for RRG"?
My answers have always been, and will continue to be, "There...
READ MORE
MEMBERS ONLY

Is This ADX Pattern a Warning Sign for Investors?

by Joe Rabil,
President, Rabil Stock Research
In this exclusive StockCharts video, Joe shares a specific ADX pattern that's signaling potential exhaustion in the momentum right now. Joe analyzes three other market periods that displayed this pattern and the resulting correction which followed. He then discusses some of the most attractive looking cryptos, as well...
READ MORE
MEMBERS ONLY

Strongest Top 3 S&P 500 Stocks: Will They Lead the Pack in 2025?

by Jayanthi Gopalakrishnan,
Director of Site Content, StockCharts.com
KEY TAKEAWAYS
* The stock market's annual performance has been stellar, with the S&P gaining over 23%.
* Take care to monitor the three S&P 500 stocks with the strongest technical rank in 2025.
* Make use of scanning tools to help filter stocks that meet your...
READ MORE
MEMBERS ONLY

DP Trading Room: Natural Gas (UNG) Breaks Out!

by Erin Swenlin,
Vice President, DecisionPoint.com
It's an interesting market day with the market moving lower despite positive seasonality. Natural Gas (UNG) broke out in a big way up over 15% at the time of writing. Is it ready to continue its big run higher?
Carl took the day off so Erin gave us...
READ MORE
MEMBERS ONLY

Is this Bounce a Robust Rebound or a Dead-Cat Bounce?

by Arthur Hill,
Chief Technical Strategist, TrendInvestorPro.com
KEY TAKEAWAYS
* Short-term breadth becomes most oversold in a year.
* Bounce ensues, but has yet to show material increase in participation.
* Setting key levels to identify a robust rebound.
Breadth became oversold last week and stocks rebounded this week. Is this a robust rebound or a dead cat bounce? Today&...
READ MORE
MEMBERS ONLY

DP Trading Room: Deceptive Volume Spikes

by Erin Swenlin,
Vice President, DecisionPoint.com
In today's free DecisionPoint Trading Room Carl discusses volume spikes and how we have to analyze big volume spikes carefully to determine whether they express a confirmation of a move or whether they are a special case and do not really provide insight.
Carl goes over the signal...
READ MORE
MEMBERS ONLY
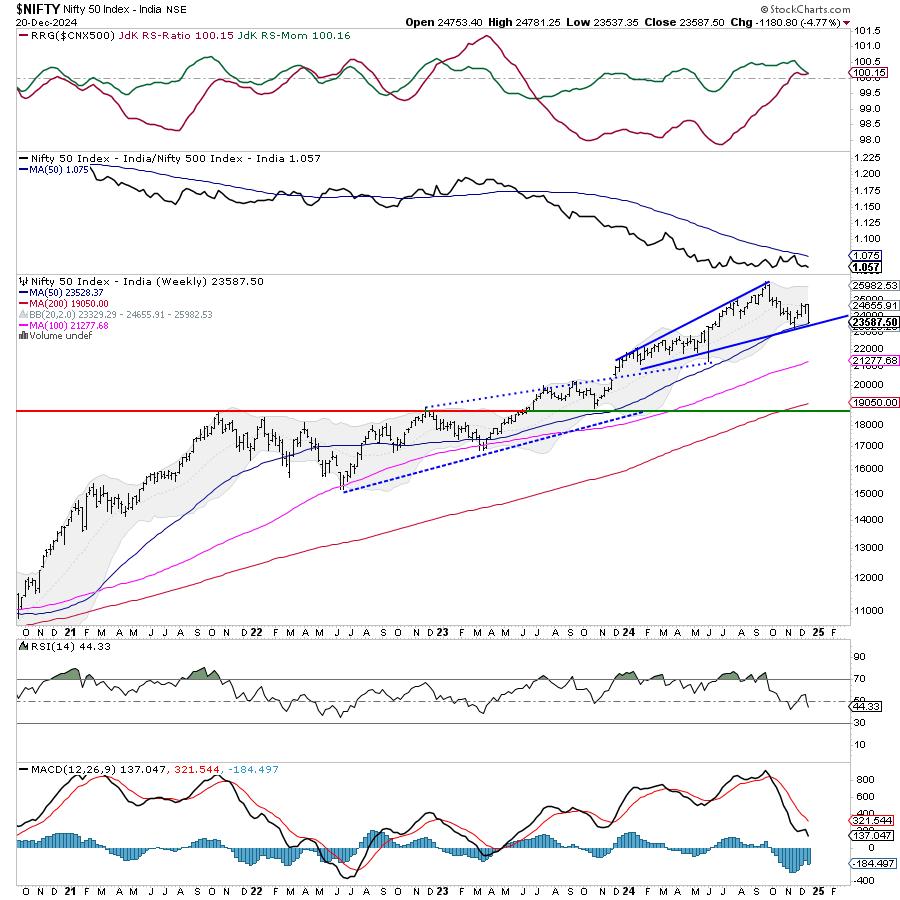
Week Ahead: NIFTY's Behavior Against This Level To Influence Trends For The Coming Weeks

by Milan Vaishnav,
Founder and Technical Analyst, EquityResearch.asia and ChartWizard.ae
After staying in the green following a sharp rebound the week before this one, the markets finally succumbed to selling pressure after failing to cross above crucial resistance levels. The Nifty stayed under strong selling pressure over the past five sessions and violated key support levels on the daily charts....
READ MORE
MEMBERS ONLY

Will the Stock Market's Santa Rally Bring Holiday Cheer to Investors?

by Jayanthi Gopalakrishnan,
Director of Site Content, StockCharts.com
KEY TAKEAWAYS
* The broader stock market indexes closed higher on Friday but lower for the week.
* Market breadth continues to be weak despite Friday's rally.
* More follow-through next week is required to confirm a reversal and the hope for a Santa Claus rally.
A smart investor listens to...
READ MORE
MEMBERS ONLY
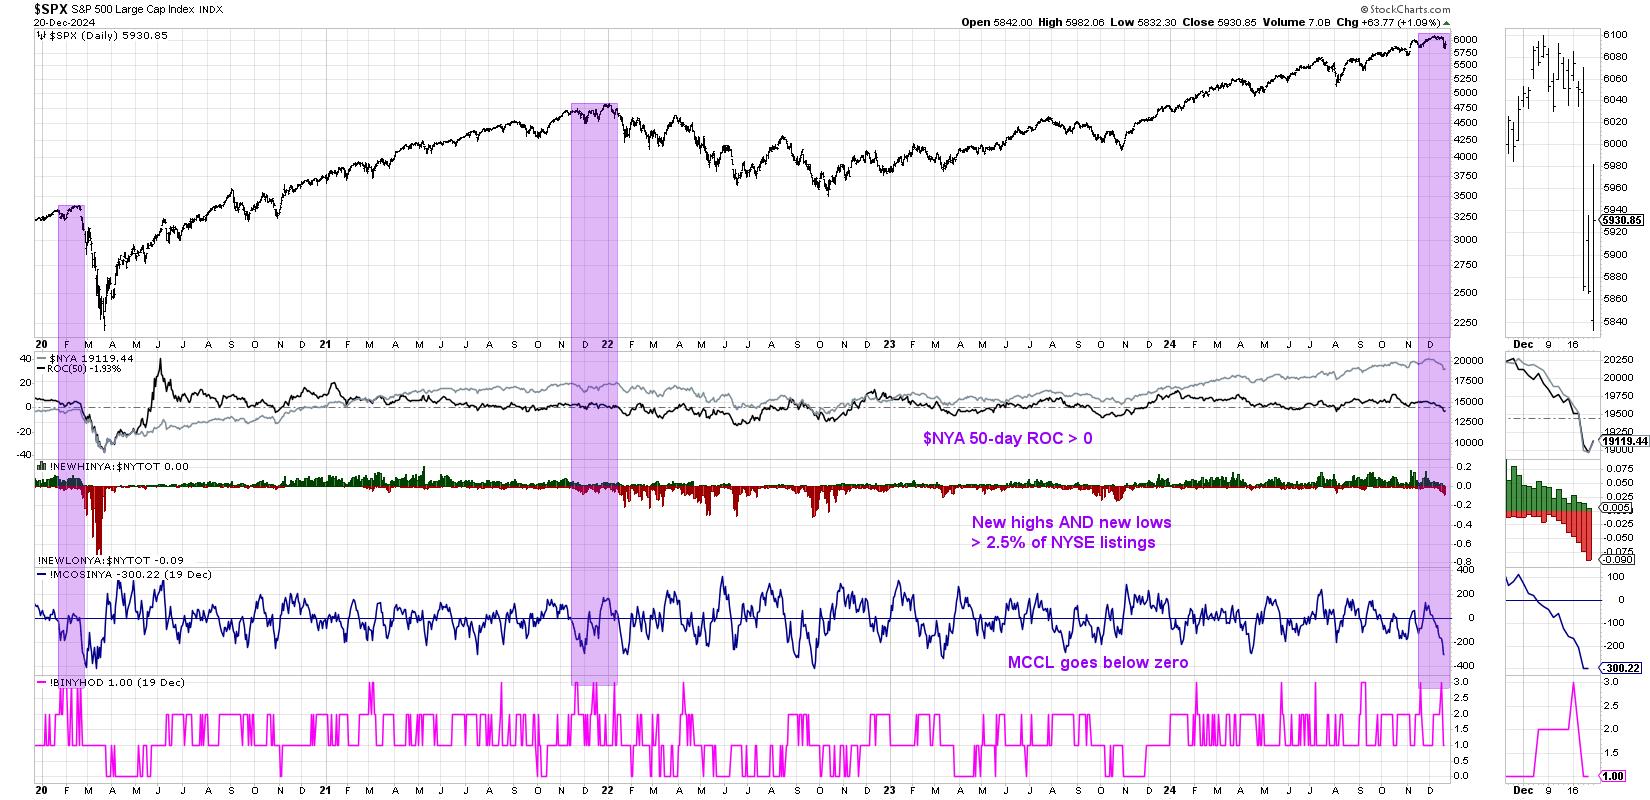
2024's Big Bang: A Deeper Dive Into the Hindenburg Omen

by David Keller,
President and Chief Strategist, Sierra Alpha Research
KEY TAKEAWAYS
* The Hindenburg Omen looks for patterns that have consistently shown at major market tops.
* Using trend-following techniques like support and resistance levels can help to improve accuracy of macro indicators.
* S&P 5850 remains the most important level in our view going into year-end 2024.
This week...
READ MORE
MEMBERS ONLY

AI Boom Meets Tariff Doom: How to Time Semiconductor Stocks

by Karl Montevirgen,
The StockCharts Insider
KEY TAKEAWAYS
* Semiconductors are caught in a tug-of-war with AI demand on one side and tariff fears on the other.
* The industry's technical performance shows a narrow standstill that can break either way.
* Watch SMH and its top three holdings—NVDA, TSM, and AVGO—for insights into timing...
READ MORE
MEMBERS ONLY
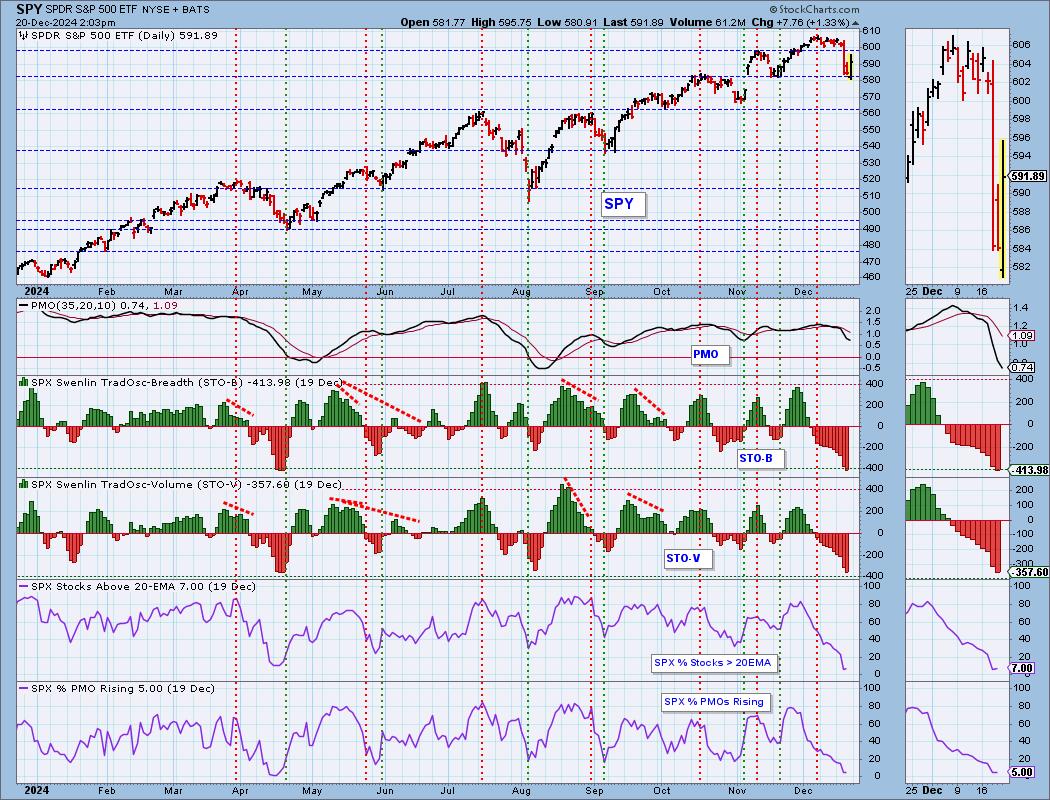
Oversold Conditions Not Always a Friend

by Erin Swenlin,
Vice President, DecisionPoint.com
Nearly all of our charts currently show deeply oversold conditions. While this is usually a good thing, in a market downturn, it isn't necessarily your friend. As you can guess, we believe that Wednesday's big decline was the beginning of something more serious. But the question...
READ MORE
MEMBERS ONLY

The Trump Trade? Not All as MAGA as You Might Think

by Martin Pring,
President, Pring Research
The "Trump Trade" refers to the market reaction and investment strategies that emerged following Donald Trump's election victories and his economic policies. It describes the shift in market sentiment driven by anticipated pro-business policies, tax cuts, and deregulation under his administration.
Investors initially rushed into sectors...
READ MORE
MEMBERS ONLY

Navigating the Indecisive SPY: What Investors Should Know

by Jayanthi Gopalakrishnan,
Director of Site Content, StockCharts.com
KEY TAKEAWAYS
* The SPDR S&P 500 ETF (SPY) was flagged as a technically strong chart.
* An analysis of the SPY chart shows the ETF is being indecisive.
* Monitor the chart of SPY for indications of a decisive move in either direction.
When running my StockCharts Technical Rank (SCTR)...
READ MORE
MEMBERS ONLY

The Big Divergence in Bullish Percents

by David Keller,
President and Chief Strategist, Sierra Alpha Research
While the S&P 500 and Nasdaq 100 have been holding steady into this week's Fed meeting, warning signs under the hood have suggested one of two things is likely to happen going into Q1. Either a leadership rotation is amiss, with mega-cap growth stocks potentially taking...
READ MORE
MEMBERS ONLY

Don't Be Surprised by an Early 2025 Pullback

by Martin Pring,
President, Pring Research
This year has been a very good one for stockholders. Come to think of it, 2023 wasn't so bad either. After an extended period of gains, it's natural for investors to become complacent, especially as they head home for the holidays.
This is the kind of...
READ MORE
MEMBERS ONLY

DP Trading Room: Is Broadcom (AVGO) the New NVIDA (NVDA)?

by Erin Swenlin,
Vice President, DecisionPoint.com
Today Erin looks at the Broadcom (AVGO) chart and compares it to the NVIDIA (NVDA) chart. She shows us the differences between the two and tells you whether she believes AVGO will be the new NVDA, meaning it will perform as NVDA used to perform with a concerted move up...
READ MORE
MEMBERS ONLY
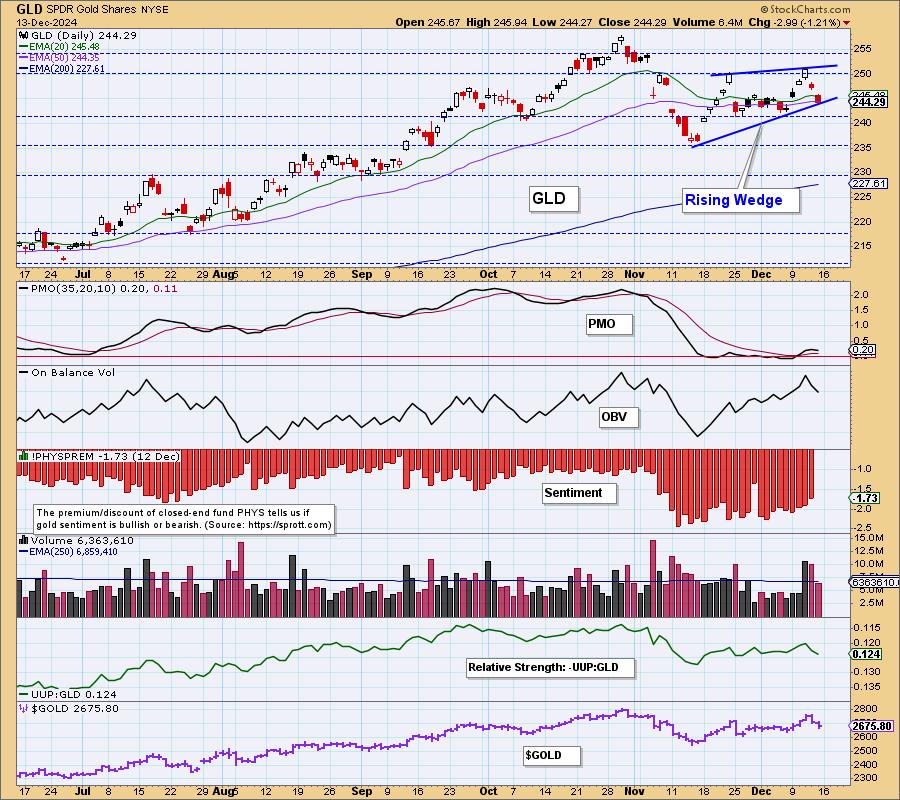
Bearish Formation Threatens Gold's Advance

by Carl Swenlin,
President and Founder, DecisionPoint.com
After the November pullback, GLD began to rally again. This week, on Wednesday, price exceeded the nearest November top, which made official the new rising trend from the November low. Brief celebration ends the following day as GLD tops, setting the top boundary for a bearish rising wedge formation. Rising...
READ MORE
MEMBERS ONLY
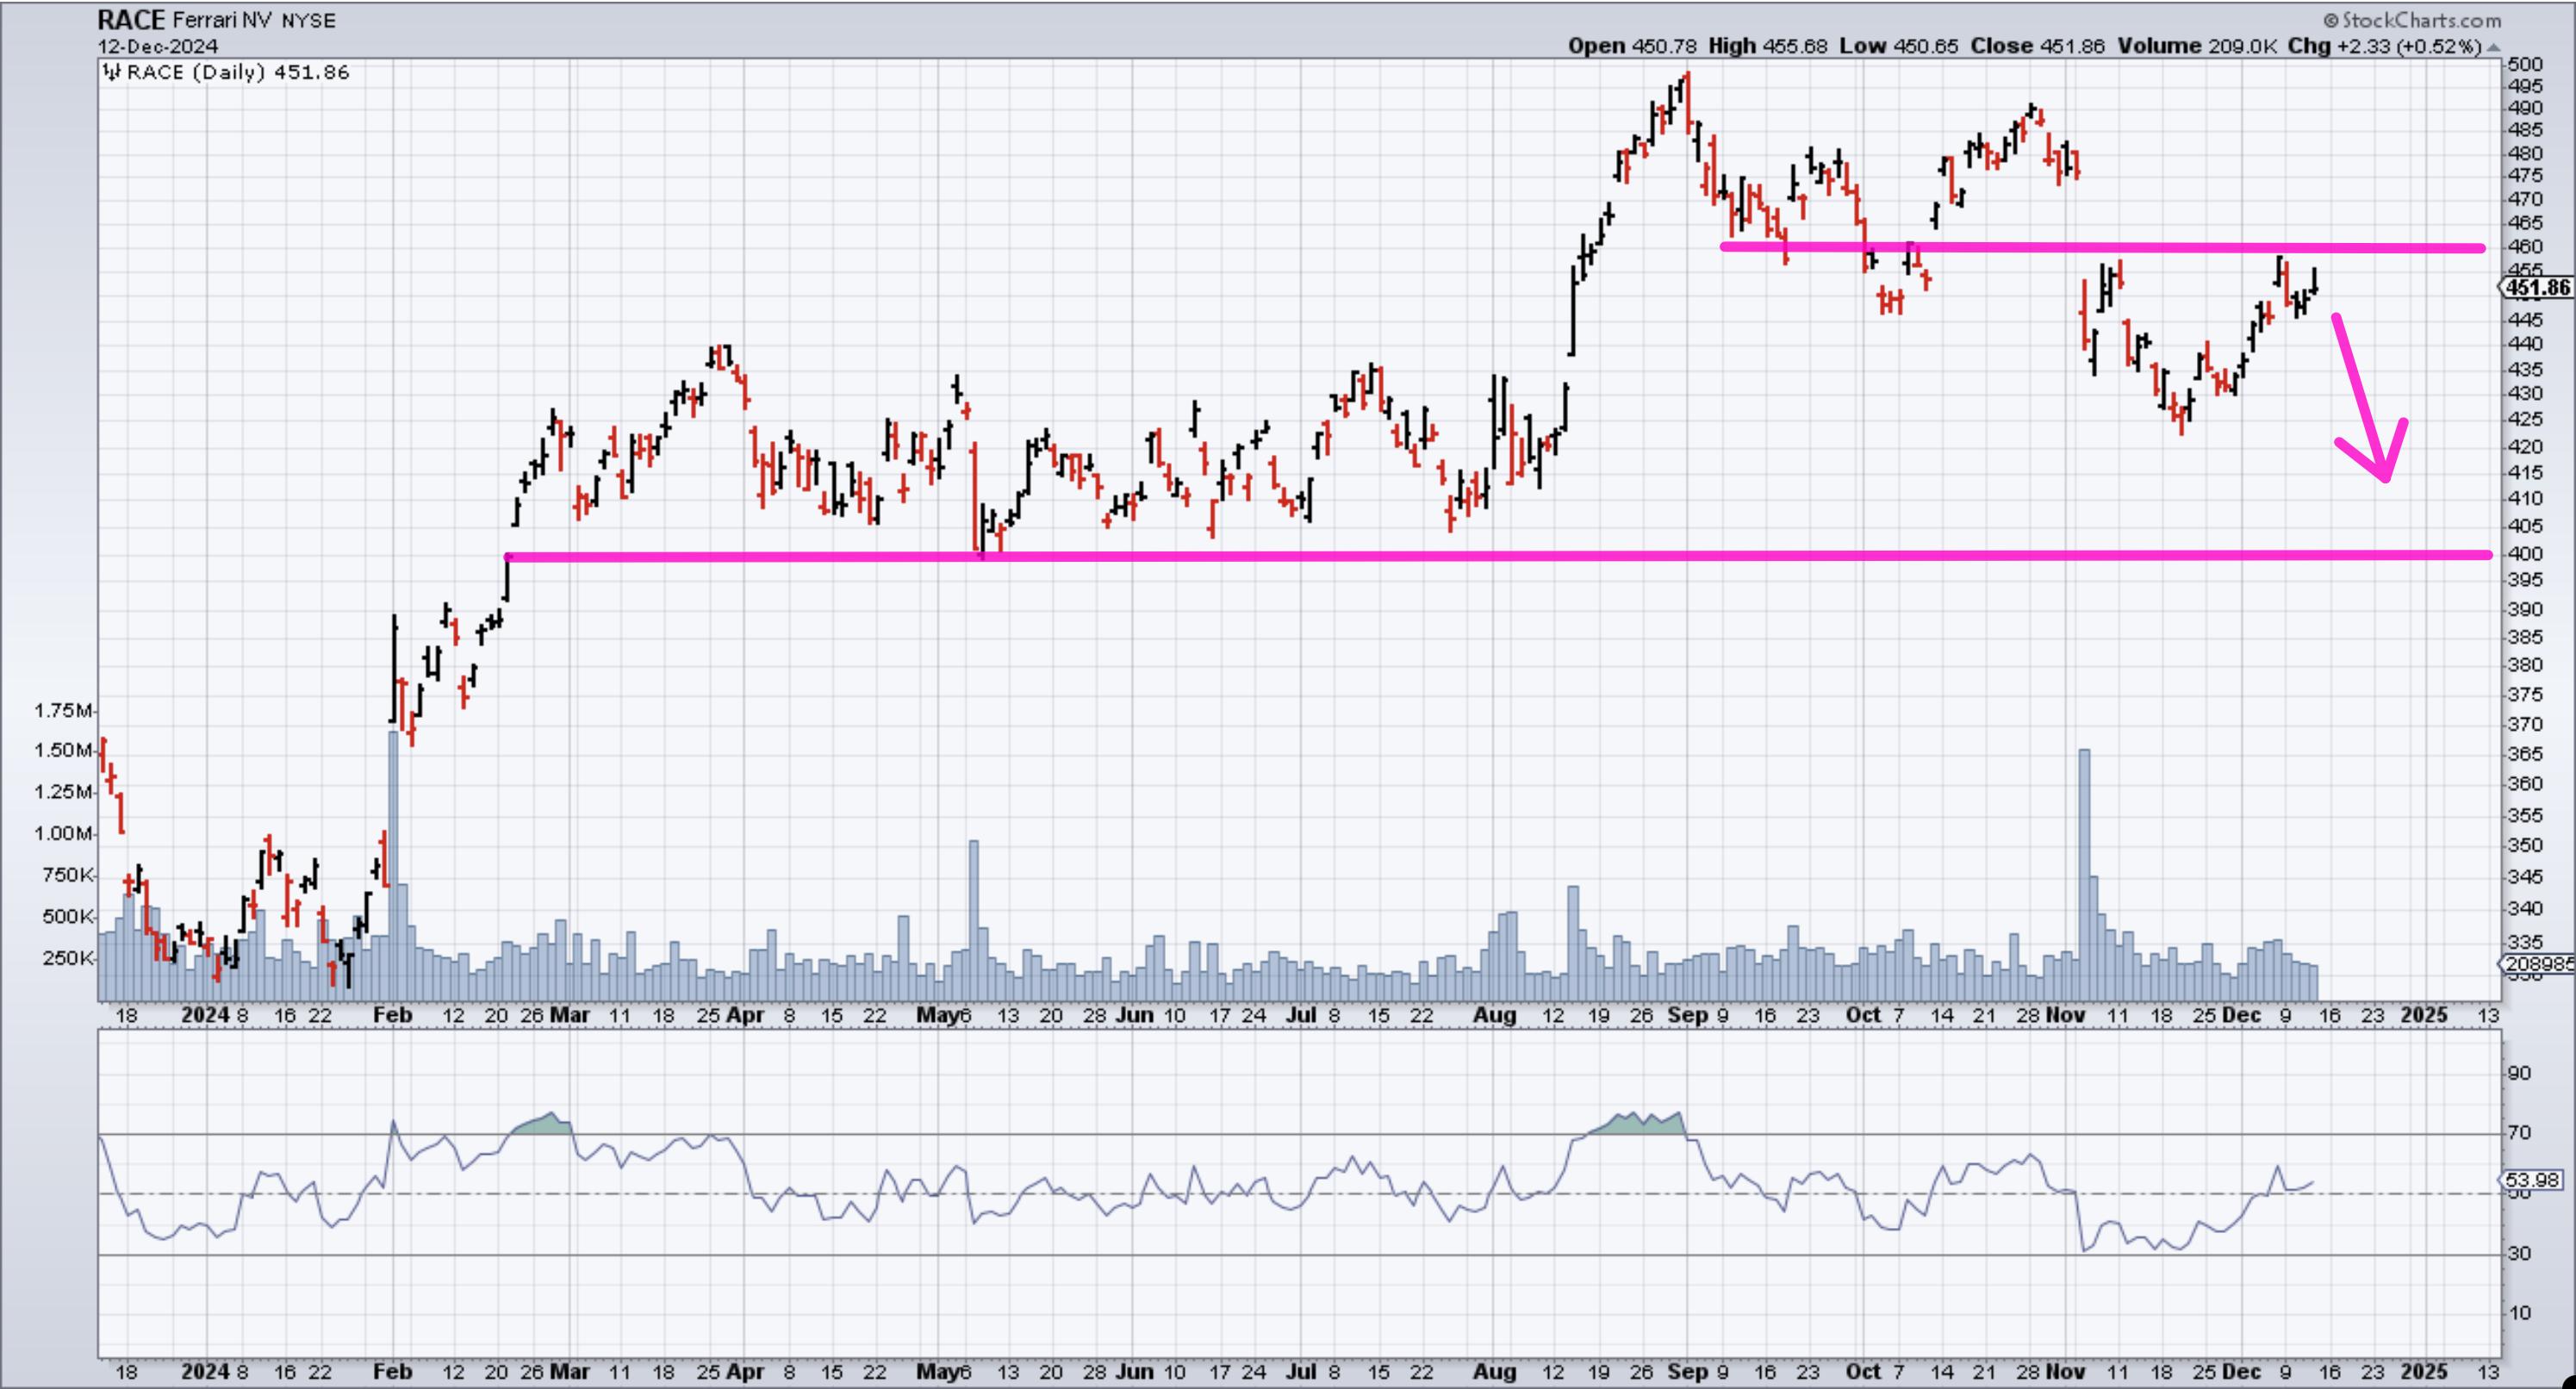
Pumping the Brakes on Ferrari (RACE)

by Tony Zhang,
Chief Strategist, OptionsPlay
Despite its position as a luxury automaker synonymous with prestige and performance, Ferrari N.V. (RACE) may be showing signs of a near-term downturn. Recent price action, coupled with stretched valuations and slowing shipment trends, suggests that RACE may face potential downside.
By incorporating both technical and fundamental analysis, we...
READ MORE
MEMBERS ONLY

Why Cisco's Stock Reversal Could Be a Game-Changer

by Jayanthi Gopalakrishnan,
Director of Site Content, StockCharts.com
KEY TAKEAWAYS
* CSCO stock has pulled back to its 21-day exponential moving average and is poised for a reversal.
* Monitor the stochastic indicator to confirm a reversal in CSCO's stock price.
* If you enter a long position in CSCO, establish your stop loss and have the discipline to...
READ MORE
MEMBERS ONLY

SOFI Advances to SCTR's Top 10: Is Now the Time to Buy?

by Karl Montevirgen,
The StockCharts Insider
KEY TAKEAWAYS
* SOFI's stock price recently appeared in the SCTR Report's top 10 list in the large-cap category.
* After a strong two-month rally, the fintech stock is now pulling back.
* Monitor SOFI's chart and watch key levels closely as the stock approaches a potential...
READ MORE
MEMBERS ONLY

Small Caps are Set to Skyrocket in 2025—Here's What You Need to Know

by Karl Montevirgen,
The StockCharts Insider
KEY TAKEAWAYS
* Small caps tend to outperform following an election year.
* In most annual cycles, small caps also have their seasonal tendencies.
* The chart of the iShares Russell 2000 ETF (IWM) is worth monitoring, especially as it approaches a buy point.
With an new administration inbound in Washington, D.C....
READ MORE
MEMBERS ONLY

Master the MACD Zero Line for a Trading Edge!

by Joe Rabil,
President, Rabil Stock Research
In this exclusive StockCharts video, Joe shows how to use the MACD zero line as a bias for a stock. As opposed to offering a buy signal, this Zero line level can provide insight into a market or stock's underlying condition; Joe shows how to refine that information...
READ MORE
MEMBERS ONLY

Several Intermarket Relationships Precariously Positioned for Stocks

by Martin Pring,
President, Pring Research
Chart 1 compares the S&P Composite with the NYSE A/D Line and its Common Stock counterpart. These, of course, are not intermarket relationships, but the chart does show that some near-term weakness would violate their bull market trendlines. Violating a trendline is not necessarily the end of...
READ MORE
MEMBERS ONLY

How to Spot Low-Volatility Stocks That are Ready to Explode

by Karl Montevirgen,
The StockCharts Insider
KEY TAKEAWAYS
* If you want to reposition your portfolio for 2025, consider the potential policy changes that can significantly affect the market.
* Focusing on financials and using MarketCarpets Bollinger BandWidth setting identifies stocks with low volatility setups, among other qualities.
* Identify stocks that meet your investing criteria and add them...
READ MORE


