MEMBERS ONLY

Market As Good As It Gets

by Erin Swenlin,
Vice President, DecisionPoint.com
Today Carl looks at the 26 indexes, sectors and groups in a CandleGlance to see how the indexes stack up. It is clear that all of the indexes are as good as they can get. Carl warns that when things are as good as they can get, the only place...
READ MORE
MEMBERS ONLY
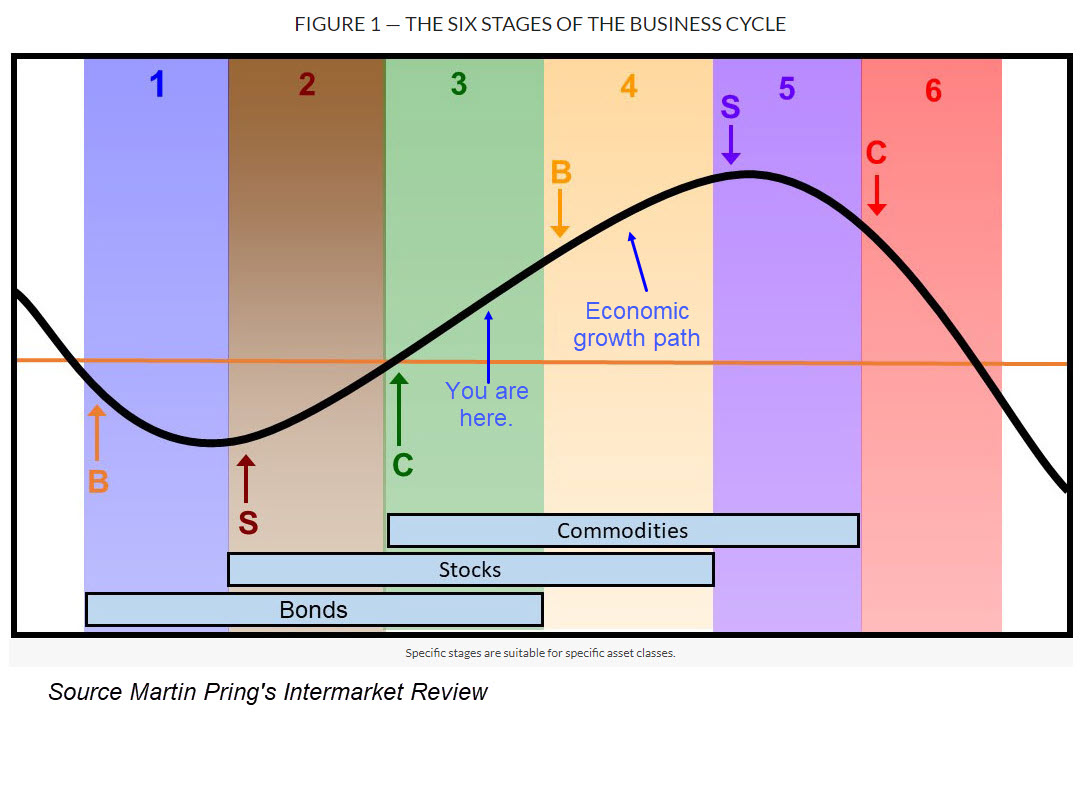
What the Economic Indicators are Saying About Stocks and Commodities

by Martin Pring,
President, Pring Research
You may not know it, but StockCharts' library of economic indicators has recently been enlarged. It's not as extensive as, say, the stock coverage, but it does include a lot of indicators that actually work, in the sense of helping identify major reversals in stock, bond, and...
READ MORE
MEMBERS ONLY
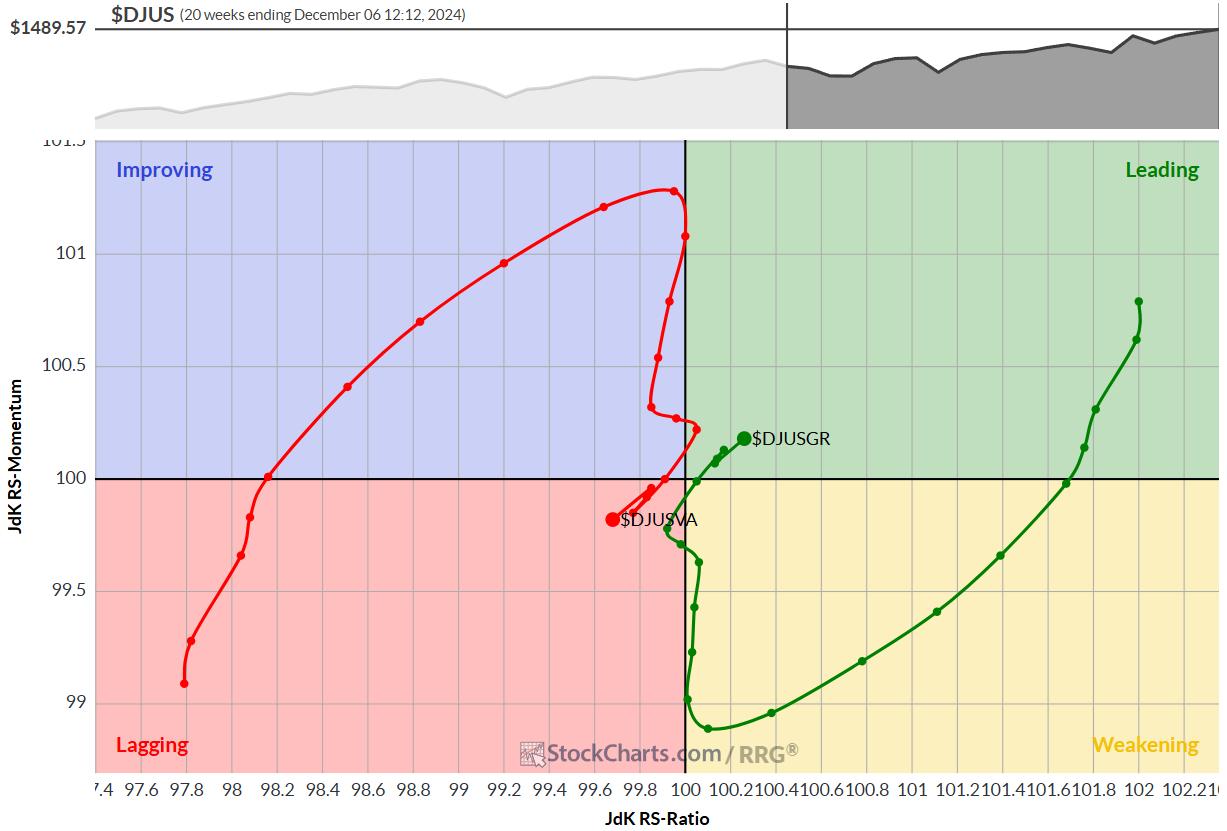
Stay Away from Large-Cap Value Stocks

by Julius de Kempenaer,
Senior Technical Analyst, StockCharts.com
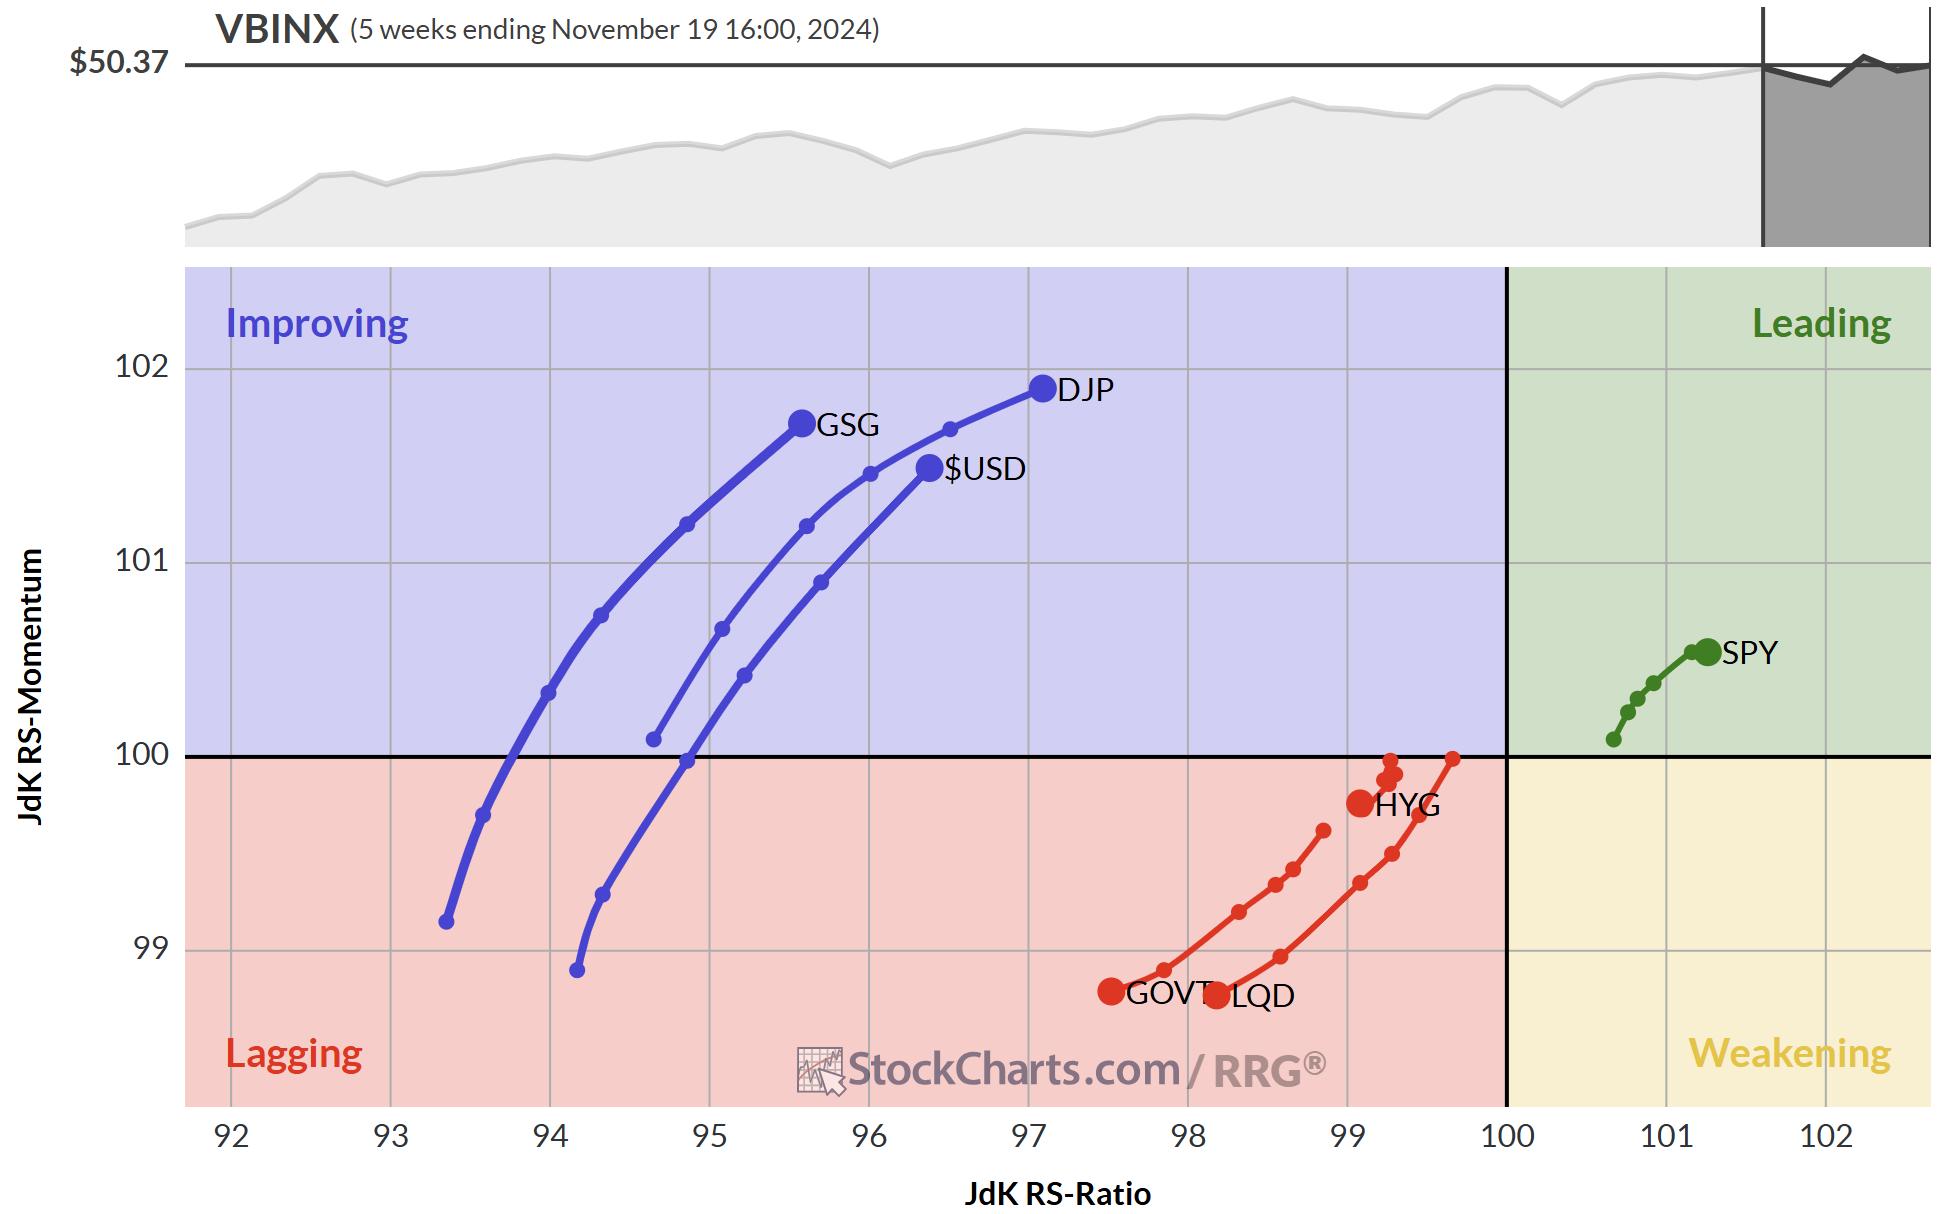
KEY TAKEAWAYS
* Growth stocks are regaining leadership over value.
* Small and mid-cap growth sectors are leading the charge.
* Large-cap value is currently the weakest market segment.
Growth vs. Value Rotation: The Pendulum Swings Again
Relative Rotation Graphs (RRG) are not just good tools to use in analyzing sector rotation; they&...
READ MORE
MEMBERS ONLY

Double Top on Industrials (XLI)
by Erin Swenlin,
Vice President, DecisionPoint.com
Industrials (XLI) benefited greatly from the "Trump Trade", but fell back to digest the gap up rally. It rallied again, but failed after overcoming overhead resistance at the prior November top. Now it is pulling back once again, which that has formed a bearish double top formation. The...
READ MORE
MEMBERS ONLY
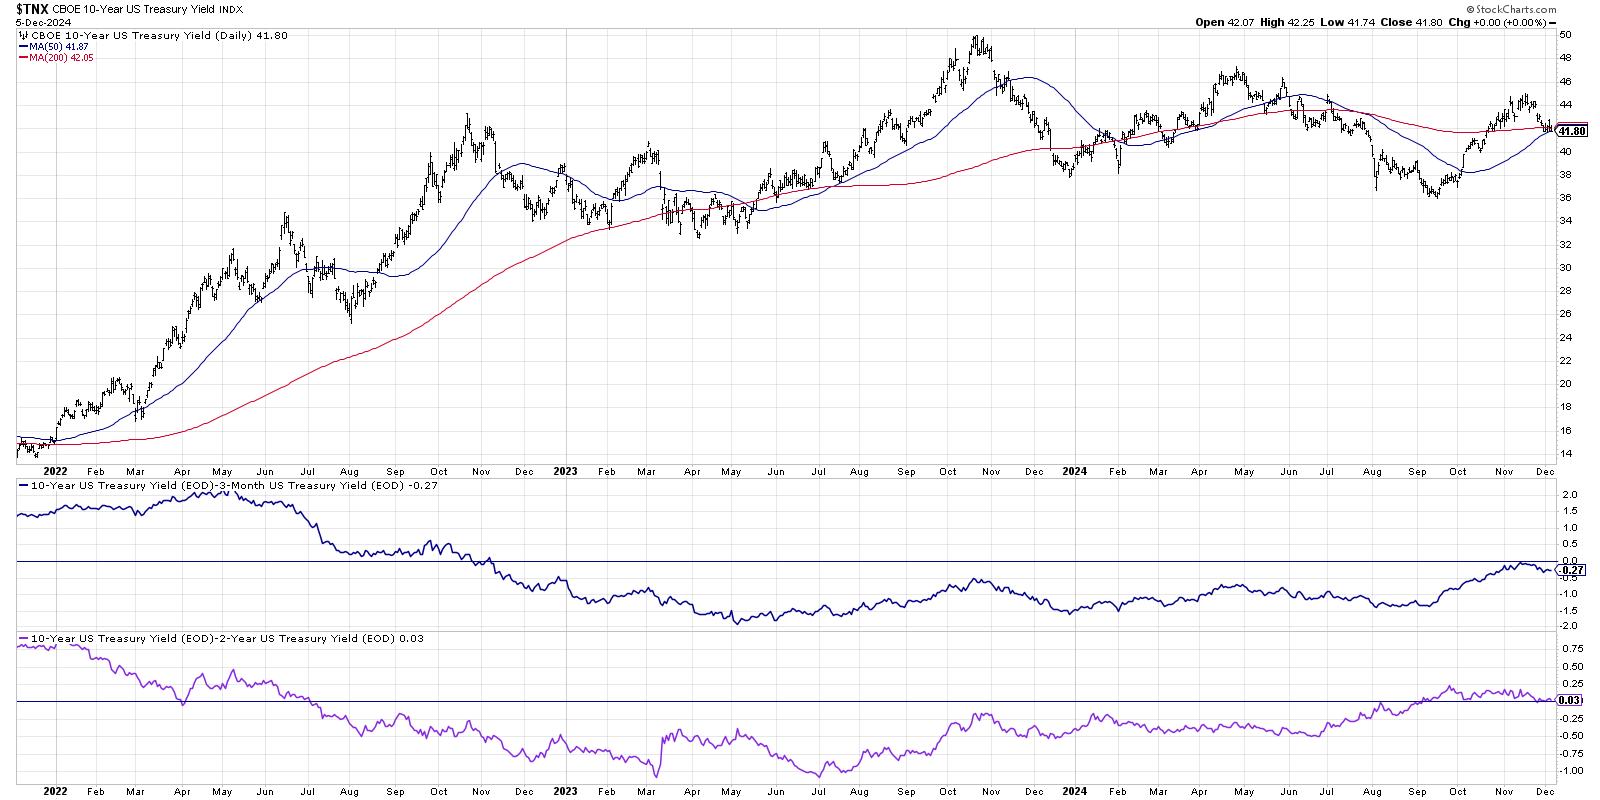
Two ETFs That Could Thrive Based on a Normal Yield Curve

by David Keller,
President and Chief Strategist, Sierra Alpha Research
My recent discussions on the Market Misbehavior podcasthave often included some comments on the interest rate environment, particularly the shape of the yield curve. We've had an inverted yield curve since late 2022, and so the yield curve taking on a more normal shape could mean a huge...
READ MORE
MEMBERS ONLY

CSCO Stock: A Hidden Gem With Upside Potential

by Jayanthi Gopalakrishnan,
Director of Site Content, StockCharts.com
KEY TAKEAWAYS
* CSCO stock has been in a slow uptrend since August and is outperforming the Nasdaq Composite.
* CSCO's stock price is at an all-time high and indicators suggest the stock can continue trending higher.
* Look for a pullback and a bounce off its 21-day exponential moving average....
READ MORE
MEMBERS ONLY

After a 29% Bounce, Can SMCI Reclaim Its Former Glory?

by Karl Montevirgen,
The StockCharts Insider
KEY TAKEAWAYS
* On Monday, Super Micro Computer Inc. (SMCI) jumped 29%.
* Bullish investors began buying SMCI on news of the company's financial stability after its 85% plunge in November.
* Watch the $50 resistance level in SMCI's stock price, in addition to other key levels, as a...
READ MORE
MEMBERS ONLY
Can You Really Predict Stock Market Success Using the Yield Curve?
by David Keller,
President and Chief Strategist, Sierra Alpha Research
In this video, Dave reflects on the shape of the yield curve during previous bull and bear cycles with the help of StockCharts' Dynamic Yield Curve tool. He shares insights on interest rates as investors prepare for the final Fed meeting of 2024, and shares two additional charts he&...
READ MORE
MEMBERS ONLY
DP Trading Room: Swenlin Trading Oscillators Top!
by Erin Swenlin,
Vice President, DecisionPoint.com
On Friday our short-term Swenlin Trading Oscillators (STOs) turned down even after a rally. This is an attention flag that we shouldn't ignore, but what do the intermediate-term indicators tell us? Are they confirming these short-term tops?
Carl goes through the DP Signal tables to start the program...
READ MORE
MEMBERS ONLY

How to Trade MicroStrategy's Painful Plunge: The Levels Every Investor Must Watch
by Karl Montevirgen,
The StockCharts Insider
KEY TAKEAWAYS
* MicroStrategy's price is correlated with Bitcoin's.
* In 2024, Microstrategy's stock price surged from a low of $43 to a high of $543.
* Look for MicroStrategy's stock price to fall between $318 and $320, its next support level.
On November 21,...
READ MORE
MEMBERS ONLY
Three Charts That Could Be About to Break in a Big Way
by Martin Pring,
President, Pring Research
This article is not centered around a specific theme; rather, it focuses on some charts which look as if they are about to signal an important change in trend. In this case, "important" is defined as a forthcoming move lasting at least 3-months.
My indicator of choice for...
READ MORE
MEMBERS ONLY

Market Rally Broadens - New All-Time Highs?
by Erin Swenlin,
Vice President, DecisionPoint.com
Today Carl looks at the small-caps and mid-caps that have now begun to outperform the market. Clearly the rally is broadening, the question now is can we continue to make new all-time highs. It does seem very likely especially given the positive outlook on the Secretary of Treasury nomination.
Carl...
READ MORE
MEMBERS ONLY

2024 is Shaping Up Like 2021, Which Did Not End Particularly Well
by David Keller,
President and Chief Strategist, Sierra Alpha Research
I've always found technical analysis to be a fantastic history lesson for the markets. If you want to consider how the current conditions relate to previous market cycles, just compare the charts; you'll usually have a pretty good starting point for the discussion.
As we near...
READ MORE
MEMBERS ONLY
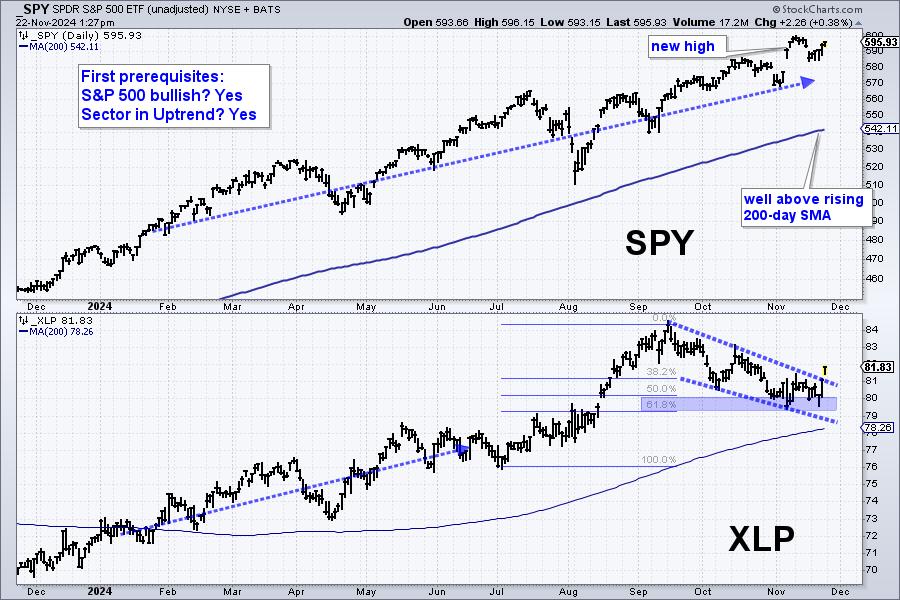
Four Prerequisites to Improve Your Odds - A Live Example

by Arthur Hill,
Chief Technical Strategist, TrendInvestorPro.com
KEY TAKEAWAYS
* Traders can improve their odds with market, sector and stock filters.
* We should be in a bull market and the sector should be in an uptrend.
* The stock should be in a long-term uptrend and leading.
Even though trading based on chart analysis involves some discretionary decisions, chartists...
READ MORE
MEMBERS ONLY
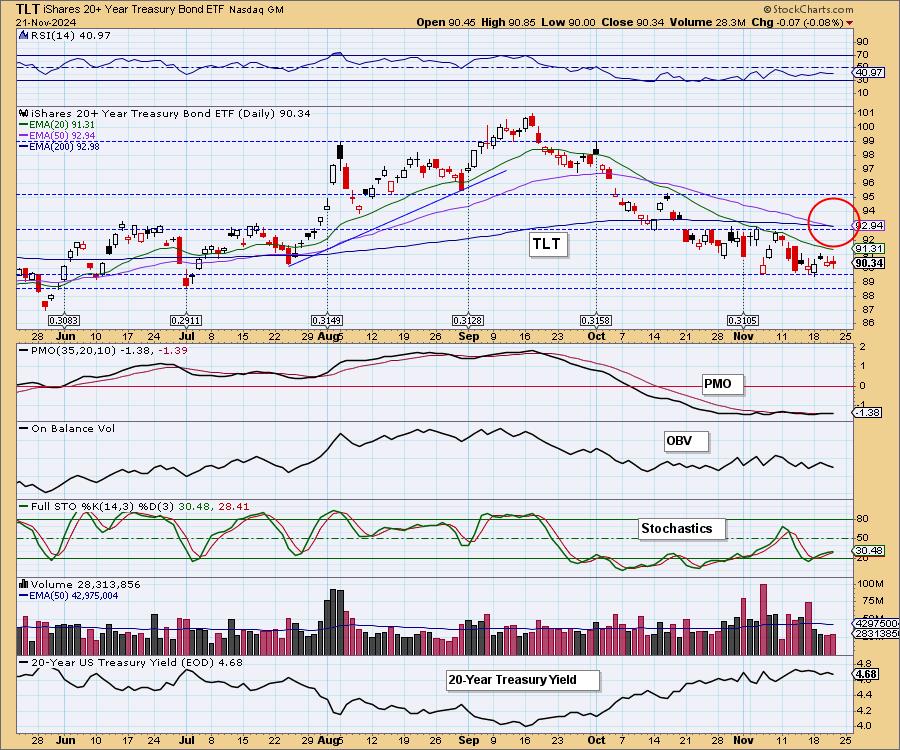
Bonds Get Death Cross SELL Signal

by Carl Swenlin,
President and Founder, DecisionPoint.com
Today, the 20-Year Bond ETF (TLT) 50-day EMA crossed down through the 200-day EMA (Death Cross), generating an LT Trend Model SELL Signal. This was the result of a downtrend lasting over two months. We note that the PMO has been running flat below the zero line for a month,...
READ MORE
MEMBERS ONLY

AppLovin's 1,303% Rise: The Hidden Power of the SCTR Report
by Karl Montevirgen,
The StockCharts Insider
KEY TAKEAWAYS
* AppLovin has risen 1,303% since the SCTR Report first gave the green light on the stock.
* Other StockCharts indicators confirmed the opportunity when Wall Street insiders began quietly accumulating the stock.
* Key levels in AppLovin's price chart can guide you to enter a long position...
READ MORE
MEMBERS ONLY
Is the USD Setting Up for a Perfect Rally?
by Julius de Kempenaer,
Senior Technical Analyst, StockCharts.com
KEY TAKEAWAYS
* Despite a lot of turmoil, SPY continues to show strong rotations on both weekly and daily RRGs.
* Rising yields have not damaged the stock rally yet.
* Stock/Bond ratio remains strongly in favor of stocks.
After the election, things have hardly settled in the world. New developments in...
READ MORE
MEMBERS ONLY
These Country ETFs are Looking Particularly Vulnerable
by Martin Pring,
President, Pring Research
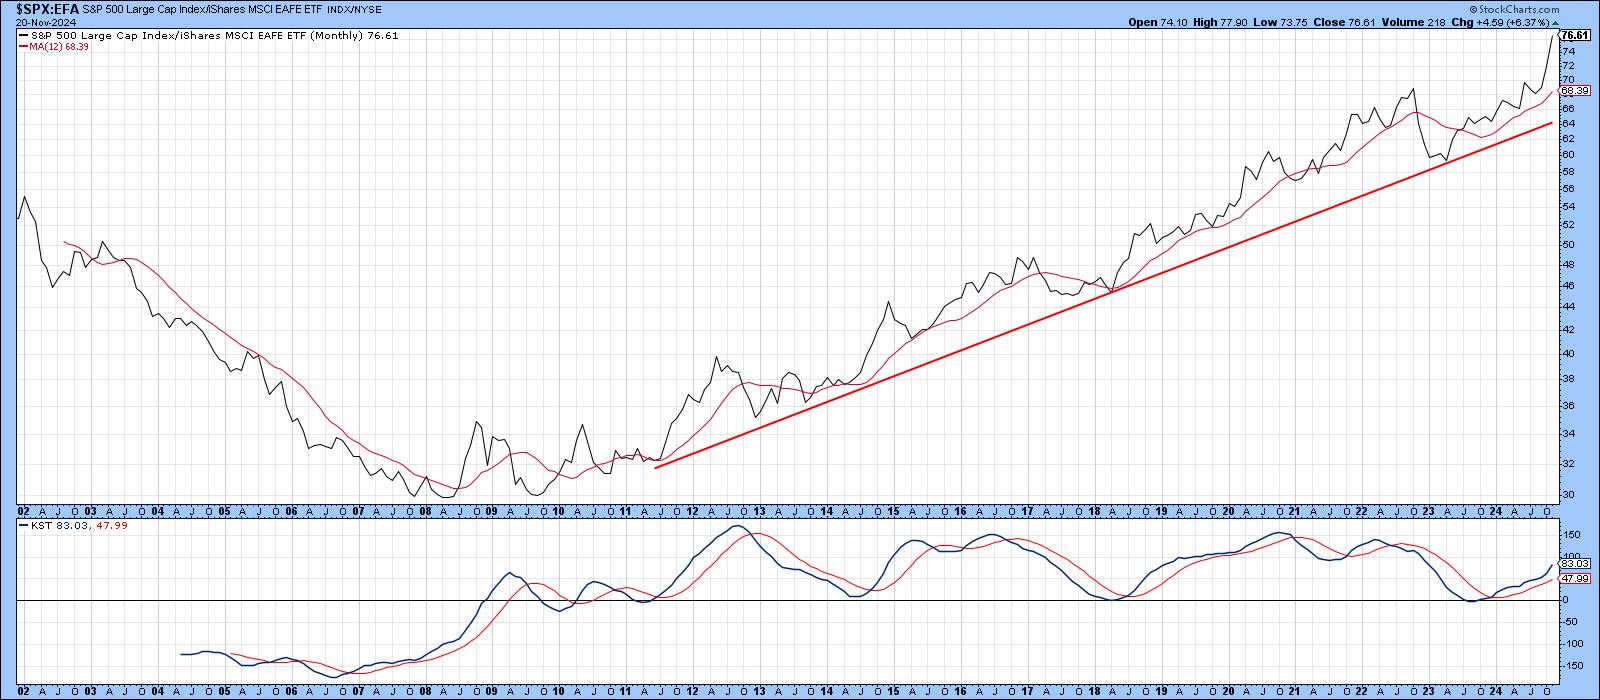
Chart 1, below, compares the S&P Composite to the Europe Australia Far East ETF (EFA), which is effectively the rest of the world. It shows that US equities have been on a tear against its rivals since the financial crisis. More to the point, there are very few...
READ MORE
MEMBERS ONLY
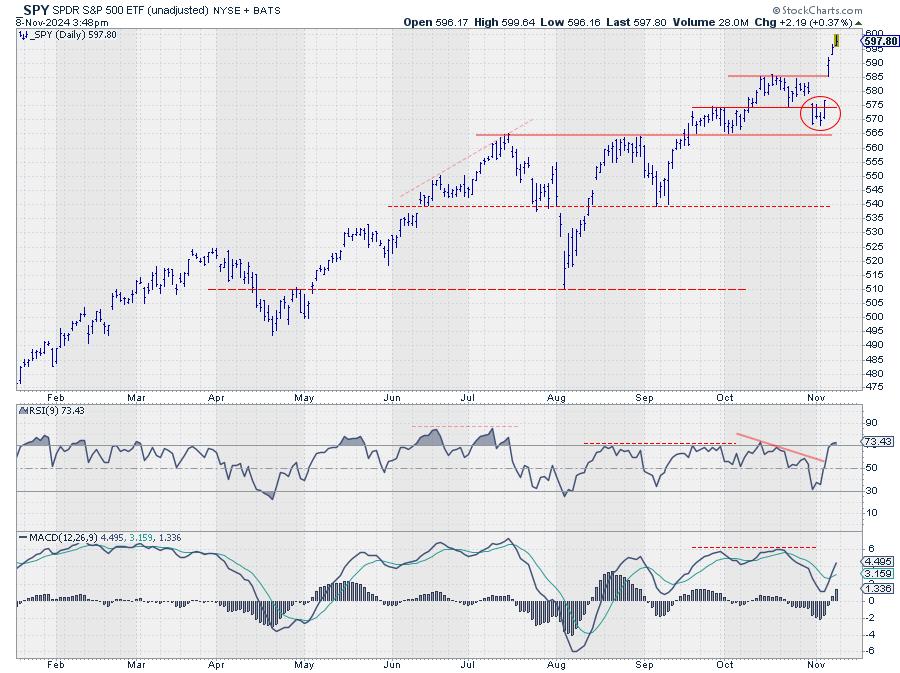
Be ALERT for Warning Signs - S&P 500 Downturn

by Joe Rabil,
President, Rabil Stock Research
In this exclusive StockCharts video, Joe goes into detail on the S&P 500 ETF (SPY), sharing why using MACD and ADX together can be beneficial -- especially in the current environment. He touches on Sentiment, Volatility and Momentum, pointing to reasons why we need to be on alert...
READ MORE
MEMBERS ONLY

Sector Rotation Suggests Offense Over Defense
by David Keller,
President and Chief Strategist, Sierra Alpha Research
KEY TAKEAWAYS
* Relative strength trends show a recent rotation into Consumer Discretionary, Communication Services, Financials, and Energy.
* The offense to defense ratio still favors "things you want" over "things you need."
* RRG charts give a fairly clear roadmap of what to look for rotation-wise into early...
READ MORE
MEMBERS ONLY

SCTR Report: The Palantir Trade Follow-Up—Transform Insights into Actions
by Jayanthi Gopalakrishnan,
Director of Site Content, StockCharts.com
KEY TAKEAWAYS
* Palantir stock sold off significantly on Monday and may be ripe for a turnaround.
* The pullback in Palantir stock could be an opportunity to enter a long position.
* The chart of Palantir's stock price indicates increased buying pressure, but more upside momentum is needed to enter...
READ MORE
MEMBERS ONLY
A Tale of Two Semiconductor ETFs - Why is SMH holding up better than SOXX?
by Arthur Hill,
Chief Technical Strategist, TrendInvestorPro.com
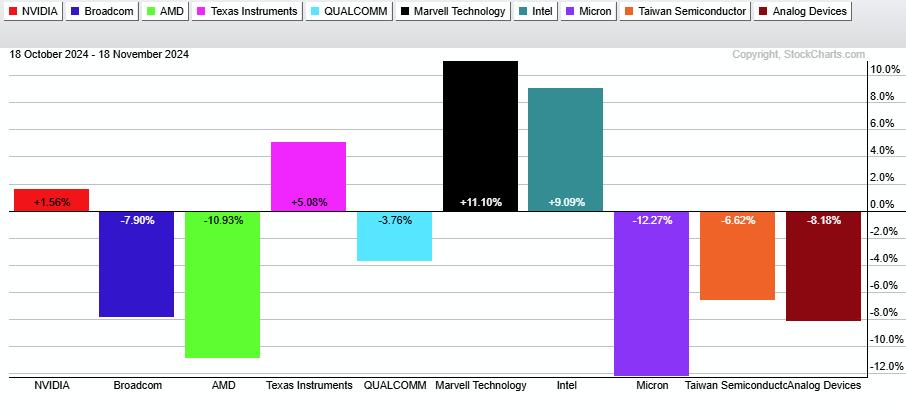
KEY TAKEAWAYS
* SOXX is lagging SMH as it broke the 200-day SMA and confirmed a bearish pattern.
* SMH is holding up because its top component remains strong.
* Nevertheless SMH is at a moment of truth ahead of a big earnings report from Nvidia.
Even though the iShares Semiconductor ETF (SMH)...
READ MORE
MEMBERS ONLY

MarketCarpets Secrets: How to Spot Winning Stocks in Minutes!
by Karl Montevirgen,
The StockCharts Insider
KEY TAKEAWAYS
* StockCharts' MarketCarpets can be customized to find stocks to invest in using specific criteria.
* The MarketCarpets tool helps users drill down from a big-picture view to individual stocks.
* Getting an at-a-glance view of strong stocks poised to bounce can be done immediately and efficiently with MarketCarpets.
When...
READ MORE
MEMBERS ONLY

Stocks: "...a PERMANENTLY high plateau"?
by Erin Swenlin,
Vice President, DecisionPoint.com
Today we explore the bullish sentiment that has taken SPX valuations to the moon. There are many out there that believe we have hit a plateau on prices that will continue permanently. We talk about the quote: "Stock prices have reached 'what looks like a permanently high plateau,...
READ MORE
MEMBERS ONLY
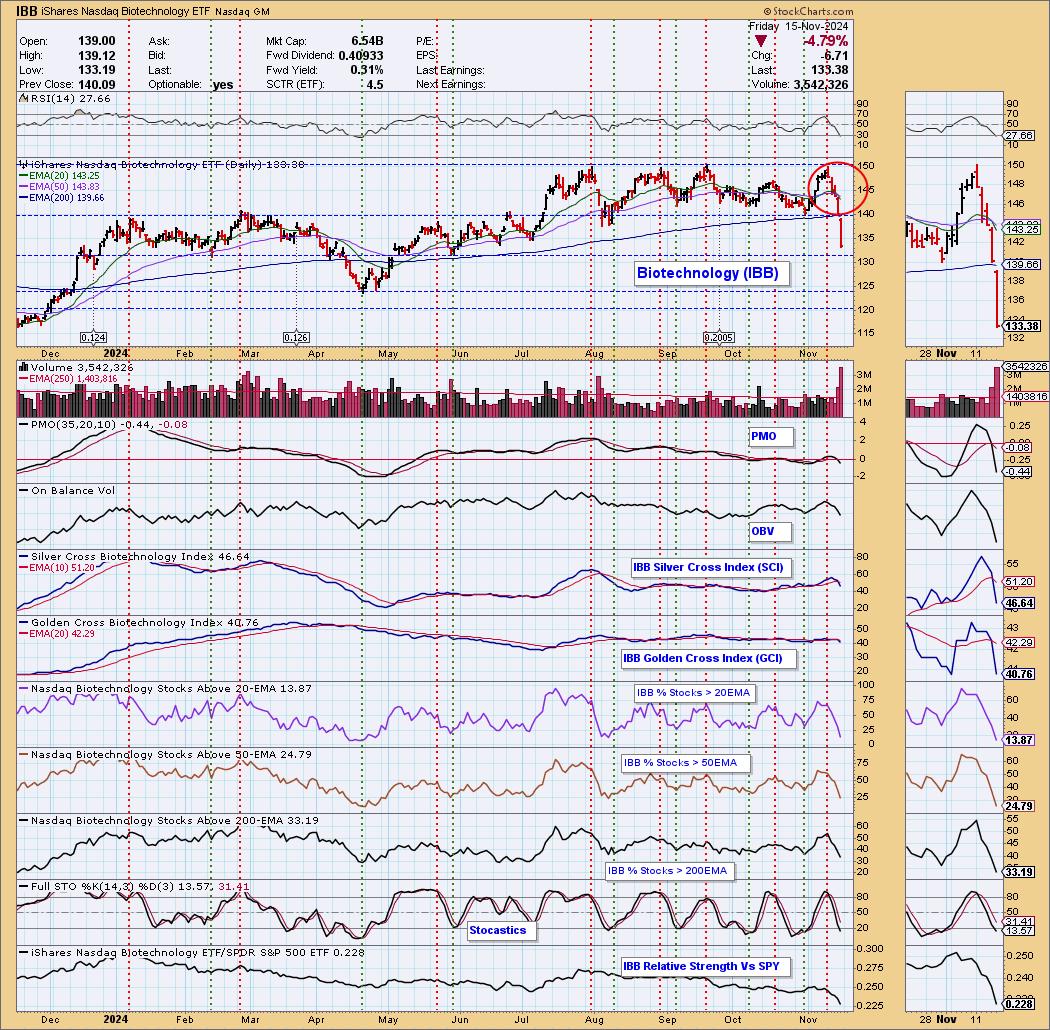
Biotechs Fall Apart with Dark Cross Neutral Signal
by Erin Swenlin,
Vice President, DecisionPoint.com
(This is an excerpt from the subscriber-only DP Weekly Wrap for Friday)
On Friday, the Biotechnology ETF (IBB) 20-day EMA crossed down through the 50-day EMA (Dark Cross) and above the 200-day EMA, generating an IT Trend Model NEUTRAL Signal. IBB recently switched to a BUY Signal on Friday November...
READ MORE
MEMBERS ONLY

Riding the Cryptocurrency Wave: How to Maximize Your Gains
by Karl Montevirgen,
The StockCharts Insider
KEY TAKEAWAYS
* With a new administration set to take office in January, it may be time to seriously reconsider cryptocurrencies.
* Three cryptocurrencies to keep an eye on are Bitcoin, Ethereum, and (strangely) Dogecoin.
* Despite cryptocurrencies being a noisy market, the right tools can help guide you toward smarter decisions.
With...
READ MORE
MEMBERS ONLY

The Sign of Strong Charts Getting Stronger
by David Keller,
President and Chief Strategist, Sierra Alpha Research
I was originally taught to use RSI as a swing trading tool, helping me to identify when the price of a particular asset was overextended to the upside and downside. And, on the swing trading time frame, that approach very much works, especially if you employ a shorter time period...
READ MORE
MEMBERS ONLY

Key Support Levels for Gold
by Erin Swenlin,
Vice President, DecisionPoint.com
In today's DP Alert short video we discuss the key support levels for Gold as it has likely begun a longer-term correction. We also take a look at Gold Miners under the hood! Charts and commentary are taken from our subscriber-only DP Alert publication. Subscribe now and try...
READ MORE
MEMBERS ONLY

The SCTR Report: Palantir Stock's Rise Makes It the Hottest AI Play
by Jayanthi Gopalakrishnan,
Director of Site Content, StockCharts.com
KEY TAKEAWAYS
* Palantir stock's rise to the third place in the SCTR Report makes it a worthy candidate to add to your portfolio.
* The price surge in Palantir stock after its stellar earnings report may just be the beginning of a bullish move.
* Palantir is a stock that...
READ MORE
MEMBERS ONLY
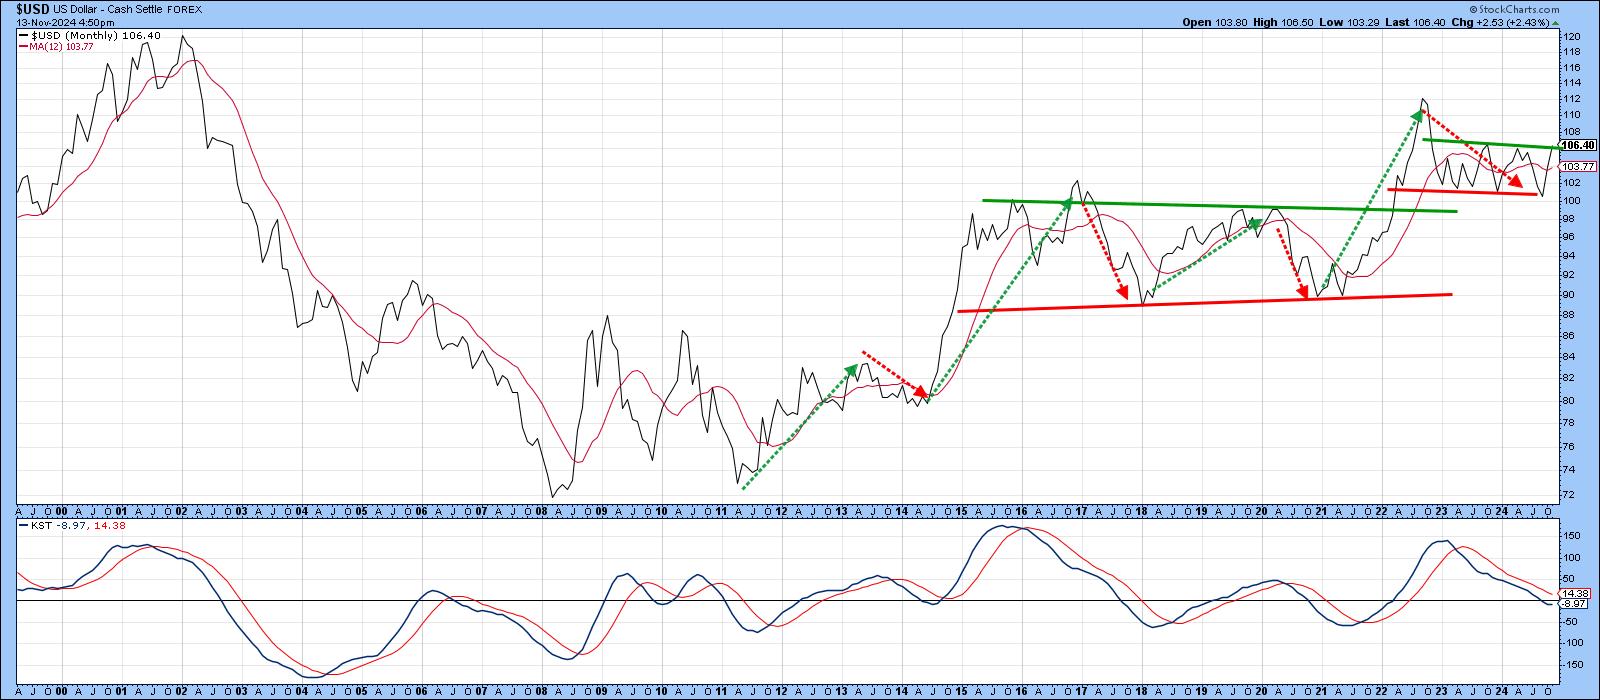
The Dollar's Technical Position is Crucial from a Short, Intermediate, Primary, and Secular Standpoint
by Martin Pring,
President, Pring Research
Chart 1 shows the Dollar Index has been in a trading range for the last couple of years and is now at resistance in the form of its upper part. The big question relates as to whether it can break to the upside, or if the resistance will once again...
READ MORE
MEMBERS ONLY

Are Extremely Overbought Conditions Good or Bad for Stocks?
by David Keller,
President and Chief Strategist, Sierra Alpha Research
When a stock shows an RSI value above 80, is that a good thing or a bad thing? In this video, Dave reviews a series of examples showing this "extreme overbought" condition, highlights how these signals usually occur not at the end of, but often earlier in an...
READ MORE
MEMBERS ONLY

What Seasonality Charts Reveal About the Top Sectors to Watch Right Now!
by Karl Montevirgen,
The StockCharts Insider
KEY TAKEAWAYS
* Seasonality provides a unique historical technical context, as long as you remember that it's more of a traffic flow map than a crystal ball.
* Seasonality charts can be useful for drilling down from market to sector or sector to stocks.
* Checking the daily chart is crucial...
READ MORE
MEMBERS ONLY
Is the Trump Rally Like the Reagan Rally?
by Erin Swenlin,
Vice President, DecisionPoint.com
Today Carl compares this week's Trump Rally with the rally we saw after Reagan was elected in 1980. There are similarities and differences. The Trump rally has lifted certain sectors of the market as well as Cryptocurrencies. While the Reagan rally had different catalysts.
The market continues to...
READ MORE
MEMBERS ONLY
Three Sectors Leading SPY Back to Offense
by Julius de Kempenaer,
Senior Technical Analyst, StockCharts.com
KEY TAKEAWAYS
* The market came out of defensive mode after the election.
* Old resistance at 585 is now support for SPY.
* XLC, XLY, and XLF are all showing strength.
First of all, for those of you looking for a new video this week, I have intentionally skipped it because I...
READ MORE
MEMBERS ONLY

Markets Surge Post-Election: Is It Time to Go All-In?
by Karl Montevirgen,
The StockCharts Insider
KEY TAKEAWAYS
* The S&P 500 jumped post-election, exhibiting a strong gap.
* Sentiment indicators remain bullish, though not quite euphoric.
* Momentum indicators, however, signal a slowdown ahead for stocks.
When major shifts happen in the market, such as the one we're seeing the morning after the election,...
READ MORE
MEMBERS ONLY

The SCTR Report: What Coinbase's Dramatic Price Surge Means For Your Portfolio
by Jayanthi Gopalakrishnan,
Director of Site Content, StockCharts.com
KEY TAKEAWAYS
* Coinbase made it to the top of the Top Up Large Cap stocks SCTR Report on the day after the US elections.
* The price surge in Coinbase stock could be the start of an upward move.
* Trading options on COIN provide an alternative to buying COIN stock.
Now...
READ MORE
MEMBERS ONLY
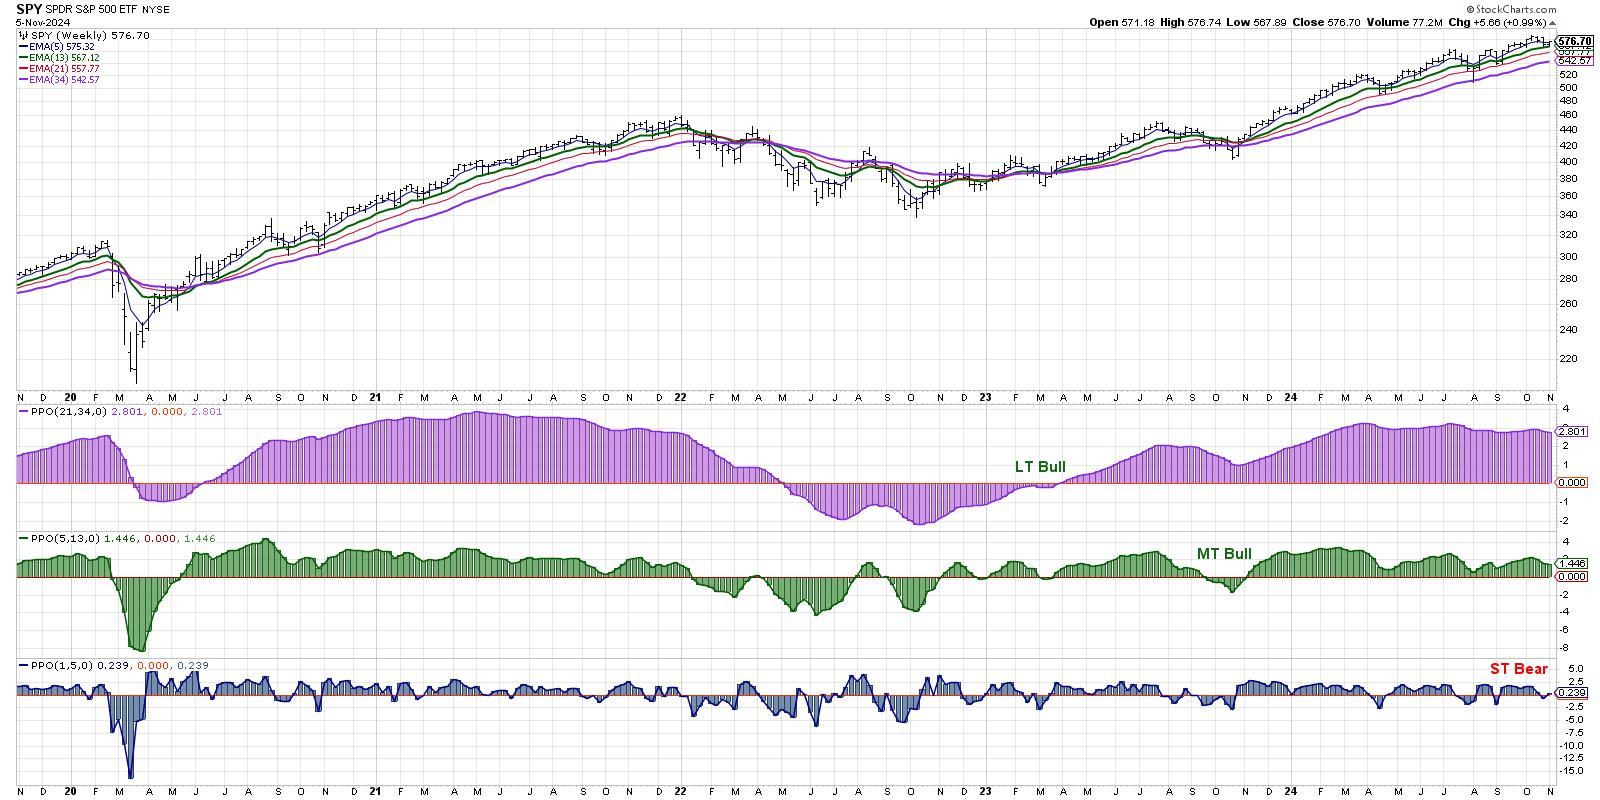
Short-Term Bearish Signal as Markets Brace for News-Heavy Week
by David Keller,
President and Chief Strategist, Sierra Alpha Research
KEY TAKEAWAYS
* We can define the market trend on multiple time frames using a series of exponential moving averages.
* While our short-term Market Trend Model turned bearish last week, the medium-term and long-term models remain bullish.
* 2021 could provide a compelling analogue to what we're experiencing so far...
READ MORE
MEMBERS ONLY
Market Trend Model Flashes Short-Term Bearish, What's Next?
by David Keller,
President and Chief Strategist, Sierra Alpha Research
In this video, Dave breaks down the three time frames in his Market Trend Model, reveals the short-term bearish signal that flashed on Friday's close, relates the current configuration to previous bull and bear market cycles, and shares how investors can best track this model to ensure they&...
READ MORE
MEMBERS ONLY

DP Trading Room: Six-Month Period of Favorable Seasonality Begins Now!
by Erin Swenlin,
Vice President, DecisionPoint.com
It's here! The SPY starts a period of favorable seasonality for the next six months. Carl takes us through his charts and explains favorable versus unfavorable periods of seasonality.
Carl covers our signal tables showing new weakness seeping in despite this period of favorable seasonality. The market looks...
READ MORE
MEMBERS ONLY
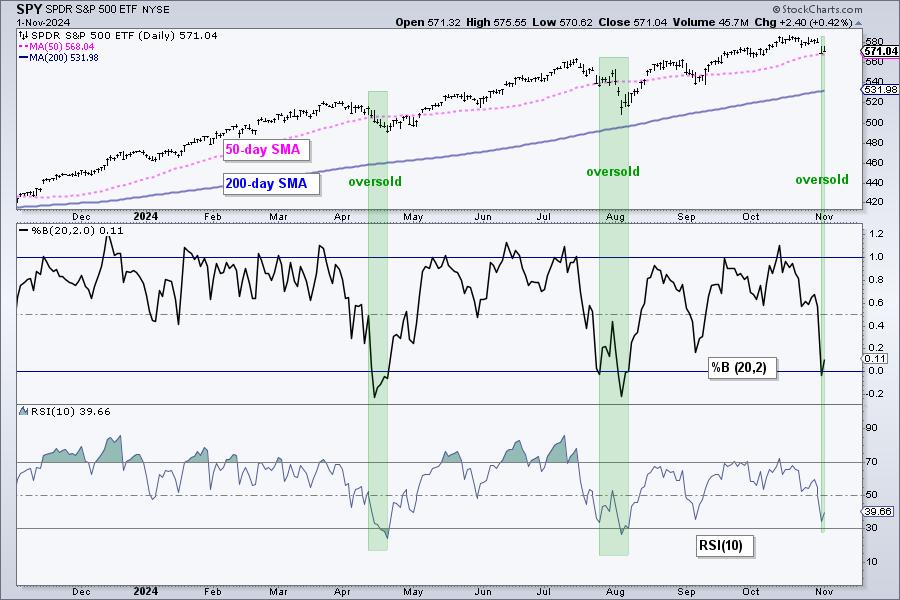
Finding and Trading Oversold Conditions within Long-term Uptrends
by Arthur Hill,
Chief Technical Strategist, TrendInvestorPro.com
KEY TAKEAWAYS
* Oversold conditions create opportunities to trade with the long-term uptrend.
* Oversold conditions provide the setup, but not the signals.
* Chartists need a signal because price can become oversold and remain oversold.
There is only one way to trade in a long-term uptrend: long. Forget about picking tops and...
READ MORE