MEMBERS ONLY

Nifty at a Crossroads; Awaits Clarity from Global Triggers

The Nifty was the only major global equity index to end the week in the red amid US tariff uncertainty. Is it vulnerable to further pressure?... READ MORE
The Nifty was the only major global equity index to end the week in the red amid US tariff uncertainty. Is it vulnerable to further pressure?... READ MORE


Mary Ellen McGonagle breaks down how market participation and sector movement are shifting early in the year, highlighting key signals investors should be watching as leadership rotates beneath the surface.... READ MORE


The S&P 500 is in a clear uptrend with strong breadth, and three sectors leading the trend are Finance, Health Care, and Industrials. Arthur Hills shows you how to use a top-down approach to identify oversold stocks within uptrends.... READ MORE


Before We Dive In… Every strong move begins with tension, a buildup of energy (sometimes hidden) before the next move. While most traders only notice the explosion, those who pay close attention to volatility are generally able to anticipate the big move before it happens. We covered this in part... READ MORE


Markets opened 2026 with solid gains, but Tom Bowley explains why several warning signs beneath the surface deserve attention. He breaks down leadership trends and intermarket relationships that are failing to confirm the rally, highlighting what traders should keep their eyes on.... READ MORE

Joe Rabil of Rabil Stock Research breaks down a momentum shift, highlighting stocks beginning to stand out based on trend, momentum, and relative strength. He also reviews SPY market conditions, including volatility, sentiment, and multi-timeframe trend analysis.... READ MORE


Frank Cappelleri breaks down why financials and semiconductors are showing strength and how Bitcoin is attempting to regain momentum early in 2026. Failed breakdowns, bullish patterns, and key levels are shaping what happens next in the market.... READ MORE


A shift is taking place in the stock market that investors shouldn't ignore. As leadership rotates beyond mega-cap stocks, mid-caps are breaking to record highs. What does this early-year price action indicate? Find out here.... READ MORE


Although the Energy sector has been a laggard in the past 200 days, these charts suggest this sector may be about to reverse course. Here's a unique perspective.... READ MORE
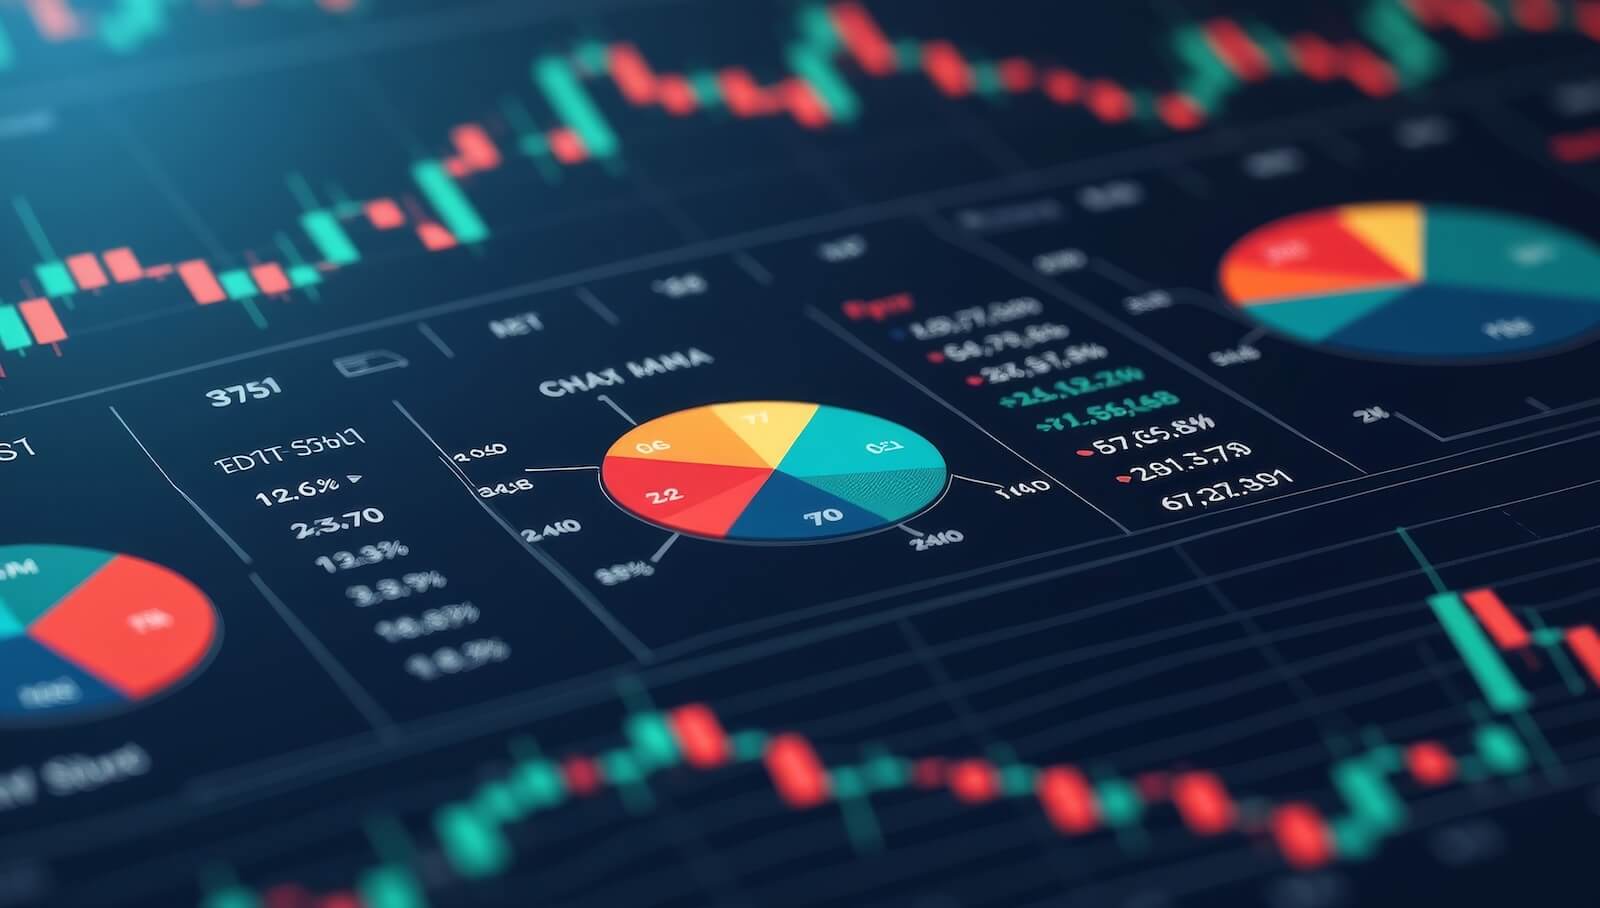

S&P 500 P/E in Q3 2025 is above normal and projected to rise in 2026. These charts will help you keep track of quarterly earnings.... READ MORE

Energy stocks are off to a good start, and after recent geopolitical headlines, you may want to consider this long-time underperforming sector. A break above key technical resistance levels will determine if energy stocks have staying power.... READ MORE

Nifty's technical setup remains in a strong uptrend, trading above key moving averages. However, momentum seems to have moderated, suggesting possible fatigue. Here's a technical deep dive to prepare you for the coming week.... READ MORE
The stock market kicked off the new year with a bounce, but is the strength as solid as it looks on the surface? In this video, Mary Ellen McGonagle digs into the January rebound and takes a closer look at what's fueling the move. She breaks down recent... READ MORE


Friday's market bounce brought a surprise: strength beyond Big Tech. See which sectors and ETFs are leading, and what it could mean for 2026.... READ MORE

Defense stocks offer earnings visibility and act as a hedge against geopolitical risk. Here's a look at why defense-related stocks may be potential investment opportunities.... READ MORE

What should investors look forward to in 2026? Here's Tom Bowley's outlook. ... READ MORE

Bitcoin has recently sold off sharply. Was 2025 the top, or will prices continue to rise higher in 2026? Martin Pring analyzes Bitcoin from various angles and shares his perspective.... READ MORE

What's on tap for 2026? Here's a deep dive into the five charts that matter most as this bull market matures.... READ MORE

Before We Dive In… Ever watch a stock take off and think, “I wish I had gotten in earlier”? You probably could have. It’s just that early leaders rarely look like leaders at first. The good news is that there are ways to spot and measure emerging strength before... READ MORE

Though the NIFTY is trading just below lifetime highs, it appears to be in a zone of indecision. What's the best strategy in a setting where any adverse trigger could make the market vulnerable?... READ MORE

Curious why silver is outperforming gold? Here's what's driving the move, what the charts show, and how traders can manage risk during this rally.... READ MORE

Before We Dive In… After John Murphy’s 10 Laws, a nagging question remains: where do you actually begin once you’ve loaded your chart? Maybe you weren’t expecting it, but the answer isn’t an indicator or setup. Instead, it begins with a sequence of questions. You see,... READ MORE

What does next year have in store for the bond market? Treasury yields, the yen, and credit spreads are expected to shape fixed-income returns in 2026. Which charts should you be watching? Find out here.... READ MORE

Larry Williams presents his full-year 2026 market outlook, explaining why many popular bearish forecasts don’t align with history or market data. With the help of cycles, valuations, and employment trends, Larry outlines what investors can realistically expect in the year ahead.... READ MORE

Gold's historic leadership may be shifting. A critical Gold/CRB signal suggests a potential commodity bull market and rising affordability risks ahead. ... READ MORE
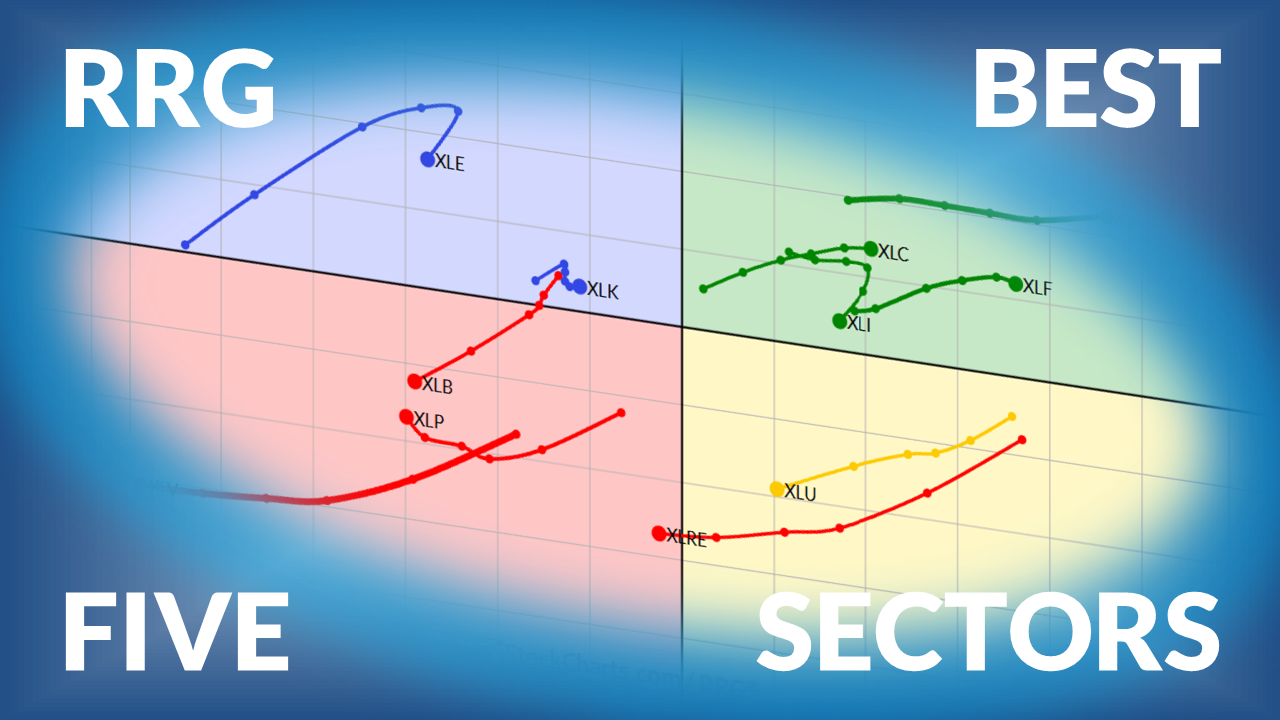

Weekly Sector Rotation Update for US Sectors based on Relative Rotation Graphs... READ MORE

With the Nifty now in a sideways consolidation, what will it take to reignite upward momentum? And what does the truncated week ahead look like for the Indian market?... READ MORE

Mary Ellen McGonagle takes a close look at some seminconductor and networking names that J.P. Morgan has ranked as top picks for the new year. What are her thoughts?... READ MORE

The S&P 500 defends key support after a CPI surprise. Explore what the charts reveal about stocks, crypto, and precious metals.... READ MORE
Tom looks at the last week's market action and what it means for bulls.... READ MORE

Bitcoin and the S&P 500 often move in tandem, but when they move in opposite directions, it's time to pay attention. Find out what Tom Bowley's analysis reveals about Bitcoin signaling an early warning.... READ MORE

These three indicators will filter out the noise and identify whether the stock market is bullish or bearish. This, in turn, will help you determine whether you should remain invested or not. Explore these indicators and find out which key levels to watch.... READ MORE
Joe Rabil of Rabil Stock Research looks at stocks rotating after a long bearish, discusses the prospects of a Santa Claus rally, and breaks down viewer-requested stocks.... READ MORE

While equities have remained relatively calm during this holiday season, oil prices have been under pressure. Even as energy stocks are performing better than crude, the overall trend remains bearish.... READ MORE

Martin Pring analyzes the two areas that could see a significant upside move if a peace settlement in the conflict in Ukraine is reached.... READ MORE


David Keller explains how to spot when a stock transitions from distribution to accumulation, and how you can use scanning, alerts, and scheduled scans to find the next breakout.... READ MORE
Value stocks are showing signs of strength, but it will take strength from sectors such as Energy and Financials to push this asset group higher. Learn about which charts could provide clues on the value vs. growth trade. ... READ MORE

The broader structure of the Nifty remains bullish, but the index is navigating a key inflection zone. Will the next week extend the trend?... READ MORE

Since the April low, the S&P 500 has shifted from a strong uptrend into a clear consolidation. Dave Keller, CMT, introduces a “traffic light” charting technique to define key support and resistance levels—and spot when sideways markets finally break into accumulation or distribution.... READ MORE

Are semiconductors due for a correction? Tom Bowley analyzes the longer-term chart of the Dow Jones US Semiconductors Index. Find out what his analysis reveals.... READ MORE