MEMBERS ONLY
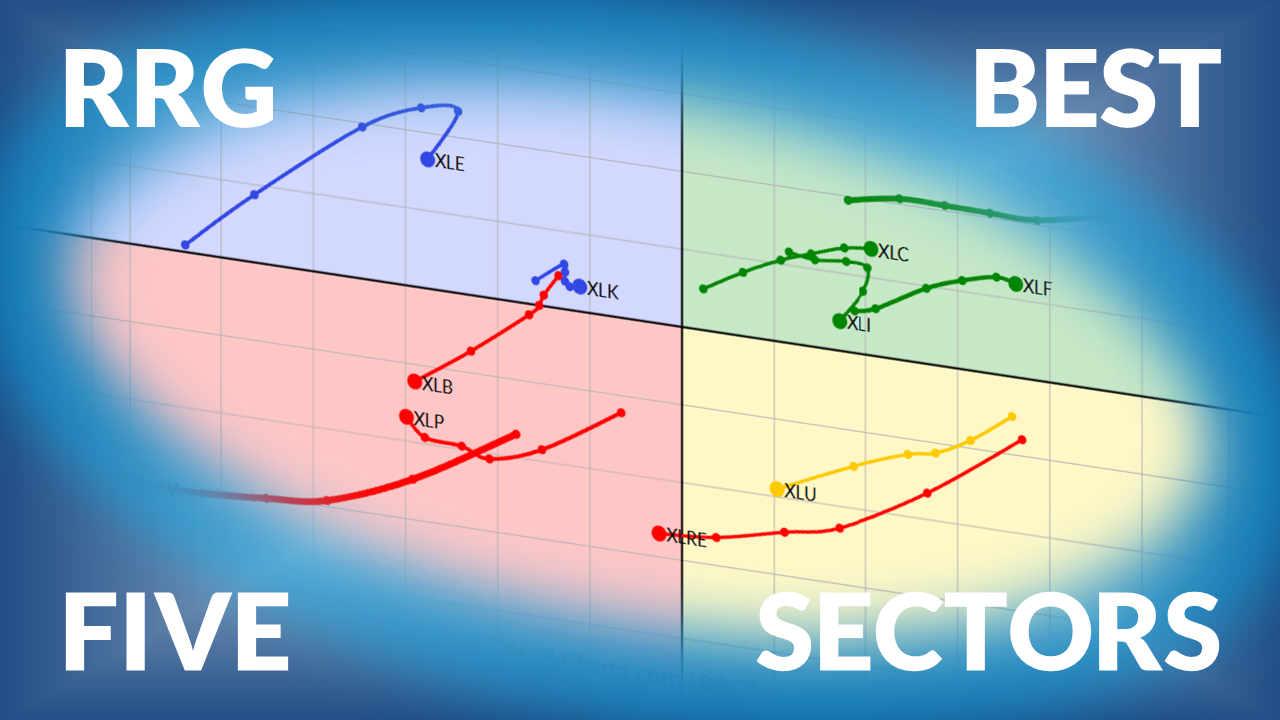
The Best Five Sectors This Week, #40

Julius provides his weekly update on US Sector Rotation based on Relative Rotation Graphs.... READ MORE
Julius provides his weekly update on US Sector Rotation based on Relative Rotation Graphs.... READ MORE

Mid-cap stocks have lagged the market of late, market breadth is weakening, and quality stocks may be out of favor. Here are the macro factors that could provide a boost to mid-cap stocks.... READ MORE


Before We Dive In… Ever wish you had a dashboard that flickers between “caution” and “go”? That’s what these Key Ratios are. Wall Street’s caution vs. go signal. They don’t offer trade signals, but they do give you a vibe check, helping you figure out if investors... READ MORE


The NIFTY's current technical setup reflects a market in the process of challenging a key resistance zone. But what does the next week hold?... READ MORE

ary Ellen reviews the week’s market action, highlighting leadership shifts in semiconductors, health care, utilities, and alternative energy. As sector rotation continues, she also shares how biotechs, small caps, and select quantum and crypto names are setting up with new opportunities. New videos from Mary Ellen premiere weekly on... READ MORE


The stock market pulled back sharply this week as volatility spiked. Learn what key support levels, sentiment shifts, and charts are telling investors.... READ MORE


Arthur Hill takes a deep dive into charts of QQQ, healthcare stocks, and tech stocks. ... READ MORE

Julius de Kempenaer, creator of RRG Charts, reveals why XLK & XLC remain the key market drivers while defensive sectors struggle. He also examines how asset class rotation still favors stocks over bonds—and what that means for investors watching sector leadership.... READ MORE


We highlight three stocks that have experienced strong gains since August, but are now testing key support levels. Will support hold, or will the bull market be brought into question?... READ MORE

Before We Dive In… You can do a lot with MarketCarpets—analyze sectors, spot outliers, gauge technical strength, the whole deal. But let’s cut the fat. You just want a fast, visual read on what’s happening now. So, let’s get to it. I’ll show you how.... READ MORE

Tech stocks stumbled after a strong run. See what QQQ's chart says about the next market move and how to prepare your portfolio.... READ MORE

Your weekly update and ranking of US sectors based on Relative Rotation Graphs.... READ MORE

The Nifty is consolidating with a slightly positive bias. Here's an analysis of the index and a look at sector performance.... READ MORE

U.S. stocks and global markets are hitting new highs, fueled by Fed rate cut hopes and AI optimism. Here’s what investors should keep an eye on.... READ MORE


The S&P 500 has broken above 6700! Tom recaps another week of all-time highs and sector strength, with healthcare leading the surge; he spotlights 10 top stocks, including Tesla, Johnson & Johnson, and more that are showing fresh upside momentum. This video premiered on October 2, 2025.... READ MORE


Discover why the S&P 500 is at its most overvalued level in history. See earnings trends, valuation ranges, and what rising P/E ratios mean for investors heading into 2026.... READ MORE

Soft jobs data raises Fed cut odds as stocks enter Q4 strong. Discover which sectors lead on RRG, Health Care's rebound, and Energy's outlook.... READ MORE

Join Grayson and Dave as they reveal their top 10 stock charts to watch this October.... READ MORE

Joe Rabil of Rabil Stock Research shows how to use the 18-MA to identify trend, momentum, and support/resistance, before then reviewing the latest S&P market conditions. He also covers the IWM and stock requests such as ACT, EQNR, FLNG, SAP, FCX, OSK, and VNT, pointing out... READ MORE


Frank reviews the S&P 500, key ETFs, and major asset classes as September 2025 ends and the fourth quarter begins. He highlights surprising market calm, talks seasonality patterns, and makes comparisons to 2017 and 2018. His analysis covers MSOS cannabis, biotech ETFs, Bitcoin’s October seasonality, and gold’... READ MORE

Stocks rally as Q3 ends, yields creep higher, metals shine, and the dollar moves sideways. Explore key trends in equities, bonds, commodities, and currencies.... READ MORE
The NIFTY is facing consistent resistance, failing to break out of a trading range; where does it go from here? Meanwhile, sectors are facing a lack of leadership.... READ MORE

Before We Dive In… If you’ve never checked whether your chart is set to log scale or arithmetic scale, you might be looking at a distorted picture without even knowing it. Not a great way to start your analysis. One small setting, one HUGE impact. Let’s make sure... READ MORE
Mary Ellen breaks down where strength is emerging beneath the surface of the markets, highlighting leadership in energy stocks, utilities, and industrials. She then shares setups in coal, natural gas, and electricity names, along with constructive moves in DOW components like INTC, IBM, AAPL, and CAT. In addition, she takes... READ MORE

Discover why September often brings stock market weakness, how sentiment indicators like CPCE & VIX signal caution, and what investors should watch next.... READ MORE


Martin breaks down two key intermarket relationships and what they portend for the market - the US vs. the rest of the world ($SPX/VEU) and gold vs. stocks ($GOLD/$SPX).... READ MORE

The SPY has traded above its 50-day simple moving average for 102 days, commodities are in a bull market, and crude oil is starting to turn up. Explore what Arthur Hill's analysis uncovers some of the activity taking place below the surface.... READ MORE

Stocks pulled back as yields and the dollar rose. See the key charts and levels to watch, plus how to track them using StockCharts tools.... READ MORE

Moving average breadth indicators have not been confirming recent highs for the S&P 500, suggesting that investors should approach the current uptrend phase with caution.... READ MORE


Larry compares Bitcoin and gold, looking at their shared appeal; he notes caution signals for Bitcoin and similar risks for gold. He also revisits past forecasts and updates his market outlook.... READ MORE
Joe highlights key setups in the energy sector, reviewing stocks such as XOM, CVX, VLO, and SU while explaining patterns like reverse divergence, zero line reversals, and low ADX conditions. He then analyzes the S&P market conditions, covering sentiment, volatility, trend, and momentum across multiple time frames, noting... READ MORE

Tom recaps the week, then turns his attention to the Mag 7 stocks after short-term sentiment warnings appeared in the market. He reviews key charts showing bearish engulfing patterns, resistance tests, and potential pullbacks in AAPL, MSFT, NVDA, META, GOOGL, TSLA, and AMZN, noting that six of the seven... READ MORE

The Russell 2000 ETF (IWM) logged a record weekly close, triggering a bullish breakout target of $322. Explore why small-caps may thrive with Fed rate cuts, supportive seasonality, and strong relative strength versus large caps.... READ MORE

Weekly update on US sector rotation ranking based on Relative Rotation Graphs... READ MORE

The price action in the Nifty reflects a potential breakout buildup. But will it be able to break out of the resistance? Here's what you need to look for in the charts.... READ MORE

Dow Theory has flashed a bearish non-confirmation signal. Dave breaks down the implications of this ominous pattern and analyzes some of the key transportation stocks that have caused this macro divergence.... READ MORE

Following the Fed's rate cut, the price action in several markets indicated a short-term reversal. Martin suggests monitoring these charts and their technical signals in the coming weeks.... READ MORE
Join Tom Bowley, EarningsBeats.com's Chief Market Strategist, as he recaps last week's action, especially Wednesday's action after the Federal Reserve finally decided to continues its 2024 rate-cutting campaign. Tom dives into what areas of the stock market were working after the decision... READ MORE
In this video, Joe shows viewers how to use a deep pullback in RSI as a buying opportunity. He uses two different settings for RSI in order to identify when a stock is a getting a great setup during an uptrend, and presents several examples on weekly and daily charts.... READ MORE
While technology stocks have stalled out over the last six weeks, other growth sectors have stepped into a leadership role. Here are the charts Dave uses regularly to track leadership themes, and identify when new sectors are improving in relative strength terms.... READ MORE