MEMBERS ONLY
3 S&P 500 Charts That Point to the Next Big Move

by Frank Cappelleri,
Founder & President, CappThesis, LLC
Follow along with Frank as he presents the outlook for the S&P 500, using three key charts to spot bullish breakouts, pullback zones, and MACD signals. Frank compares bearish and bullish setups using his pattern grid, analyzing which of the two is on top, and explains why he&...
READ MORE
MEMBERS ONLY

G7 Meeting in Canada Could Be Opportune Time for Accumulating Canadian Dollar and Canadian Equities

by Martin Pring,
President, Pring Research
The Canadian dollar peaked in 2007 and 2011 at around $1.05, and it has been zig-zagging downwards ever since. Now at a lowly 73 cents USD, the currency looks as if it may be in the process of bottoming, or at the very least entering a multi-year trading range....
READ MORE
MEMBERS ONLY

Navigate the Stock Market with Confidence

by Jayanthi Gopalakrishnan,
Director of Site Content, StockCharts.com
When you see headlines about geopolitical tensions and how the stock market sold off on the news, it can feel unsettling, especially when it comes to your hard-earned savings. But what you might not hear about in the news is what the charts are indicating.
Look at what happened in...
READ MORE
MEMBERS ONLY

Major Shift in the Markets! Here's Where the New Strength Is

by Mary Ellen McGonagle,
President, MEM Investment Research
In this video, Mary Ellen spotlights breakouts in Energy and Defense, Technology sector leadership, S&P 500 resilience, and more. She then unpacks the stablecoin fallout hitting Visa and Mastercard, highlights Oracle's earnings breakout, and shares some pullback opportunities.
This video originally premiered June 13, 2025. You...
READ MORE
MEMBERS ONLY
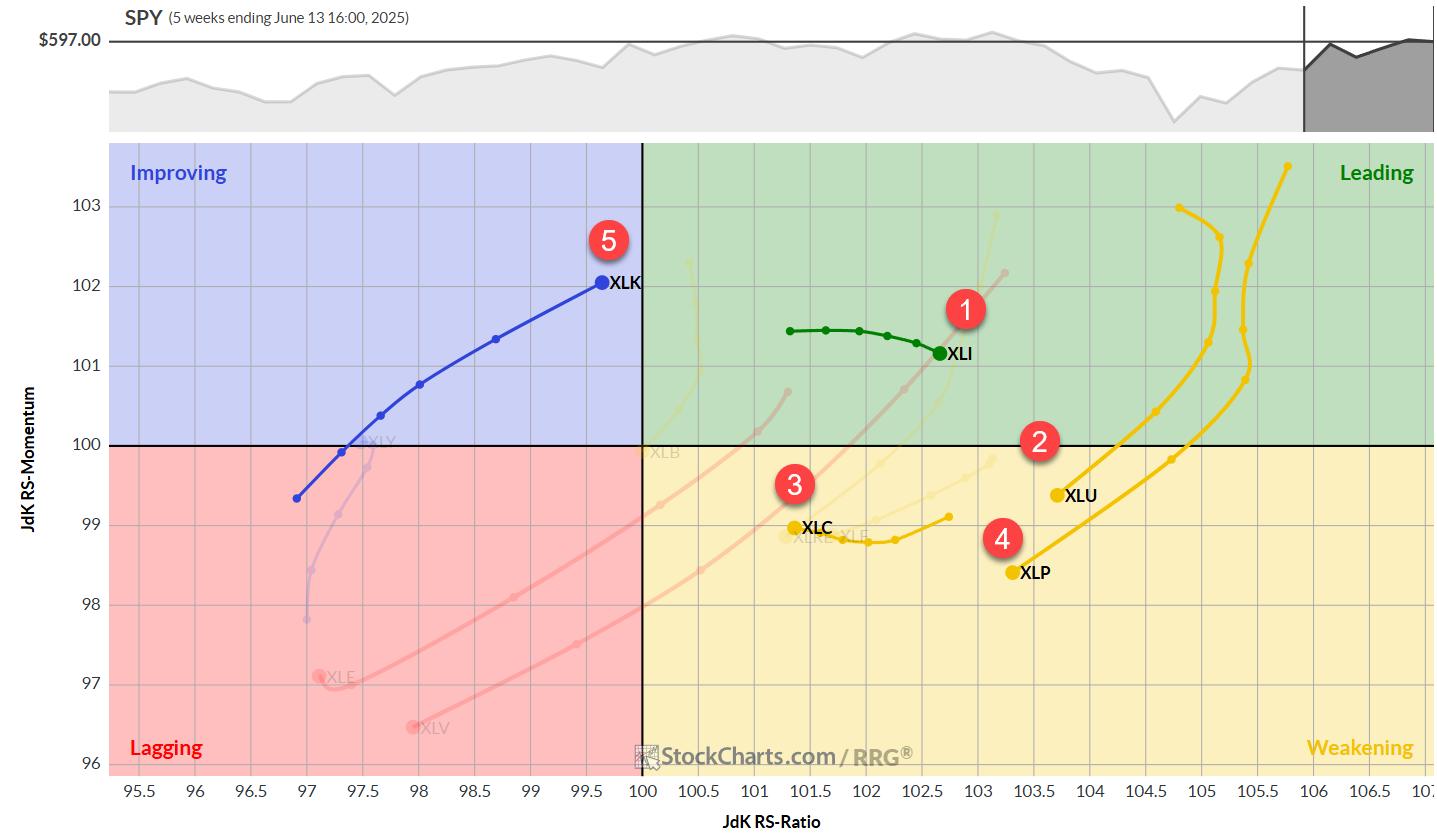
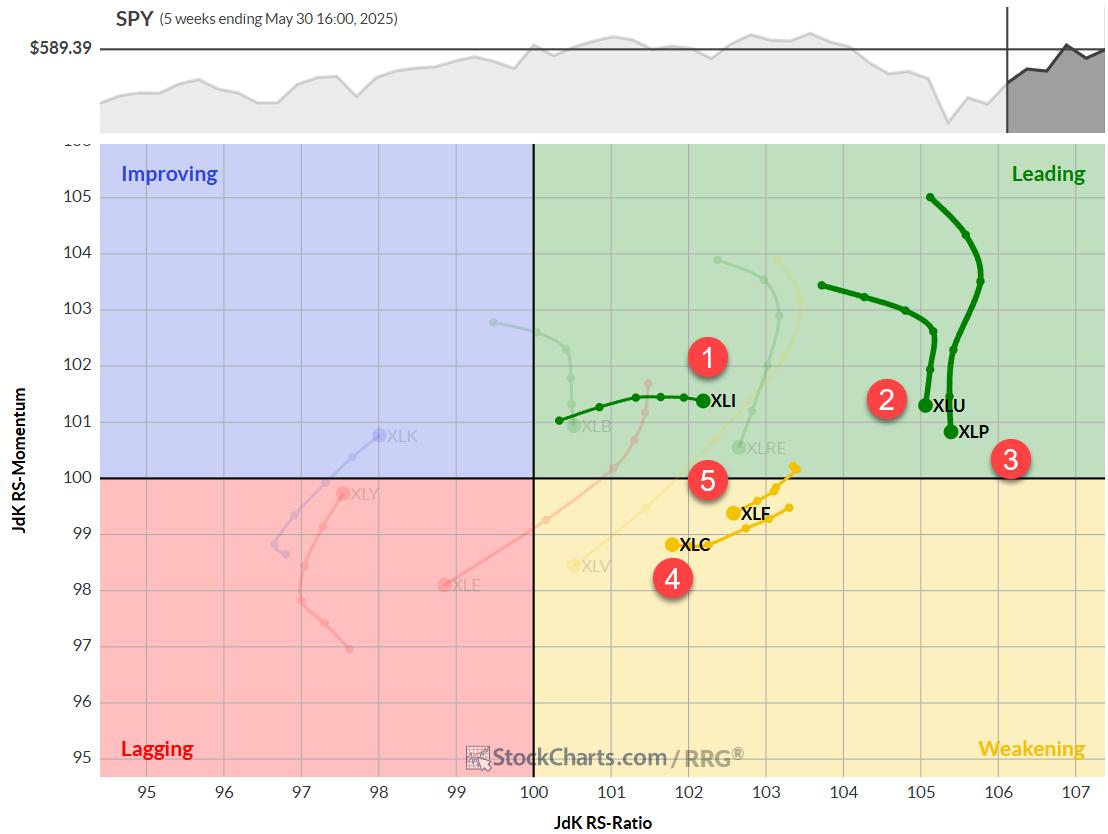
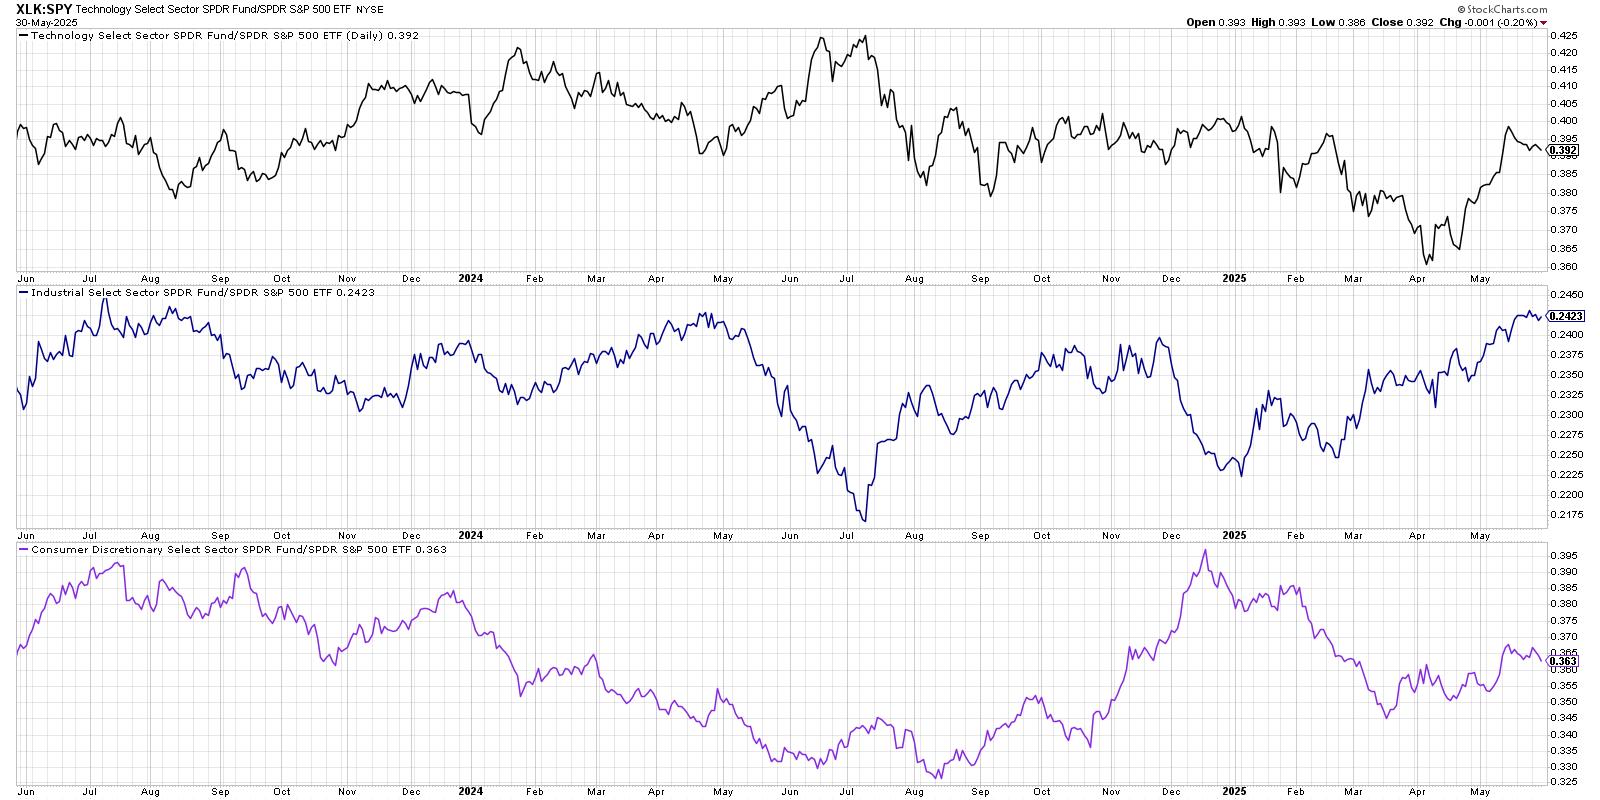
The Best Five Sectors, #23

by Julius de Kempenaer,
Senior Technical Analyst, StockCharts.com
This Time Technology Beats Financials
After a week of no changes, we're back with renewed sector movements, and it's another round of leapfrogging.
This week, technology has muscled its way back into the top five sectors at the expense of financials, highlighting the ongoing volatility in...
READ MORE
MEMBERS ONLY

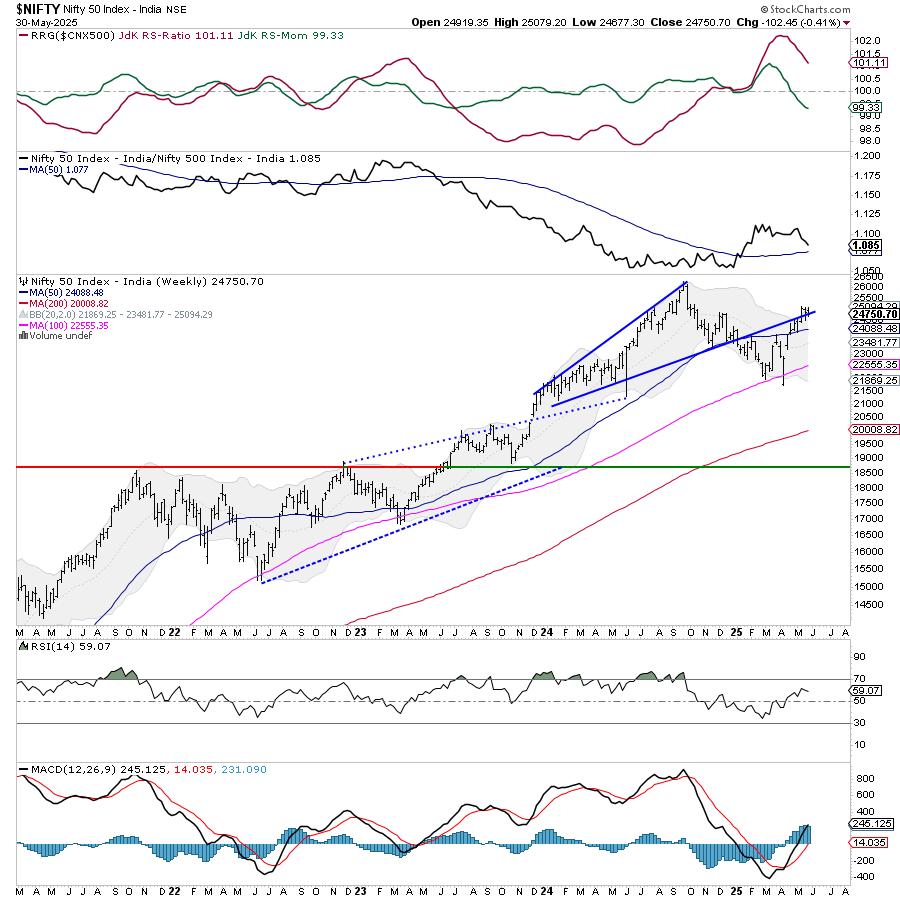
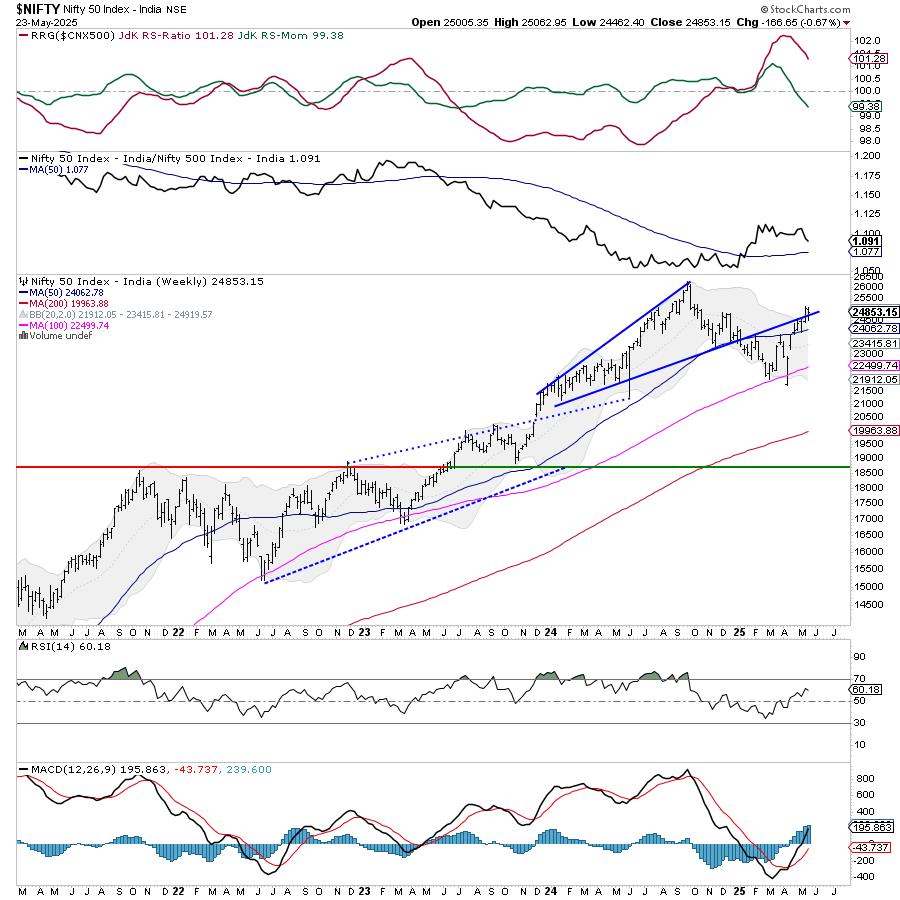
Week Ahead: NIFTY May Continue Showing Resilience; Broader Markets May Relatively Outperform

by Milan Vaishnav,
Founder and Technical Analyst, EquityResearch.asia and ChartWizard.ae
An attempt to break out of a month-long consolidation fizzled out as the Nifty declined and returned inside the trading zone it had created for itself. Over the past five sessions, the markets consolidated just above the upper edge of the trading zone; however, this failed to result in a...
READ MORE
MEMBERS ONLY

Bearish Divergence Suggests Caution For S&P 500

by David Keller,
President and Chief Strategist, Sierra Alpha Research
With Friday's pullback after a relatively strong week, the S&P 500 chart appears to be flashing a rare but powerful signal that is quite common at major market tops. The signal in question is a bearish momentum divergence, formed by a pattern of higher highs in...
READ MORE
MEMBERS ONLY

What the S&P 500, VIX, and ARKK are Telling Us Now
by Frank Cappelleri,
Founder & President, CappThesis, LLC
While the S&P 500 ($SPX) logged a negative reversal on Wednesday, the Cboe Volatility Index ($VIX), Wall Street's fear gauge, logged a positive reversal. This is pretty typical: when the S&P 500 falls, the VIX rises.
Here's what makes it interesting: the...
READ MORE
MEMBERS ONLY

10‑Year Yield Warning! ADX + RSI Point to a Major Shift

by Joe Rabil,
President, Rabil Stock Research
Joe kicks off this week's video with a multi‑timeframe deep dive into the 10‑year U.S. Treasury yield (TNX), explaining why a sideways coil just below the 5% level could be "downright scary" for equities. From there, he demonstrates precise entry/exit timingwith a...
READ MORE
MEMBERS ONLY

Unlocking Stock Market Insights: Identify Global Opportunities with StockCharts' Market Summary
by Jayanthi Gopalakrishnan,
Director of Site Content, StockCharts.com
The U.S. stock market has been painting a subtle picture recently. While the broader indexes, such as the S&P 500 ($SPX), Nasdaq Composite ($COMPQ), and Dow Jones Industrial Average ($INDU), are indeed grinding higher, the daily movements have been relatively subdued. This is a noticeable shift from...
READ MORE
MEMBERS ONLY

This Widely Used Commodity Could Be About to Surprise Us on the Upside
by Martin Pring,
President, Pring Research
Chart 1 lays out the long-term momentum (KST) relationship between gold, copper, and crude oil for the last 30 years. The arrows slant towards the right, indicating that gold leads copper, which subsequently turns up ahead of oil. Gold reversed to the upside in early 2023 and copper at the...
READ MORE
MEMBERS ONLY
Is the S&P 500 Flashing a Bearish Divergence?
by David Keller,
President and Chief Strategist, Sierra Alpha Research
Unlock the power of divergence analysis! Join Dave as he breaks down what a bearish momentum divergence is and why it matters. Throughout this video, Dave illustrates how to confirm (or invalidate) the signal on the S&P500, Nasdaq100, equal‑weighted indexes, semiconductors, and even defensive names like AT&...
READ MORE
MEMBERS ONLY
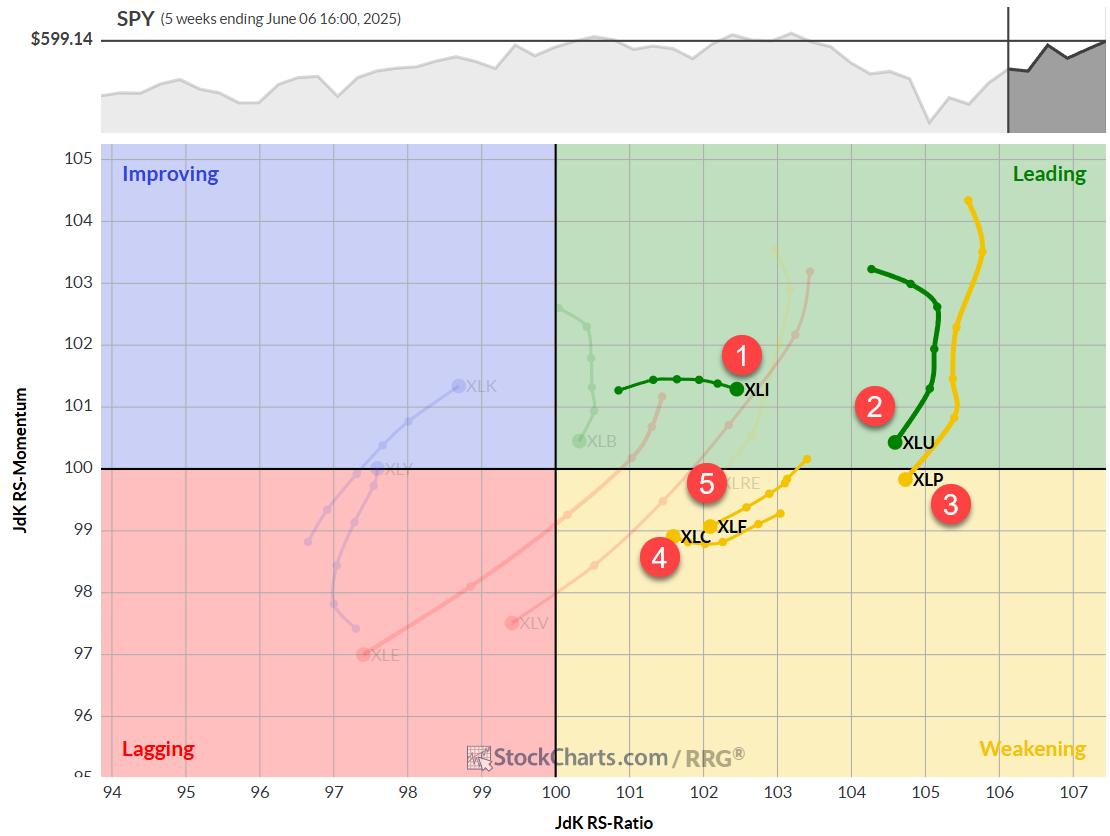
The Best Five Sectors, #22
by Julius de Kempenaer,
Senior Technical Analyst, StockCharts.com
Sector Rotation: A Week of Stability Amidst Market Dynamics
Last week presented an intriguing scenario in our sector rotation portfolio.
For the first time in recent memory, we witnessed complete stability across all sector positions -- no changes whatsoever in the rankings.
1. (1) Industrials - (XLI)
2. (2) Utilities...
READ MORE
MEMBERS ONLY

Week Ahead: NIFTY's Behavior Against This Level Crucial as Index Looks at Potential Resumption of Up Move
by Milan Vaishnav,
Founder and Technical Analyst, EquityResearch.asia and ChartWizard.ae
After consolidating for two weeks, the Nifty finally appeared to be flexing its muscles for a potential move higher. Over the past five sessions, the Nifty traded with an underlying positive bias and ended near the week's high point while also attempting to move past a crucial pattern...
READ MORE
MEMBERS ONLY

From Tariffs to Tech: Where Smart Money's Moving Right Now
by Mary Ellen McGonagle,
President, MEM Investment Research
Stay ahead of the market in under 30 minutes! In this video, Mary Ellen breaks down why the S&P 500 just broke out, which sectors are truly leading (industrials, technology & materials), and what next week's inflation data could mean for your portfolio.
This video originally...
READ MORE
MEMBERS ONLY

Your Weekly Stock Market Snapshot: What It Means for Your Investments
by Jayanthi Gopalakrishnan,
Director of Site Content, StockCharts.com
This week, we got a smorgasbord of jobs data — JOLTS, ADP, weekly jobless claims, and the nonfarm payrolls (NFP). Friday's NFP, the big one the market was waiting for, showed that 139,000 jobs were added in May, which was better than the expected 130,000. Unemployment rate...
READ MORE
MEMBERS ONLY
S&P 500 on the Verge of 6,000: What's at Stake?
by Jayanthi Gopalakrishnan,
Director of Site Content, StockCharts.com
A lot has happened in the stock market since Liberation Day, keeping us on our toes. Volatility has declined significantly, stocks have bounced back from their April 7 low, and the economy has remained resilient.
If you're still feeling uncertain, though, you're not alone. The stock...
READ MORE
MEMBERS ONLY
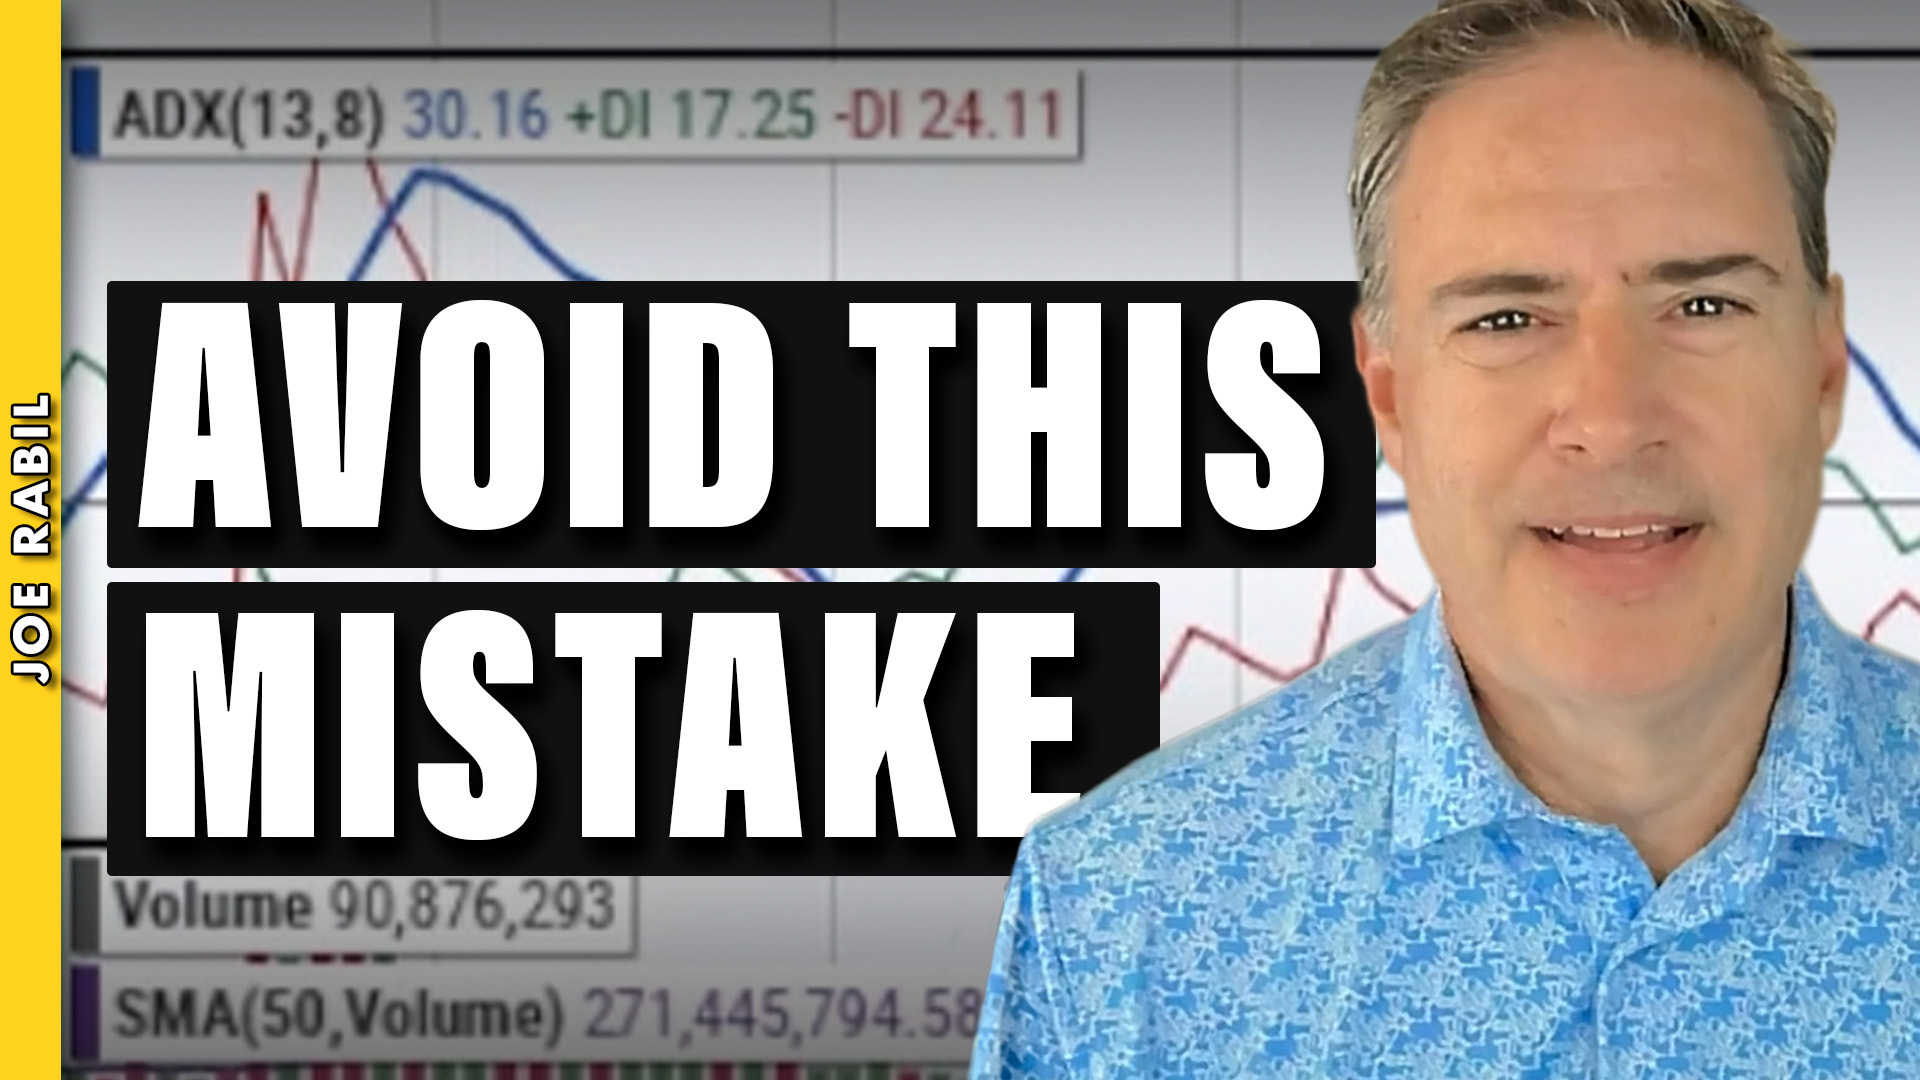
Why ADX Can Mislead You — And How to Avoid It
by Joe Rabil,
President, Rabil Stock Research
In this video, Joe walks through a comprehensive lesson on using the ADX (Average Directional Index) as part of a technical analysis strategy. Joe explains the key components of the ADX indicator, how to interpret DI+ and DI- lines, and how to identify strong or weak trends in the market....
READ MORE
MEMBERS ONLY
S&P 500 Bullish Patterns: Are Higher Highs Ahead?
by Frank Cappelleri,
Founder & President, CappThesis, LLC
In this market update, Frank breaks down recent developments across the S&P 500, crypto markets, commodities, and international ETFs. He analyzes bullish and bearish chart patterns, identifies key RSI signals, and demonstrates how "Go No Go Charts" can support your technical analysis. You'll also...
READ MORE
MEMBERS ONLY

This Important Metal Could Be on the Verge of a Mega-Breakout
by Martin Pring,
President, Pring Research
Gold has been on a tear since 2022, leaving other metals in the dust. Nevertheless, it's important to remember that the yellow metal has a strong tendency to lead commodities in general, which implies the likelihood of inflationary pressures in the commodity pits going forward. The leads and...
READ MORE
MEMBERS ONLY

How I Find Up-trending Stocks Every Week (Step-by-Step Scan Tutorial)
by David Keller,
President and Chief Strategist, Sierra Alpha Research
In this video, Dave shares his weekly stock scan strategy used to identify bullish stock trends. He illustrates how to set up this powerful scan, reveals the tips and tricks he uses to identify the most constructive patterns, and explains the four winning chart setups that tend to come up...
READ MORE
MEMBERS ONLY
Hedge Market Volatility with These Dividend Aristocrats & Sector Leaders
by Mary Ellen McGonagle,
President, MEM Investment Research
In this video, Mary Ellen highlights key areas of the stock market that gained strength last week, including Staples and Aerospace stocks. She also shares several Dividend Aristocrat stocks that can help stabilize your portfolio in times of market volatility.Whether you're seeking defensive plays or looking to...
READ MORE
MEMBERS ONLY
The Best Five Sectors, #21
by Julius de Kempenaer,
Senior Technical Analyst, StockCharts.com
Staples and Tech Swap Positions Again
The weekly sector rotation continues to paint a picture of a market in flux, with defensive sectors gaining ground while cyclicals take a step back. This week's shifts underscore the ongoing volatility and lack of clear directional trade that's been...
READ MORE
MEMBERS ONLY
Week Ahead: NIFTY Stays in Defined Range; Moving Past This Level Crucial for Resumption of Upmove
by Milan Vaishnav,
Founder and Technical Analyst, EquityResearch.asia and ChartWizard.ae
Over the past five sessions, the Indian equity markets headed nowhere and continued consolidating in a defined range.
In the previous weekly note, it was categorically expected that the markets might stay devoid of any directional bias unless they either took out the upper edge or violated the lower edge...
READ MORE
MEMBERS ONLY
Breakouts, Momentum & Moving Averages: 10 Must-See Stock Charts Right Now
by David Keller,
President and Chief Strategist, Sierra Alpha Research

by Grayson Roze,
Chief Strategist, StockCharts.com
Discover the top 10 stock charts to watch this month with Grayson Roze and David Keller, CMT. From breakout strategies to moving average setups, the duo walk through technical analysis techniques using relative strength, momentum, and trend-following indicators.
In this video, viewers will also gain insight into key market trends...
READ MORE
MEMBERS ONLY
Leadership Rotation Could Confirm Corrective Phase
by David Keller,
President and Chief Strategist, Sierra Alpha Research
There's no denying that the equity markets have taken on a decisively different look and feel in recent weeks.
We've compared the charts of the S&P 500 and Nasdaq 100, as well as leading growth stocks like Nvidia, to an airplane experiencing a "...
READ MORE
MEMBERS ONLY

Run Your Stock Portfolio Like a Pro Sports Team
by Grayson Roze,
Chief Strategist, StockCharts.com
Manage your stock portfolio like a pro! Learn stock portfolio management, trading strategy, and how to build stock watchlists like a professional investor with this insightful video from Grayson. He shares how to run your portfolio like a championship sports team—organizing stocks like players, keeping top performers in play,...
READ MORE
MEMBERS ONLY
Analyzing SIL, USO, and NVDA: Could These Bullish Patterns Trigger?
by Frank Cappelleri,
Founder & President, CappThesis, LLC
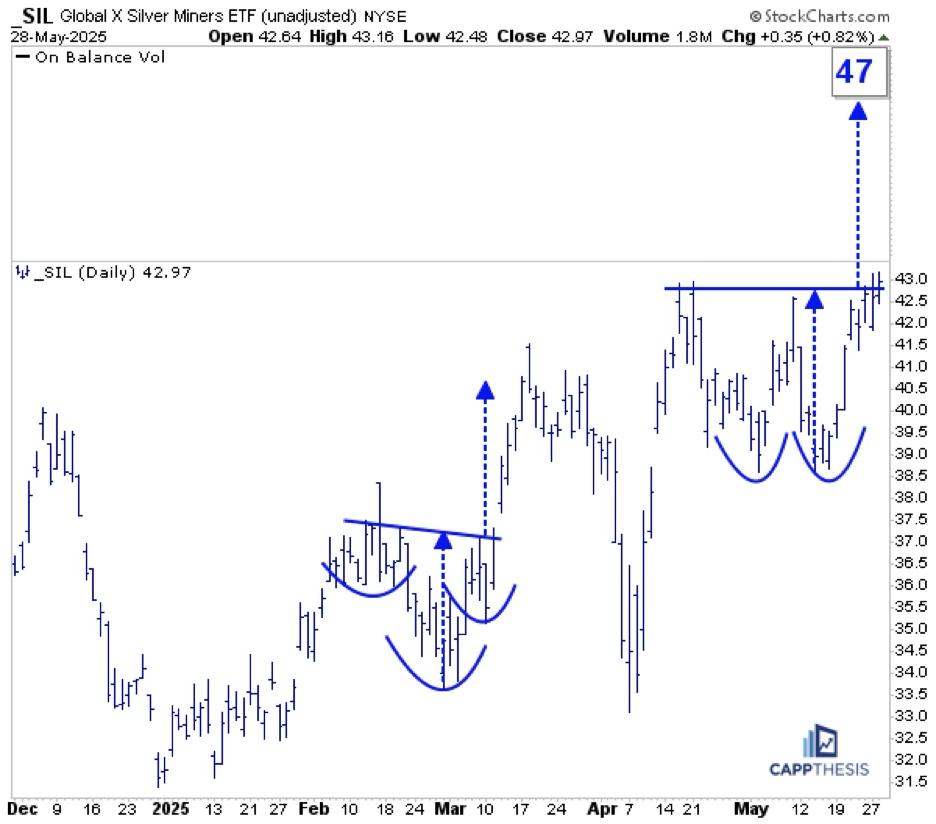
SIL Silver Miners
SIL was among the leaders yesterday and now is close to triggering this double-bottom bullish pattern. Staying above the 43-mark would target 47. That's not a big move, but let's remember that SIL is sporting bullish formations on its longer-term charts, too.
SIL...
READ MORE
MEMBERS ONLY

Nuclear Power Trio: OKLO, SMR, and CCJ in Focus

by Karl Montevirgen,
The StockCharts Insider
Nuclear energy stocks are on a tear, and Oklo Inc. (OKLO), Cameco Corp. (CCJ), and NuScale Power Corporation (SMR) are leading the charge, fueled by presidential executive orders, investor hype, and hopes for a nuclear-powered future.
Is It Time to Go Nuclear?
These names bucked the trend on Wednesday, rising...
READ MORE
MEMBERS ONLY

Top Sectors to Watch + The 18 SMA Setup Every Trader Should Know
by Joe Rabil,
President, Rabil Stock Research
In this video, Joe analyzes which sectors to focus on when selecting new stocks. He demonstrates how to use the 18-period simple moving average (SMA) on monthly, weekly, and daily charts to identify the strongest stock patterns and the best timeframes to trade. He then provides chart analysis on the...
READ MORE
MEMBERS ONLY

Larry Williams on the Fed, Interest Rates & Markets! What's Next?

by Larry Williams,
Veteran Investor and Author
In this must-see market update, Larry Williams returns with timely stock market analysis, trading insights, and macroeconomic forecasts. Discover what's next for the Federal Reserve, interest rates, and inflation — and how it could impact top stocks like Tesla (TSLA), Nvidia (NVDA), Apple (AAPL), and consumer staples (XLP).
This...
READ MORE
MEMBERS ONLY
Mixed Signals on the Charts? RRG Reveals Market Rotation Tension
by Julius de Kempenaer,
Senior Technical Analyst, StockCharts.com
Confused by mixed market signals? Follow along as Julius analyzes sector rotation, asset rotation, and global market trends using daily and weekly Relative Rotation Graphs (RRGs).
In this video, Julius puts the current sector rotation in perspective on both weekly and daily Relative Rotation Graphs (RRGs). He also examines asset...
READ MORE
MEMBERS ONLY
Is It A Pullback? Or is More Downside Ahead?
by Mary Ellen McGonagle,
President, MEM Investment Research
Get the latest stock market update with Mary Ellen McGonagle. Learn key downside signals, how to manage pullbacks, and which earnings reports could impact the market next week.
In this week's episode, Mary Ellen reviews where the markets currently stand and what to watch for to signal further...
READ MORE
MEMBERS ONLY

The Best Five Sectors, #20
by Julius de Kempenaer,
Senior Technical Analyst, StockCharts.com
Technology Back in Top-5
Last week's market decline of 2-2.5% (depending on the index) has led to some notable shifts in sector performance and rankings.
This pullback, coming after a strong rally, is changing the order of highs and lows on the weekly chart -- a particularly...
READ MORE
MEMBERS ONLY
Week Ahead: NIFTY Stays in Technically Challanging Situation; Sector Rotation Shows Likely Change In Leadership
by Milan Vaishnav,
Founder and Technical Analyst, EquityResearch.asia and ChartWizard.ae
After a very strong move in the week before this one, the markets chose to take a breather. Although they moved in a wide range, they ended the week on a mildly negative note after rebounding from their low point of the week. While defending the key levels, the markets...
READ MORE
MEMBERS ONLY

My Durable Advantage as an Investor is My Experience: Here are Seven Examples

by Gatis Roze,
Author, "Tensile Trading"
It scares me to admit I've been investing for over 50 years. It's been a great ride, and fortunately I'm still going strong. One of my investment mantras thru all these years has been Charlie Munger's quintessential advice: "try to be...
READ MORE
MEMBERS ONLY
What Happens When the S&P 500 Breaks Below Gap Support?
by David Keller,
President and Chief Strategist, Sierra Alpha Research
My main question going into this weekend was, "Will the S&P 500 finish the week above its 200-day moving average?" And while the S&P 500 did indeed finish the week above this long-term trend barometer, our main equity benchmark is now within the gap...
READ MORE
MEMBERS ONLY

Moving from Thrust Signals to a Bull Market

by Arthur Hill,
Chief Technical Strategist, TrendInvestorPro.com
The bullish signals stacked up in April and May, but most long-term breadth indicators are still bearish. SPY and QQQ showed signs of capitulation in early April and rebounded into mid April. A Zweig Breadth Thrust triggered on April 24th and several other thrust indicators turned bullish in May. We...
READ MORE
MEMBERS ONLY

Applying Key Ratios to the Broader Market Surge: Are We at the Threshold of a New Trend?
by Karl Montevirgen,
The StockCharts Insider
The financial media is flooded with commentary questioning whether the current rise in stock indexes is sustainable enough to mark the beginning of a new bull market. In short, have we gotten out of the woods, or are we in a clearing with more uncertainty to come?
There are many...
READ MORE
MEMBERS ONLY

S&P 500 Slide Explained: What Past Price Action Reveals About Market Dips
by Frank Cappelleri,
Founder & President, CappThesis, LLC
On Wednesday, only 4% of the S&P 500's holdings logged gains — a pretty rare occurrence. Since the start of 2024, this has only happened three other times:
* August 5, 2024: The last day of the summer correction
* December 18, 2024: The Fed's hawkish cut...
READ MORE