MEMBERS ONLY
Bearish ADX Signal on S&P Plays Out - Now What?

by Joe Rabil,
President, Rabil Stock Research
In this exclusive StockCharts video, Joe revisits a critical ADX signal that gave a major market warning, explaining the pattern and a new low ADX setup to watch. He breaks down SPY and QQQ support zones, sector rotation, and reviews viewer symbol requests including T, WBD, and more. Don'...
READ MORE
MEMBERS ONLY

How to Spot a Market Rebound Before Everyone Else Does

by Karl Montevirgen,
The StockCharts Insider
KEY TAKEAWAYS
* While the major indices represent the market's state, their market cap weighting can sometimes distort what's happening internally.
* Breadth indicators like the McClellan Oscillator provide insight into the internal dynamics of the market.
* Understanding how market participation happens within an index can help you...
READ MORE
MEMBERS ONLY

Stock Market Dips Below 200-Day Moving Average: Are Your Investments Ready for a Shift?

by Jayanthi Gopalakrishnan,
Director of Site Content, StockCharts.com
KEY TAKEAWAYS
* The broader indexes are breaking down technically, but their one-year performance is in positive territory,
* Percentage performance charts give a different perspective on the stock market's performance.
* Monitor percentage performance and market breadth to look for any signs of reversal.
The S&P 500 ($SPX)...
READ MORE
MEMBERS ONLY
5 Strong Stocks Defying the Bearish Market!

by David Keller,
President and Chief Strategist, Sierra Alpha Research
In this video, Dave analyzes the bearish rotation in his Market Trend Model, highlighting the S&P 500 breakdown below the 200-day moving average and its downside potential. He also identifies five strong stocks with bullish technical setups despite market weakness. Watch now for key technical analysis insights to...
READ MORE
MEMBERS ONLY

DP Trading Room: Market Sell-Off

by Erin Swenlin,
Vice President, DecisionPoint.com
The market sell-off continued in earnest after a brief respite on Friday. Uncertainty of geopolitical tensions and tariff talk has spooked the market and given the weakness of mega-cap stocks, we are likely to see more downside before a snapback rally.
Carl was off today so Erin had the controls!...
READ MORE
MEMBERS ONLY
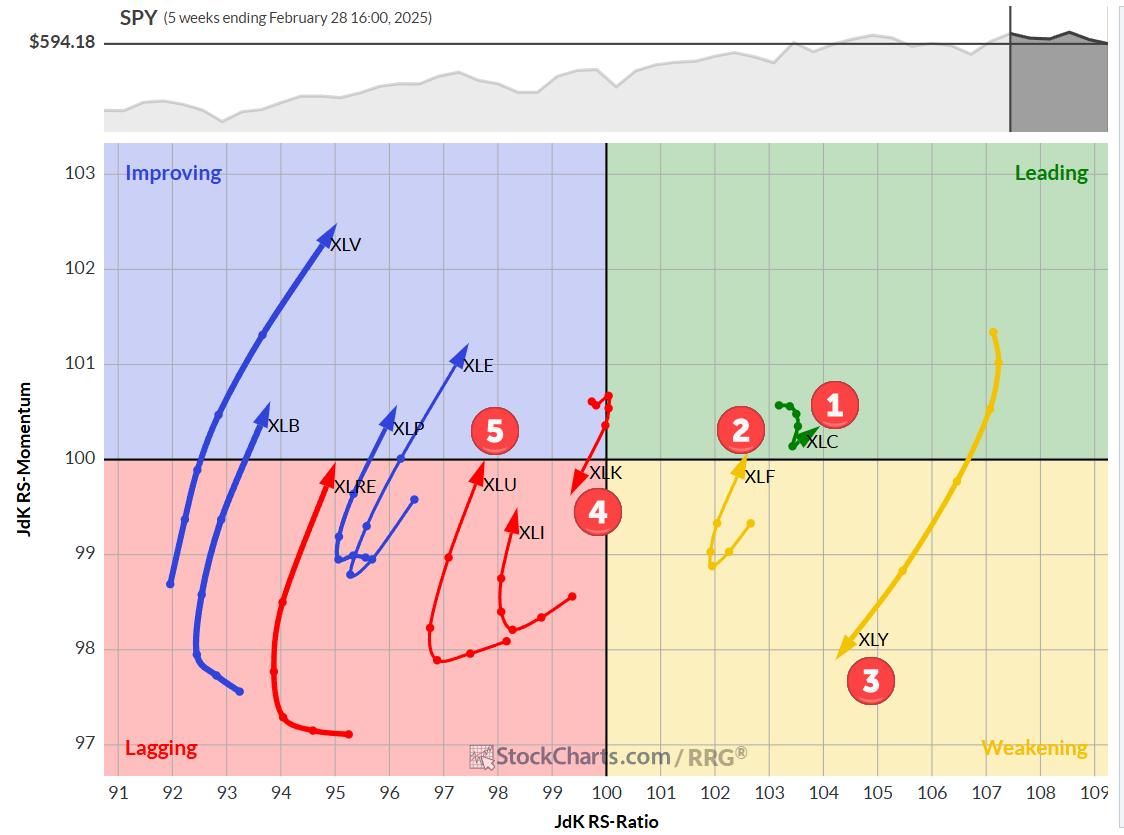
The Best Five Sectors, #10

by Julius de Kempenaer,
Senior Technical Analyst, StockCharts.com
KEY TAKEAWAYS
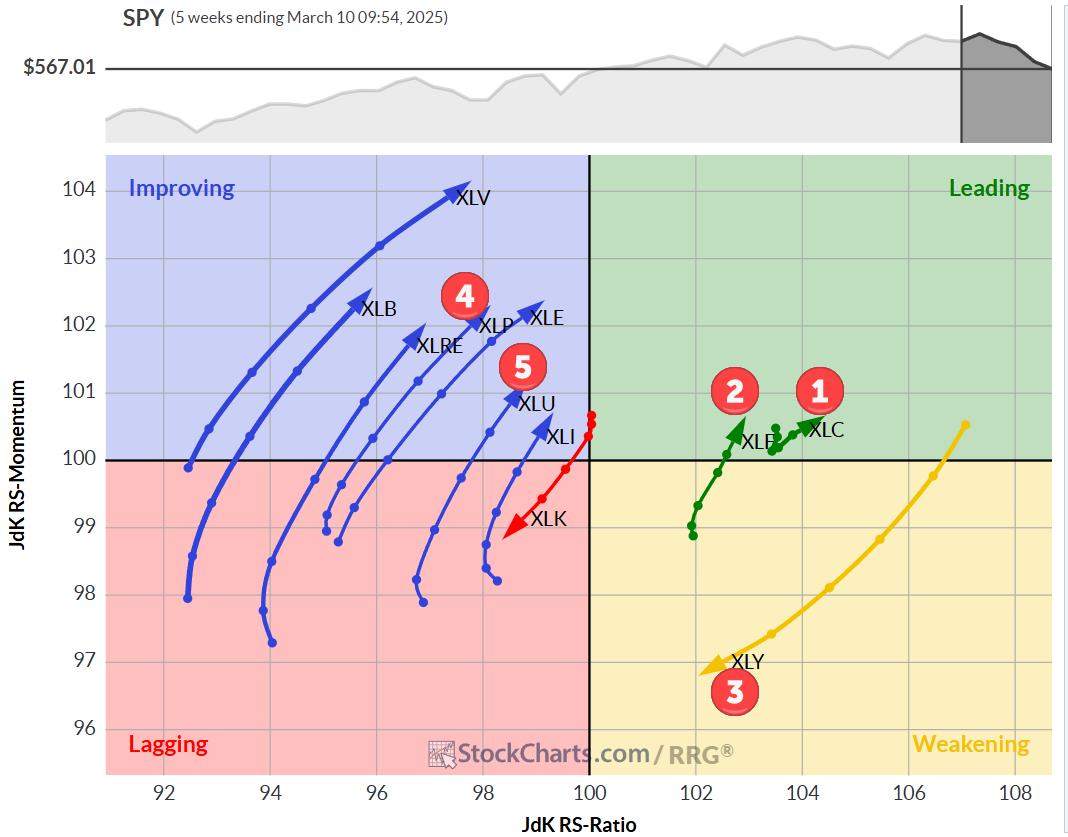
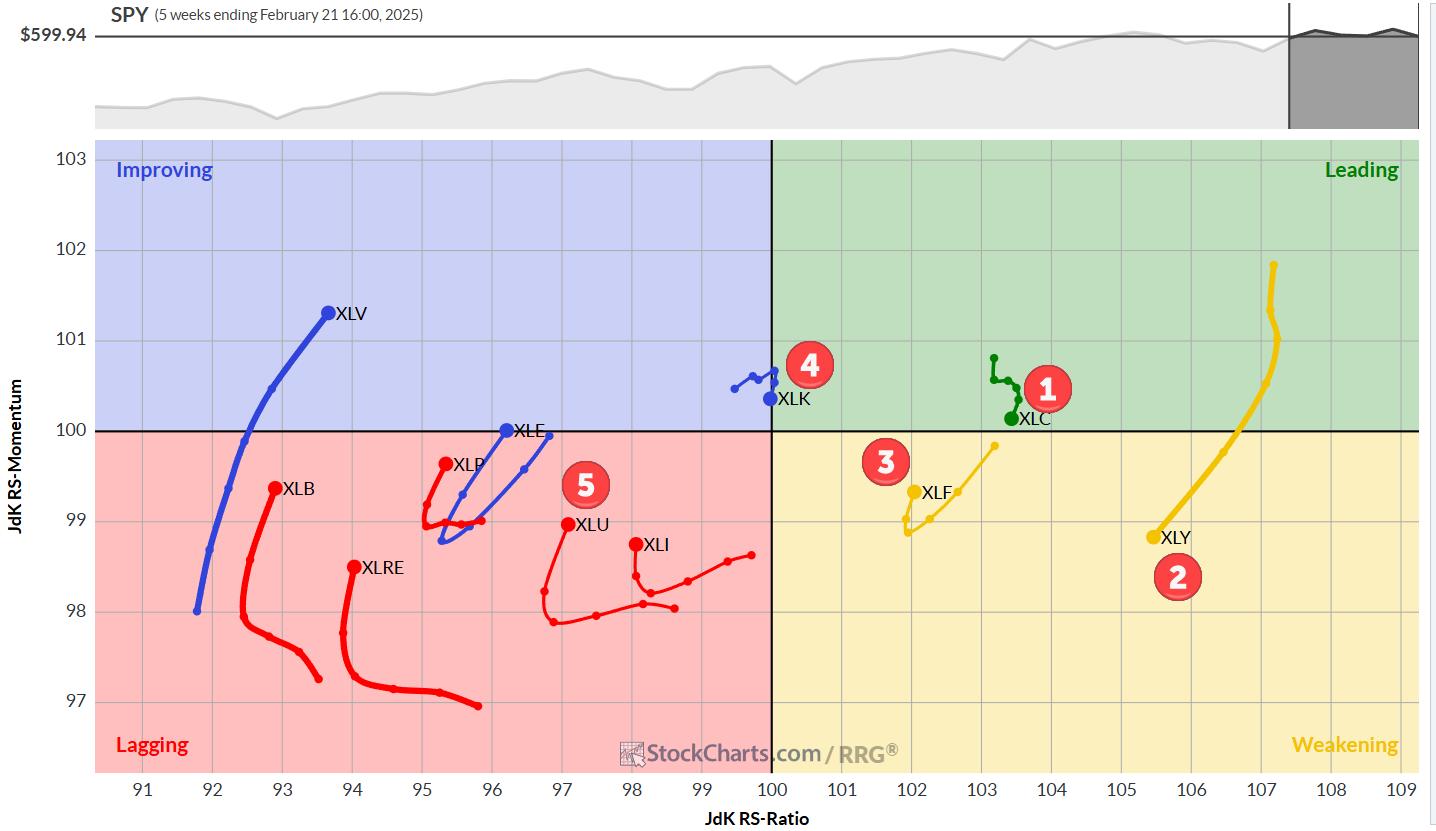
* Communication Services (XLC) maintains top spot, Tech (XLK) plummets
* Shift towards defensive sectors evident in rankings
* Consumer Discretionary (XLY) showing signs of weakness
* Portfolio slightly outperforming SPY benchmark
Sector Shake-Up: Defensive Moves and Tech's Tumble
Last week's market volatility stirred up the sector rankings,...
READ MORE
MEMBERS ONLY

Up Now, Down Later?

by Martin Pring,
President, Pring Research
The Hysteria
Last week I saw more references to the stock market and its sharp drop on cable TV than I can ever recall.
Normally, as Humphrey Neil, the father of contrarian thinking put it, "When everyone thinks the same, everyone is usually wrong." That's because...
READ MORE
MEMBERS ONLY
Sector Rotation Warning: More Downside Ahead for US Markets?
by Julius de Kempenaer,
Senior Technical Analyst, StockCharts.com
In this exclusive StockCharts video,Julius analyzes sector rotation in US markets, assessing recent damage and potential downside risks. He examines the Equal Weight RSP vs. Cap-Weighted SPX ratio and the stocks vs. bonds relationship to identify key market trends. Don't miss this deep dive into market rotation...
READ MORE
MEMBERS ONLY

My Downside Target for the S&P 500
by David Keller,
President and Chief Strategist, Sierra Alpha Research
KEY TAKEAWAYS
* Once our "line in the sand" of SPX 5850 was broken, that confirmed a likely bear phase for stocks.
* We can use Fibonacci Retracements to identify a potential downside objective based on the strength of the previous bull trend.
* A confirmed sell signal from the Newer...
READ MORE
MEMBERS ONLY
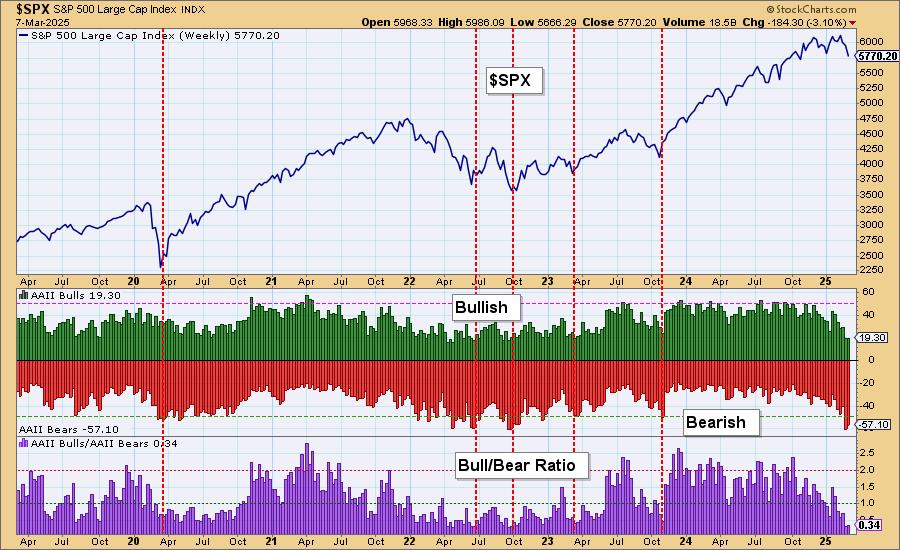
American Association of Individual Investors (AAII) Hitting Bearish Extremes
by Erin Swenlin,
Vice President, DecisionPoint.com
One thing to understand about sentiment measures is that they are contrarian. If investors are too bullish or too bearish, everyone has jumped on the bandwagon, and now it is time for the wheels to fall off.
Right now, we are seeing extraordinarily bearish sentiment coming out of the American...
READ MORE
MEMBERS ONLY

Navigating Tariffs: Master the Charts to Outsmart Market Volatility
by Jayanthi Gopalakrishnan,
Director of Site Content, StockCharts.com
KEY TAKEAWAYS
* Tariffs have caused shifts in investor sentiment.
* Investors are rotating out of offensive sectors and into defensive sectors.
* The US dollar has weakened relative to the Canadian dollar and Mexican peso.
Tariffs have thrown the stock market into dizzying moves, moving up and/or down based on whatever...
READ MORE
MEMBERS ONLY
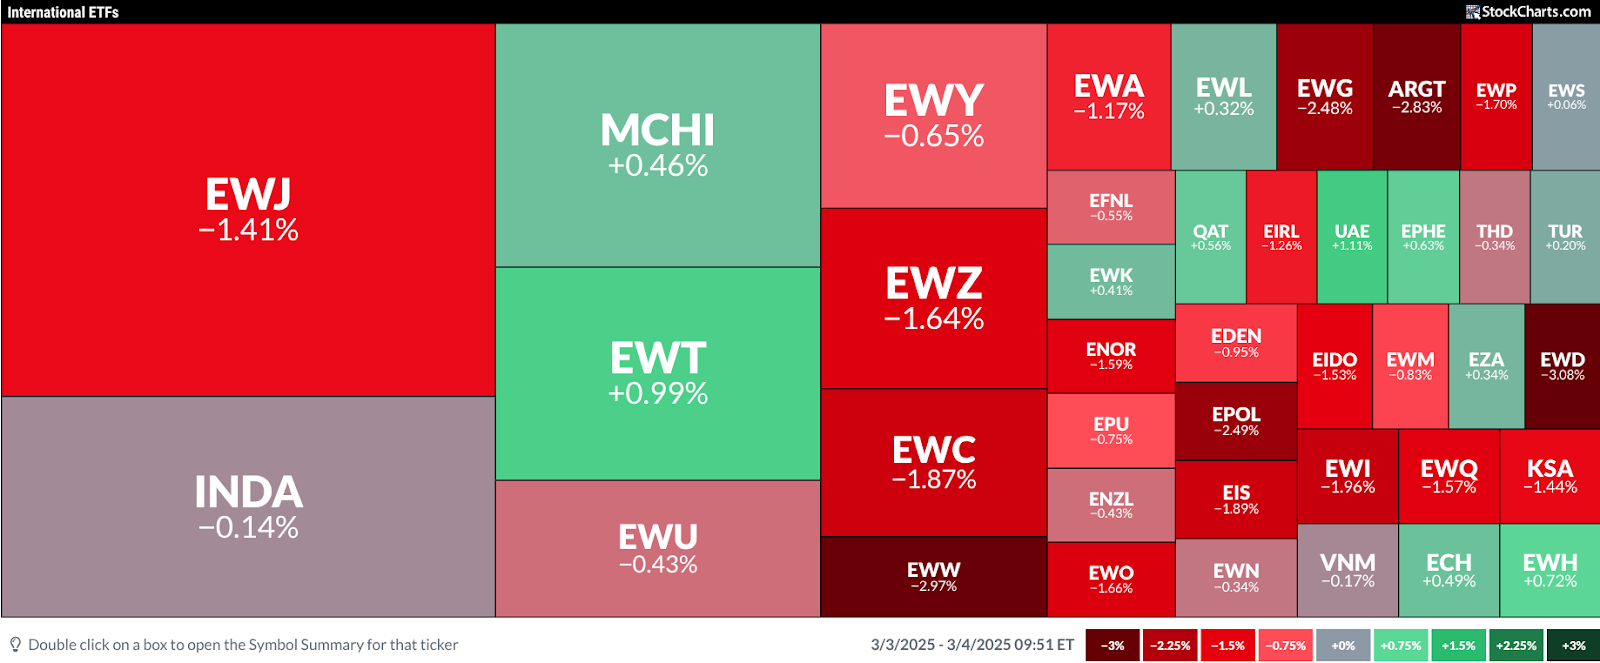
Trade War Panic: Are International Stocks the Safer Bet Now?
by Karl Montevirgen,
The StockCharts Insider
KEY TAKEAWAYS
* Tariffs on China, Canada, and Mexico are officially in effect.
* While US stocks have declined in response, might there be investing opportunities in international markets?
With US tariffs on Canada, Mexico, and China having taken effect at midnight on Tuesday, US indexes extended their Monday losses, deepening concerns...
READ MORE
MEMBERS ONLY

S&P 500 Selloff: Bearish Rotation & Key Downside Targets!
by David Keller,
President and Chief Strategist, Sierra Alpha Research
In this video, Dave analyzes market conditions, bearish divergences, and leadership rotation in recent weeks. He examines the S&P 500 daily chart, highlighting how this week's selloff may confirm a bearish rotation and set downside price targets using moving averages and Fibonacci retracements. To validate a...
READ MORE
MEMBERS ONLY

Bitcoin Faces Important Technical Test
by Martin Pring,
President, Pring Research
Over the weekend, Donald Trump declared the creation of a U.S. strategic crypto reserve, which will include Bitcoin and four other cryptocurrencies. The price immediately responded with a substantial rally over the weekend, but, by the close of business on Monday, had given up all of those gains. That...
READ MORE
MEMBERS ONLY

DP Trading Room: Bitcoin Surges!
by Erin Swenlin,
Vice President, DecisionPoint.com
The news is that the United States will have a Cryptocurrency reserve. How this will occur is still murky, but Bitcoin surged on the news. Carl and Erin give you their opinion on Bitcoin's chart setup and possible future movement.
Carl opens the trading room with a review...
READ MORE
MEMBERS ONLY
The Best Five Sectors, #9
by Julius de Kempenaer,
Senior Technical Analyst, StockCharts.com
KEY TAKEAWAYS
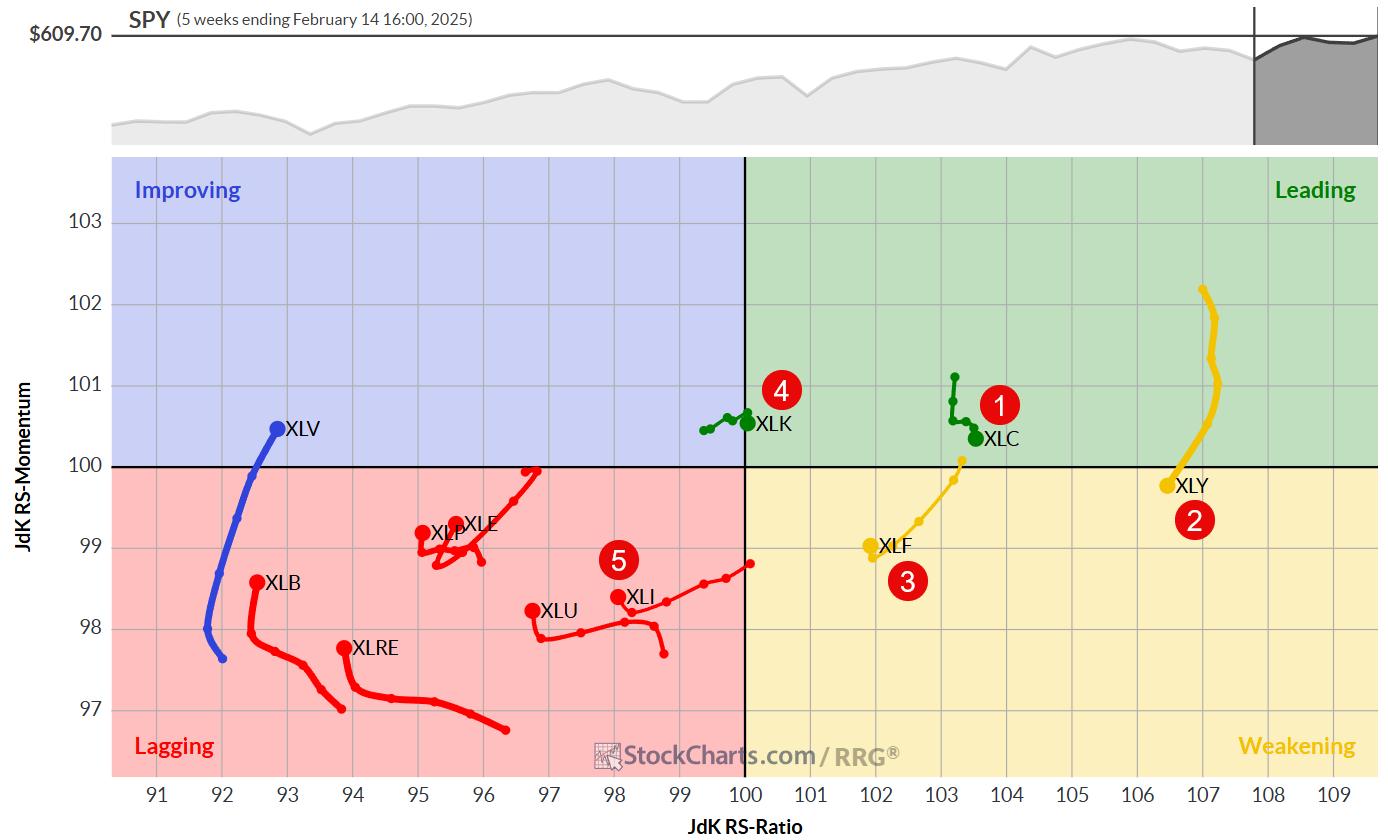
* Communication services maintains top spot in sector ranking.
* Financials moves up to #2, pushing consumer discretionary down to #3.
* Technology and utilities hold steady at #4 and #5 respectively.
* Portfolio performance now on par with benchmark after recent outperformance.
Sector Rotation: Financials Climb as Consumer Discretionary Slips
While...
READ MORE
MEMBERS ONLY

New Indicator for Your Toolbox
by Erin Swenlin,
Vice President, DecisionPoint.com
As part of our regular market review in the DP Alert, we have begun to notice a very good indicator to determine market weakness and strength. It may not be new to all of you, but we've found as of late that this indicator tells a story.
We...
READ MORE
MEMBERS ONLY

Sector Rotation & Seasonality: What's Driving the Market Now?"
by Julius de Kempenaer,
Senior Technical Analyst, StockCharts.com
In this exclusive StockCharts video,Julius analyzes seasonality for U.S. sectors and aligns it with current sector rotation. He explores how these trends impact the market (SPY) and shares insights on potential movements using RRG analysis. By combining seasonality with sector rotation, he provides a deeper look at market...
READ MORE
MEMBERS ONLY
Hidden MACD SIGNAL? Key Trade Signals Explained!
by Joe Rabil,
President, Rabil Stock Research
In this exclusive StockCharts video, Joe breaks down reverse divergences (hidden divergence), key upside & downside signals, and how to use ADX and Moving Averages for better trades! Plus, he examines market trends and viewer symbol requests!
This video was originally published on February 26, 2025. Click this link to...
READ MORE
MEMBERS ONLY
Bearish Signals & Risk Management: Protect Your Portfolio!
by David Keller,
President and Chief Strategist, Sierra Alpha Research
In this video, Dave breaks down bearish macro signals and risk management using the "line in the sand" technique! Learn how to spot key support levels, set alerts on StockCharts, and protect your portfolio!
This video originally premiered on February 26, 2025. Watch on StockCharts' dedicated David...
READ MORE
MEMBERS ONLY

Decode the Stock Market's Health With This Key Indicator
by Jayanthi Gopalakrishnan,
Director of Site Content, StockCharts.com
KEY TAKEAWAYS
* Investors are worried about a weakening economy and other headwinds.
* Looking under the hood can reveal the strength or weakness of the overall stock market.
* Investors are rotating out of technology stocks and into more defensive sectors.
The US Consumer Confidence Index® came in much lower than expectations,...
READ MORE
MEMBERS ONLY
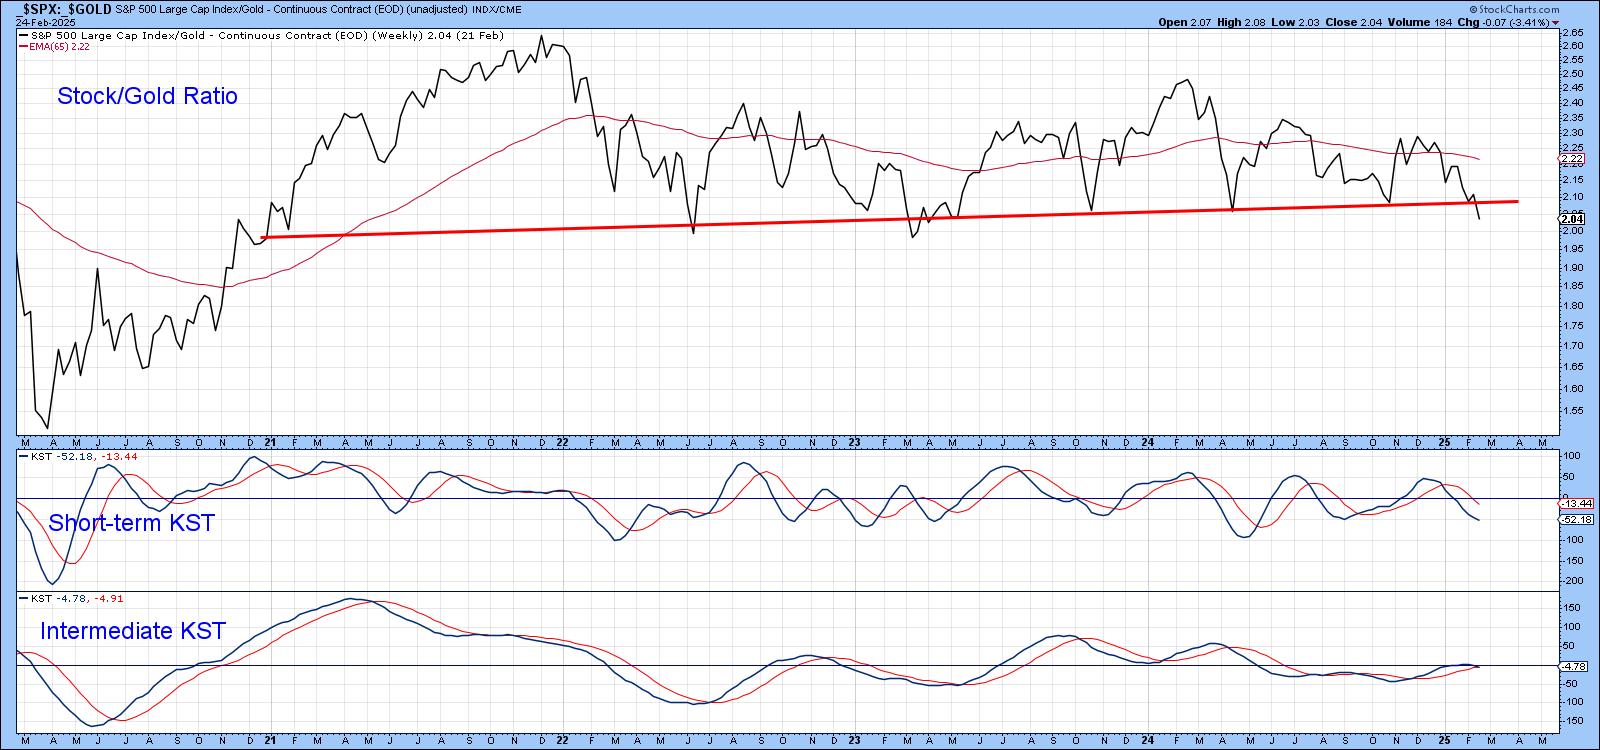
Stocks Starting to Break Down Against This Key Asset
by Martin Pring,
President, Pring Research
The S&P Composite ($SPX) briefly touched a new all-time high last week, which sounds encouraging. However, that kind of action was limited, as neither the Dow Industrials nor the NASDAQ Composite reached record territory. Such discrepancies can always be cleared up, of course, but more troubling is the...
READ MORE
MEMBERS ONLY

DP Trading Room: Defensive Sectors Lead the Pack
by Erin Swenlin,
Vice President, DecisionPoint.com
The complexion of the market is changing. Aggressive sectors which have led the market higher are now beginning to show signs of strain as momentum slowly dissipates and prices turn lower. However, defensive sectors (XLP, XLRE, XLV and XLU) are now leading the market. Typically when this occurs the market...
READ MORE
MEMBERS ONLY
The Best Five Sectors, #8
by Julius de Kempenaer,
Senior Technical Analyst, StockCharts.com
KEY TAKEAWAYS
* Utilities entering the top-5
* Industrials dropping out of top-5 portfolio
* Real-Estate and Energy swapping positions in bottom half of the ranking
* Perfomance now 0.3% below SPY since inception.
Utilities enter top 5
Last week's trading, especially the sell-off on Friday, has caused the Utilities sector...
READ MORE
MEMBERS ONLY

Market Rotation and Cap-Weight Dynamics: A Closer Look
by Julius de Kempenaer,
Senior Technical Analyst, StockCharts.com
KEY TAKEAWAYS
* Large cap growth stocks regaining favor as market faces pressure
* Cap-weighted sectors outperforming equal-weighted counterparts
* S&P 500 struggling to break above 610, suggesting potential trading range
* Exceptions in mega-cap dominated sectors (Communication Services, Technology, Consumer Discretionary)
With the market selling off into the close today, it&...
READ MORE
MEMBERS ONLY

Mega-Caps Weakening, More Trouble Ahead
by Erin Swenlin,
Vice President, DecisionPoint.com
The market declined heavily on Friday likely setting up for more downside ahead. We had already begun to notice that mega-cap stocks were beginning to weaken. You can see this on the relative strength line of the SPY versus equal-weight RSP. The relative strength line has been in decline. You&...
READ MORE
MEMBERS ONLY

Unleash the Power of BPI: The Key to Boosting Your Investment Returns
by Jayanthi Gopalakrishnan,
Director of Site Content, StockCharts.com
KEY TAKEAWAYS
* Market breadth is improving in some stock market sectors.
* Monitoring the Bullish Percent Index (BPI) can help you strategize your investments.
* The broader stock market indexes are still bullish.
On Wednesday, the Federal Reserve released minutes from its January 28–29 meeting. There weren't any surprises...
READ MORE
MEMBERS ONLY

Three Signs of the Bear and What May Come Next!
by David Keller,
President and Chief Strategist, Sierra Alpha Research
KEY TAKEAWAYS
* Bearish momentum divergences suggest potential exhaustion of the bulls and limited upside.
* Market breadth indicators have not confirmed recent highs, reflecting a lack of support outside the leading performers.
* Dow Theory non-confirmation, a pattern first identified by Charles Dow, shows that market indexes are not confirming one another....
READ MORE
MEMBERS ONLY
The Best Five Sectors, #7
by Julius de Kempenaer,
Senior Technical Analyst, StockCharts.com
KEY TAKEAWAYS
* Communication services (XLC) claims the top spot, pushing consumer discretionary (XLY) to second place
* Technology (XLK) shows strength, moving up to fourth and displacing industrials (XLI)
* Industrials displaying weakness, at risk of dropping out of the top five
* RRG portfolio outperforming SPY benchmark by 69 basis points
Shifting...
READ MORE
MEMBERS ONLY
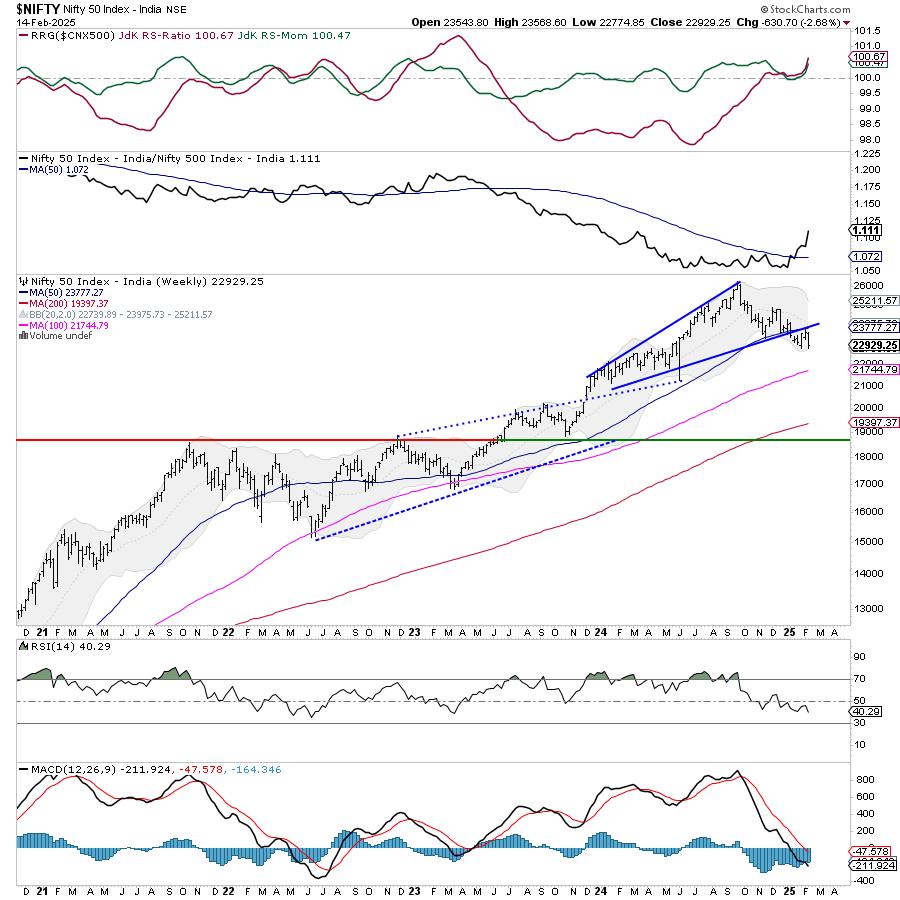
Week Ahead: NIFTY Tests Crucial Support; Violation Of This Level May Invite Incremental Weakness

by Milan Vaishnav,
Founder and Technical Analyst, EquityResearch.asia and ChartWizard.ae
The Indian equity markets remained under pressure over the past five sessions, witnessing sustained weakness throughout the week. The Nifty50 faced resistance at key levels and struggled to find strong footing as it tested crucial support zones on two separate occasions. Market volatility surged significantly, with India VIX rising by...
READ MORE
MEMBERS ONLY

Stay Ahead of Tariffs: Essential Chart Analysis for Investment Security
by Jayanthi Gopalakrishnan,
Director of Site Content, StockCharts.com
KEY TAKEAWAYS
* The stock market has been trading sideways for an extended period.
* Tariffs, deregulation, inflation, and tax cuts are likely to occupy investors' minds for the next few years.
* Monitor the charts of the broader stock market, inflation expectations, and industries that are likely to benefit from the...
READ MORE
MEMBERS ONLY
Master Multiple Timeframe Analysis With This Simple Method
by David Keller,
President and Chief Strategist, Sierra Alpha Research
KEY TAKEAWAYS
* We can use the slope of moving averages, as well as a simple crossover technique, to define trends and identify trend changes.
* Our Market Trend Model uses exponential moving averages, as they are more sensitive to changes in market direction.
* Based on our Market Trend Model, the S&...
READ MORE
MEMBERS ONLY

Stash that Flash Right in the Trash

by Arthur Hill,
Chief Technical Strategist, TrendInvestorPro.com
KEY TAKEAWAYS
* Price represents a distillation of all news, events and rumors.
* Our job is to set biases aside and focus on price action.
* Chartists should focus on uptrends, relative strength and bullish setups.
The news cycle is in high gear lately, leading to some extra volatility. Traders reacting to...
READ MORE
MEMBERS ONLY

Bearish Divergences Plaguing Former Leadership Names
by David Keller,
President and Chief Strategist, Sierra Alpha Research
KEY TAKEAWAYS
* META and NFLX remain in strong uptrend phases, with limited drawdowns in 2025.
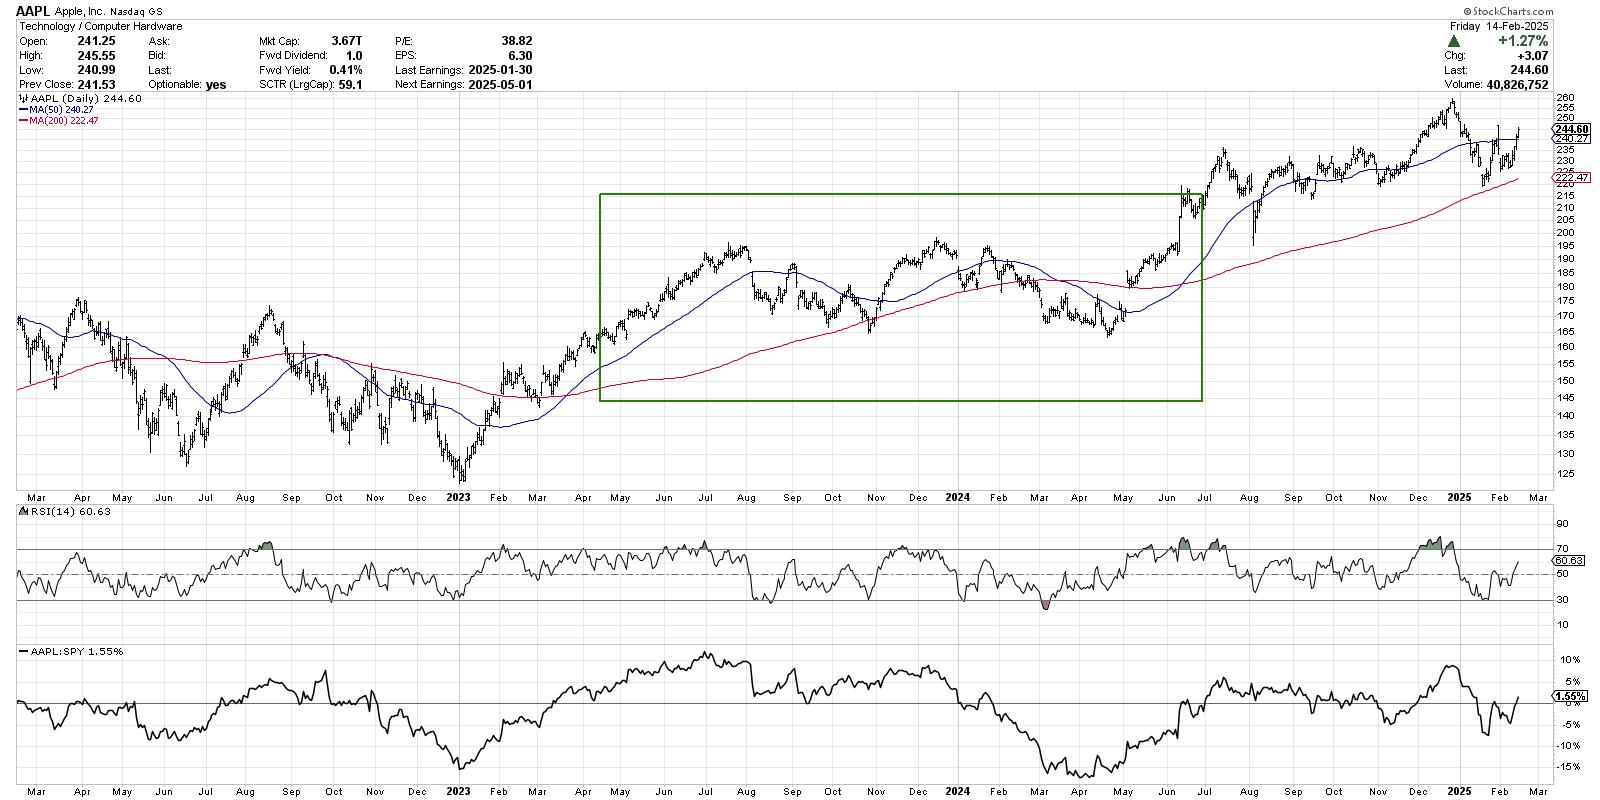
* Four of the Mag7 names can be classified as "broken charts", with recent breakdowns representing an important change of character.
* AMZN and GOOGL offer perhaps the most concerning short-term patterns, with bearish momentum...
READ MORE
MEMBERS ONLY

Are the Once High-Flying MAG 7 Stocks Just Mediocre Now?
by David Keller,
President and Chief Strategist, Sierra Alpha Research
In this video, Dave breaks down the formerly high-flying Mag 7 stocks into three distinct buckets. These include long & strong (META, NFLX & AMZN), broken down (TSLA, AAPL, MSFT & NVDA), and questionable (GOOGL). He also shows how GOOGL is not the only leading name featuring a bearish momentum...
READ MORE
MEMBERS ONLY
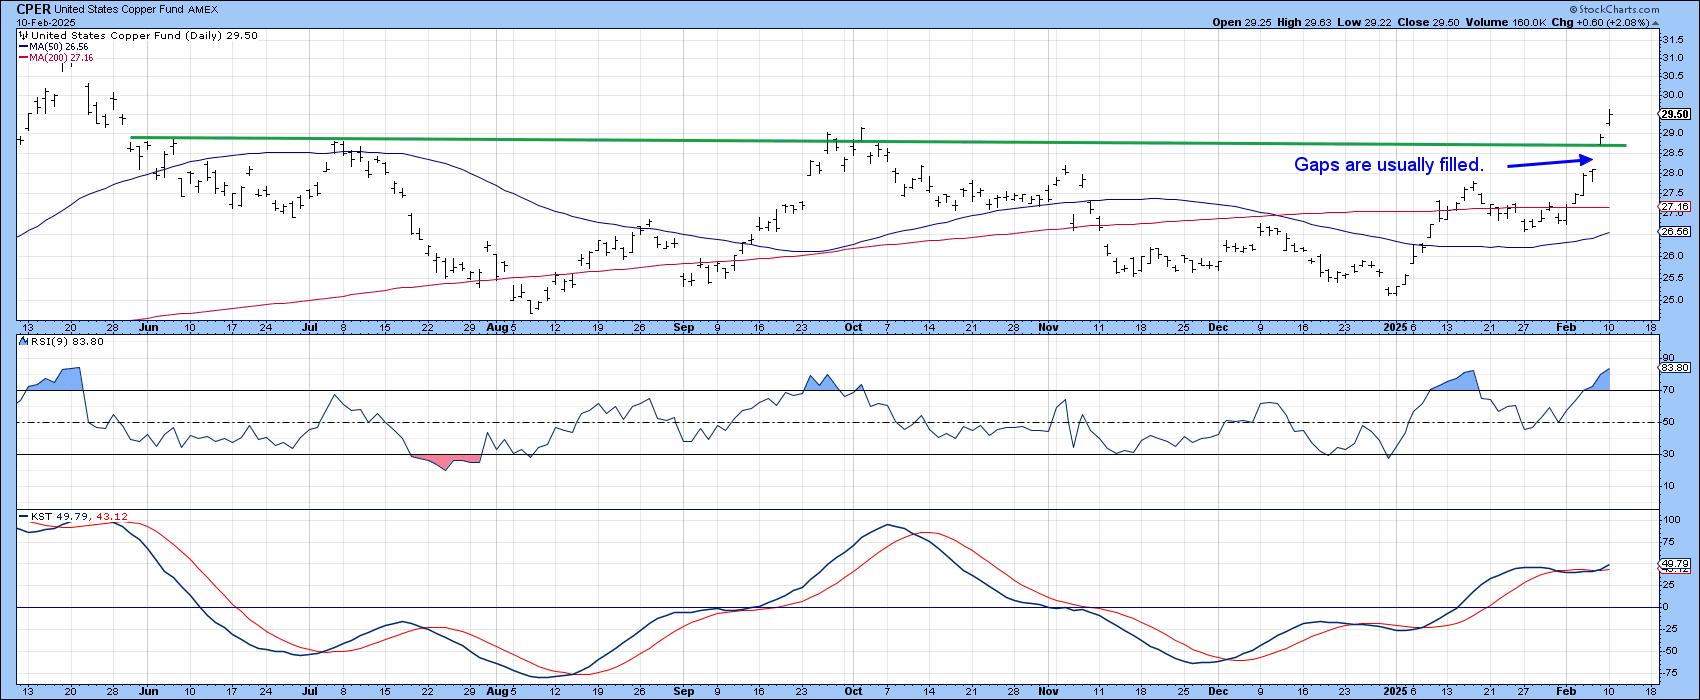
Dr Copper Could Be Close to a Major Breakout. What That Could Mean for the CPI
by Martin Pring,
President, Pring Research
The nickname "Dr. Copper" comes from its reputation as a reliable economic indicator. That's because it is used worldwide in a wide range of industries, including construction, electronics, and manufacturing. When demand for the red metal is high, it often signals that these industries are booming,...
READ MORE
MEMBERS ONLY

DP Trading Room: Gold Hits Another All-Time High
by Erin Swenlin,
Vice President, DecisionPoint.com
The market rebounded to start trading on Monday, but indicators on Friday suggest internal weakness. Carl gives us his latest analysis on the market as well as taking a look at Gold which is making more all-time highs. Get Carl's perspective on the Gold rally.
Besides looking at...
READ MORE
MEMBERS ONLY
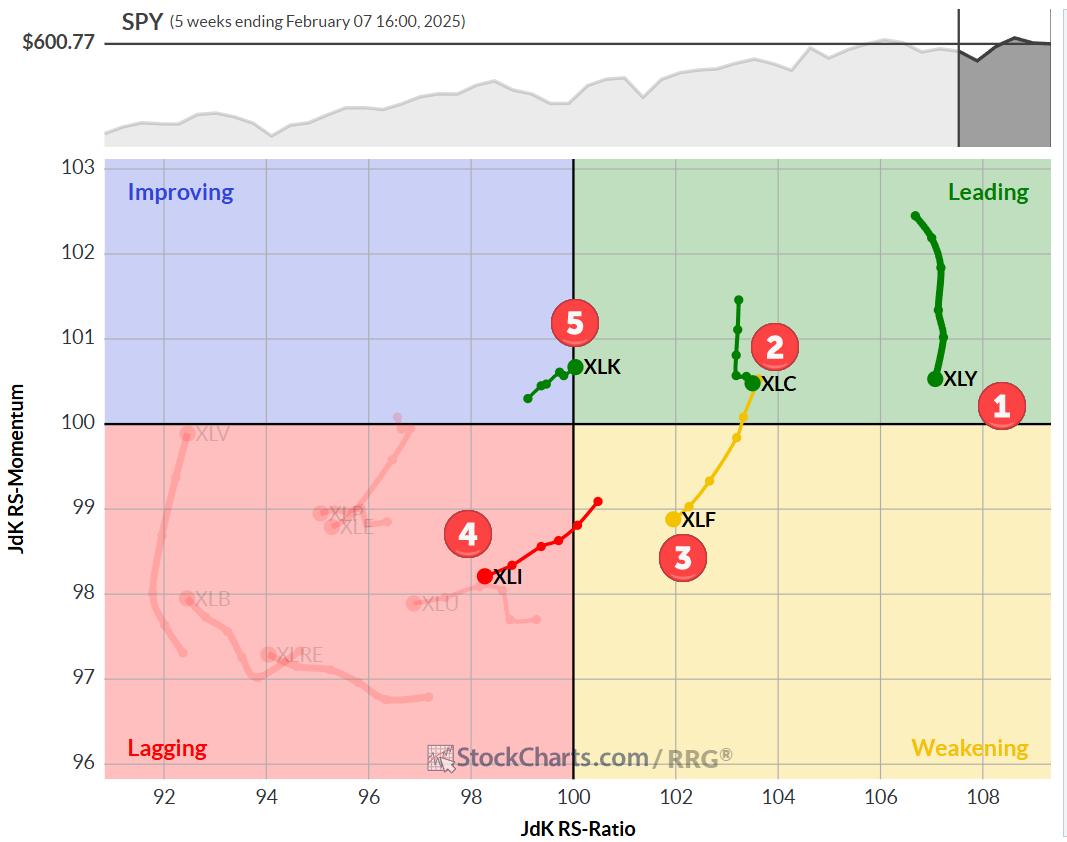
The Best Five Sectors, #6
by Julius de Kempenaer,
Senior Technical Analyst, StockCharts.com
KEY TAKEAWAYS
* Top-5 remains unchanged
* Healthcare and Staples jump to higher positions
* Price and Relative trends remain strong for XLC and XLF
No Changes In Top-5
At the end of the week ending 2/7, there were no changes in the top-5, but there have been some significant shifts in...
READ MORE
MEMBERS ONLY
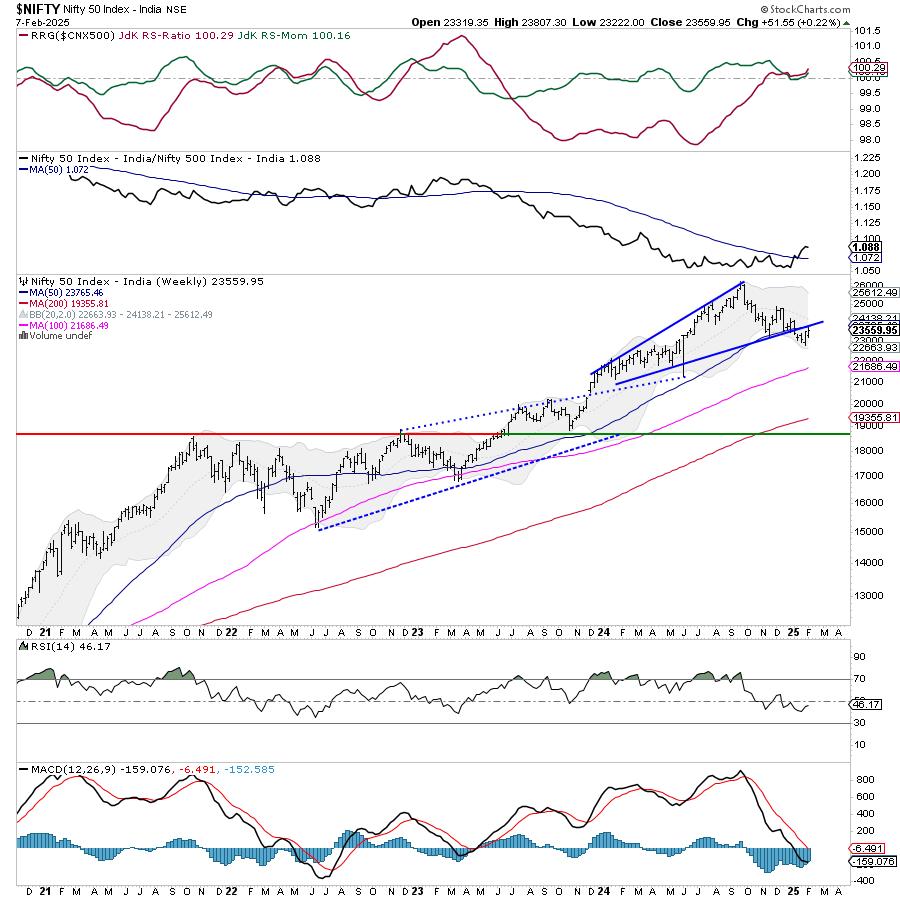
Week Ahead: NIFTY Stares at Crucial Support; RRG Hints at Defensive & Risk-Off Setups
by Milan Vaishnav,
Founder and Technical Analyst, EquityResearch.asia and ChartWizard.ae
In what can be called an indecisive week for the markets, the Nifty oscillated back and forth within a given range and ended the week on a flat note. Over the past five sessions, the Nifty largely remained within a defined range. While it continued resisting the crucial levels, it...
READ MORE
MEMBERS ONLY
Nasdaq DROPS on Weak AMZN, TSLA & GOOGL Earnings!

by Mary Ellen McGonagle,
President, MEM Investment Research
In this video, Mary Ellen reviews the market's flat momentum as uncertainty reemerges after weak AMZN, TSLA and GOOGL reports - PLUS more tariff talk from Trump. She also highlights the move into defensive sectors as growth stocks continue to struggle. Lastly, she shares the top stocks that...
READ MORE