MEMBERS ONLY

S&P 500 Above 5400: Economic Optimism or Irrational Exuberance?

by David Keller,
President and Chief Strategist, Sierra Alpha Research
In this edition of StockCharts TV'sThe Final Bar, Dave recaps the continued optimism for technology shares following this morning's bullish CPI data and the Fed's statements suggesting a Goldilocks scenario for risk assets. He also breaks down key technical signals and levels for AAPL,...
READ MORE
MEMBERS ONLY

5 Simple and Powerful Uses for Moving Averages

by Joe Rabil,
President, Rabil Stock Research
On this week's edition of Stock Talk with Joe Rabil, Joe shows the five ways to use the Moving Average lines to help with decision making. He discusses how these lines can help to define trend reversals and confirmed trends, when to be on the alert for a...
READ MORE
MEMBERS ONLY

Sector Rotation Model Flashes WARNING Signals

by Julius de Kempenaer,
Senior Technical Analyst, StockCharts.com
In this video from StockCharts TV,Julius examines the theoretical sector rotation model and aligns it with current state of sector rotation on Relative Rotation Graphs, and the phase of the economy. He makes some interesting observations and highlights some flashing warning signals.
Check out Julius' Macroeconomic Variables/Metrics...
READ MORE
MEMBERS ONLY

Apple Blasts Through $200 On AI Optimism
by David Keller,
President and Chief Strategist, Sierra Alpha Research
In this edition of StockCharts TV'sThe Final Bar, Dave reviews key charts from a technical analysis perspective, including AAPL, FSLR, MSTR, and STT. He also addresses the potential bearish momentum divergence for the S&P 500 index and reviews the negative breadth conditions, with new 52-week lows...
READ MORE
MEMBERS ONLY

The Next Direction for Interest Rates Is...?

by Martin Pring,
President, Pring Research
In most cycles, central banks around the world raise and lower short-term interest rates in a rough synchronization. Last week, the European and Canadian central banks began lowering their rates, and the British are expected to follow suit this week. Most observers of the US expect the Federal Reserve to...
READ MORE
MEMBERS ONLY

NVDA Stock Split Launches S&P 500 Higher
by David Keller,
President and Chief Strategist, Sierra Alpha Research
In this edition of StockCharts TV'sThe Final Bar, Dave recaps a bullish day for stocks, with 8 out of 11 S&P 500 sectors finishing higher. He breaks down the charts of NVDA, ENPH, FSLR, and AMD, and reviews a potential upside reversal in gold.
See Dave&...
READ MORE
MEMBERS ONLY

DP Trading Room: Equal-Weight Losing Against Cap-Weight SPY

by Erin Swenlin,
Vice President, DecisionPoint.com
Did you know that the equally-weighted RSP is seriously underperforming the cap-weighted SPY? It is losing considerable ground against the SPY and that suggests that if mega-caps fail, so will go the market. Carl shows us charts to prove his point.
Next up Carl covers the market in general followed...
READ MORE
MEMBERS ONLY

Week Ahead: Despite Pullback, Breadth Remains a Concern; Nifty Still Prone to Retracement

by Milan Vaishnav,
Founder and Technical Analyst, EquityResearch.asia and ChartWizard.ae
The markets had an incredibly eventful week as they reacted to the exit polls and general election results. All happened in the same week; the Nifty saw itself forming a fresh lifetime high, and also came off close to 8% from its peak. A remarkable recovery also followed, which led...
READ MORE
MEMBERS ONLY

Tracking the Three Signs of the Bear
by David Keller,
President and Chief Strategist, Sierra Alpha Research
There is no denying that the primary trend for the S&P 500 remains bullish as we push to the end of Q2 2024. But what about the conditions "under the hood" of the major benchmarks? Today, we'll highlight three "signs of the bear&...
READ MORE
MEMBERS ONLY

META, AMZN and MSFT On The Move! Here's How to Pinpoint Entry

by Mary Ellen McGonagle,
President, MEM Investment Research
In this StockCharts TV video, Mary Ellen reviews what drove the markets to new highs. She highlights S&P 500 sectors, plus stocks that have reversed their downtrends, pointing out good entry points. Mary Ellen also takes a close look at why stocks did not respond to today'...
READ MORE
MEMBERS ONLY

S&P 500 Still Bullish: This Is What You Should Watch For

by Jayanthi Gopalakrishnan,
Director of Site Content, StockCharts.com
KEY TAKEAWAYS
* Stock market unfazed by today's jobs data
* Yields rise, US dollar rises, and equities close the week relatively flat
* Market breadth continues to be strong, indicating the stock market is still chugging along
It was a bit of a seesaw week in the stock market, but,...
READ MORE
MEMBERS ONLY

Only One Pocket of Strength Left in US Stock Market
by Julius de Kempenaer,
Senior Technical Analyst, StockCharts.com
KEY TAKEAWAYS
* Only Large-Cap Growth is on a positive RRG-Heading
* No segment, except LC Growth, has managed to take out its late March high
* $DJUSGL setting up for negative divergences
Breaking Down Into Growth / Value
Using Relative Rotation Graphs to help break down the US stock market into various segments...
READ MORE
MEMBERS ONLY

Technology Sector Participation Is Fading

by Carl Swenlin,
President and Founder, DecisionPoint.com
The Technology Sector (XLK) continues to dominate and drive the rally, but fewer and fewer stocks within the sector are participating in the rally. We know this because our Silver Cross Index (SCI), which shows the percent of stocks in the Technology Sector with Silver Cross BUY Signals (20-day EMA...
READ MORE
MEMBERS ONLY
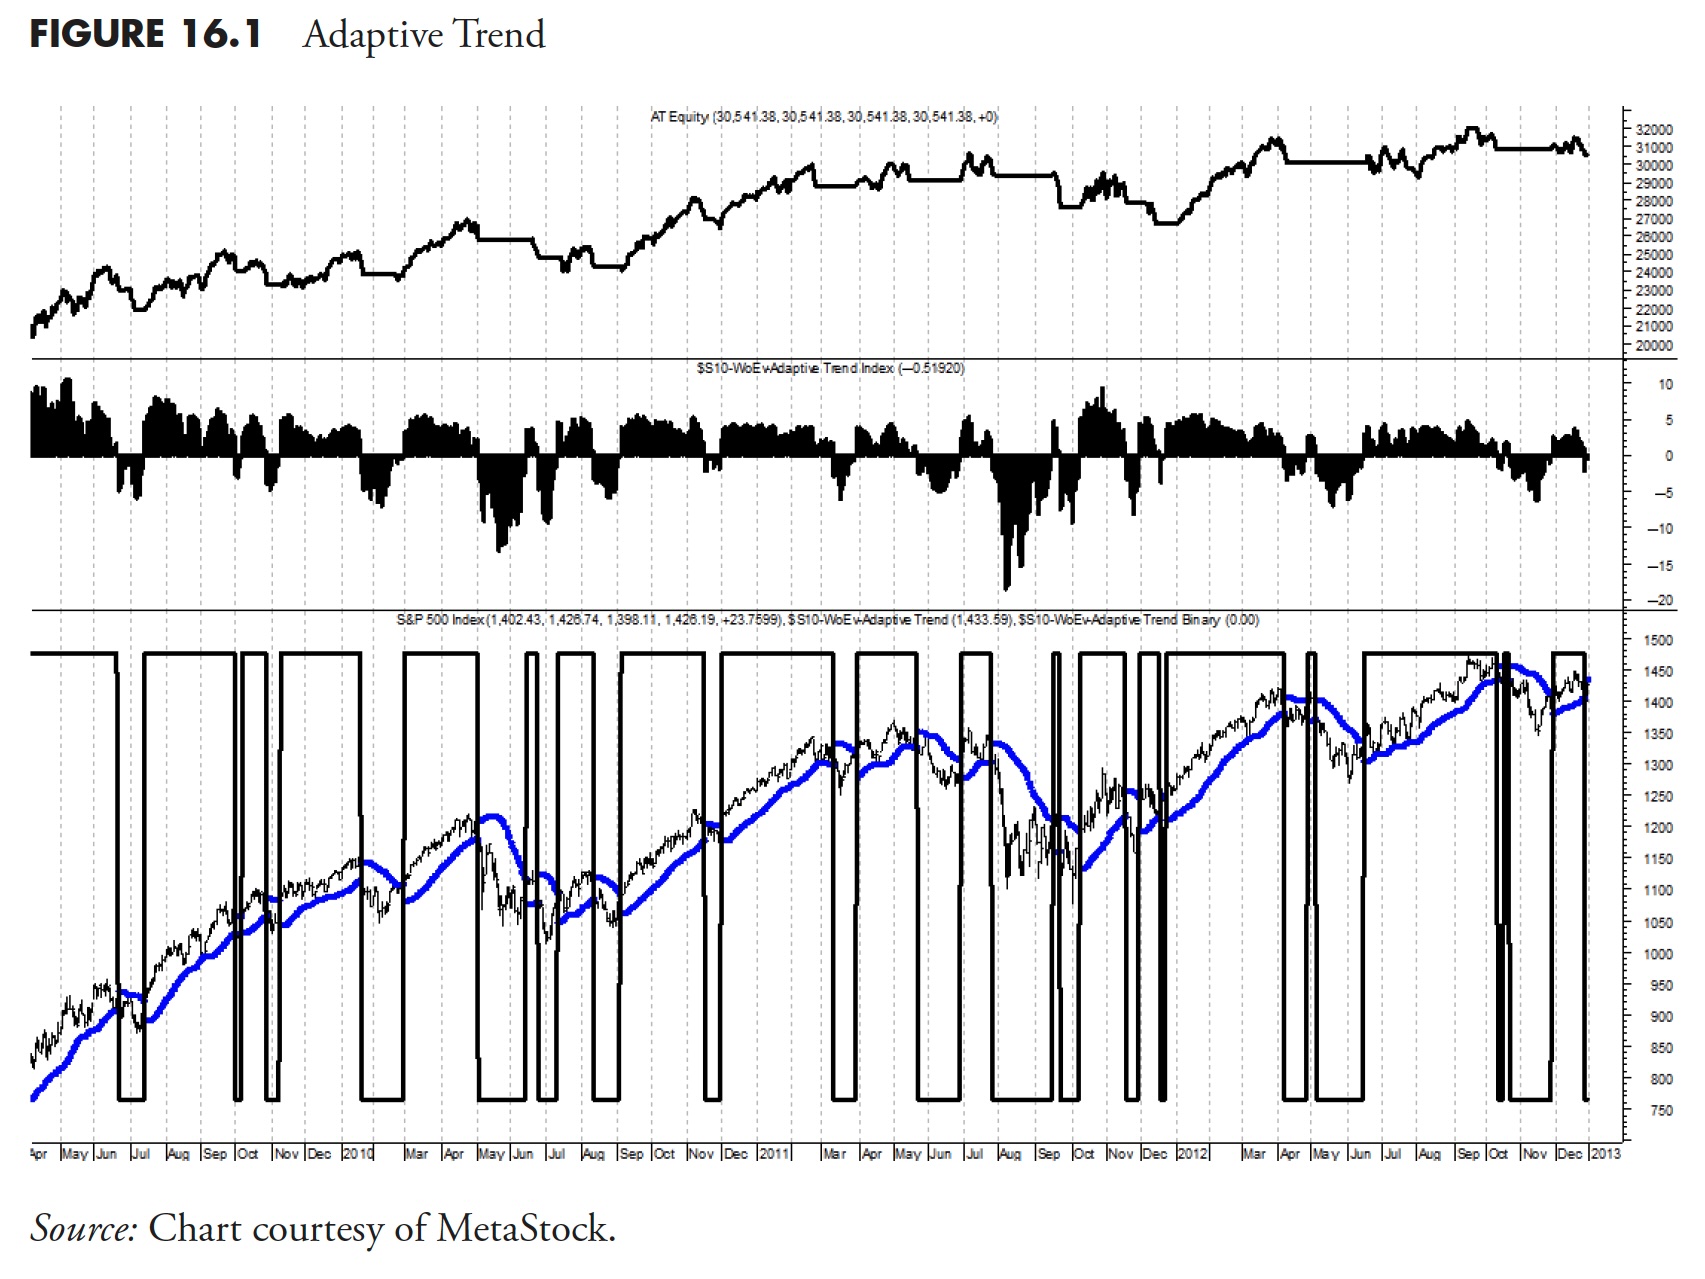
Rules-Based Money Management - Part 8: Putting Trend-Following to Work

by Greg Morris,
Veteran Technical Analyst, Investor, and Author
Note to the reader: This is the twenty-fourth in a series of articles I'm publishing here taken from my book, "Investing with the Trend." Hopefully, you will find this content useful. Market myths are generally perpetuated by repetition, misleading symbolic connections, and the complete ignorance of...
READ MORE
MEMBERS ONLY

3 Keys to Finding the Strongest Trends
by Joe Rabil,
President, Rabil Stock Research
On this week's edition of Stock Talk with Joe Rabil, Joe shows the three keys he hunts for when identifying reversals and strong trends, giving a few examples and then showing one that is developing now. He then highlights similar techniques he uses while reviewing the Sectors. In...
READ MORE
MEMBERS ONLY

These SURPRISING Sectors are Showing Strength
by Julius de Kempenaer,
Senior Technical Analyst, StockCharts.com
In this video from StockCharts TV,Julius uses the S&P 500 Sector Indexes to assess the long term price trends on the completed monthly charts for May, then discusses the long-term relative trends on a monthly RRG. Julius highlights the continued relative strength for Technology, Communication Services and...
READ MORE
MEMBERS ONLY

It's Time to Take a Look at the Canadian and Australian Dollars and What They Imply for Inflation
by Martin Pring,
President, Pring Research
The Canadian and Aussie dollars have been confined between two converging trendlines since the beginning of the century, as we can see from Chart 1. The moment of truth appears to be close at hand, as both are approaching the apex of a giant potential symmetrical triangle.
One usually consistent...
READ MORE
MEMBERS ONLY

Wyckoff at Work in the Intraday Timeframe

by Bruce Fraser,
Industry-leading "Wyckoffian"
It is well known that stock market indexes are fractal. Demonstrating repeatable price structures in all timeframes. In the intraday timeframe these price structures repeat frequently. The Wyckoff characteristics of Accumulation, Markup, Distribution and Markdown are constantly at work in smaller periods of time. Wyckoff students will study such structures...
READ MORE
MEMBERS ONLY

DP Trading Room: Upside Initiation Climax (Should We Trust It?)
by Erin Swenlin,
Vice President, DecisionPoint.com
On today's DecisionPoint Trading Room episode Carl and Erin discuss Friday's "Upside Initiation Climax" and whether it can be trusted. With market follow through tepid, they discuss the implications of this very bullish signal.
Carl reveals his sentiment of the overall market and covers...
READ MORE
MEMBERS ONLY

Week Ahead: Markets' Reaction to Exit Poll and General Election Results
by Milan Vaishnav,
Founder and Technical Analyst, EquityResearch.asia and ChartWizard.ae
The Indian equities experienced a notably eventful previous week, marked by a fresh lifetime high and a subsequent decline of over 400 points within the same week. Over the past five sessions, the Nifty 50 index fluctuated within a 693.80-point range before closing with a net weekly loss of...
READ MORE
MEMBERS ONLY

Hindenburg Omen Flashes Initial Sell Signal
by David Keller,
President and Chief Strategist, Sierra Alpha Research
While the S&P 500 did manage to finish the week above tactical support at 5250, one of the most widely-followed macro technical indicators recently registered an initial sell signal for the second time in 2024. Today we'll explain the three components of the Hindenburg Omen, show...
READ MORE
MEMBERS ONLY

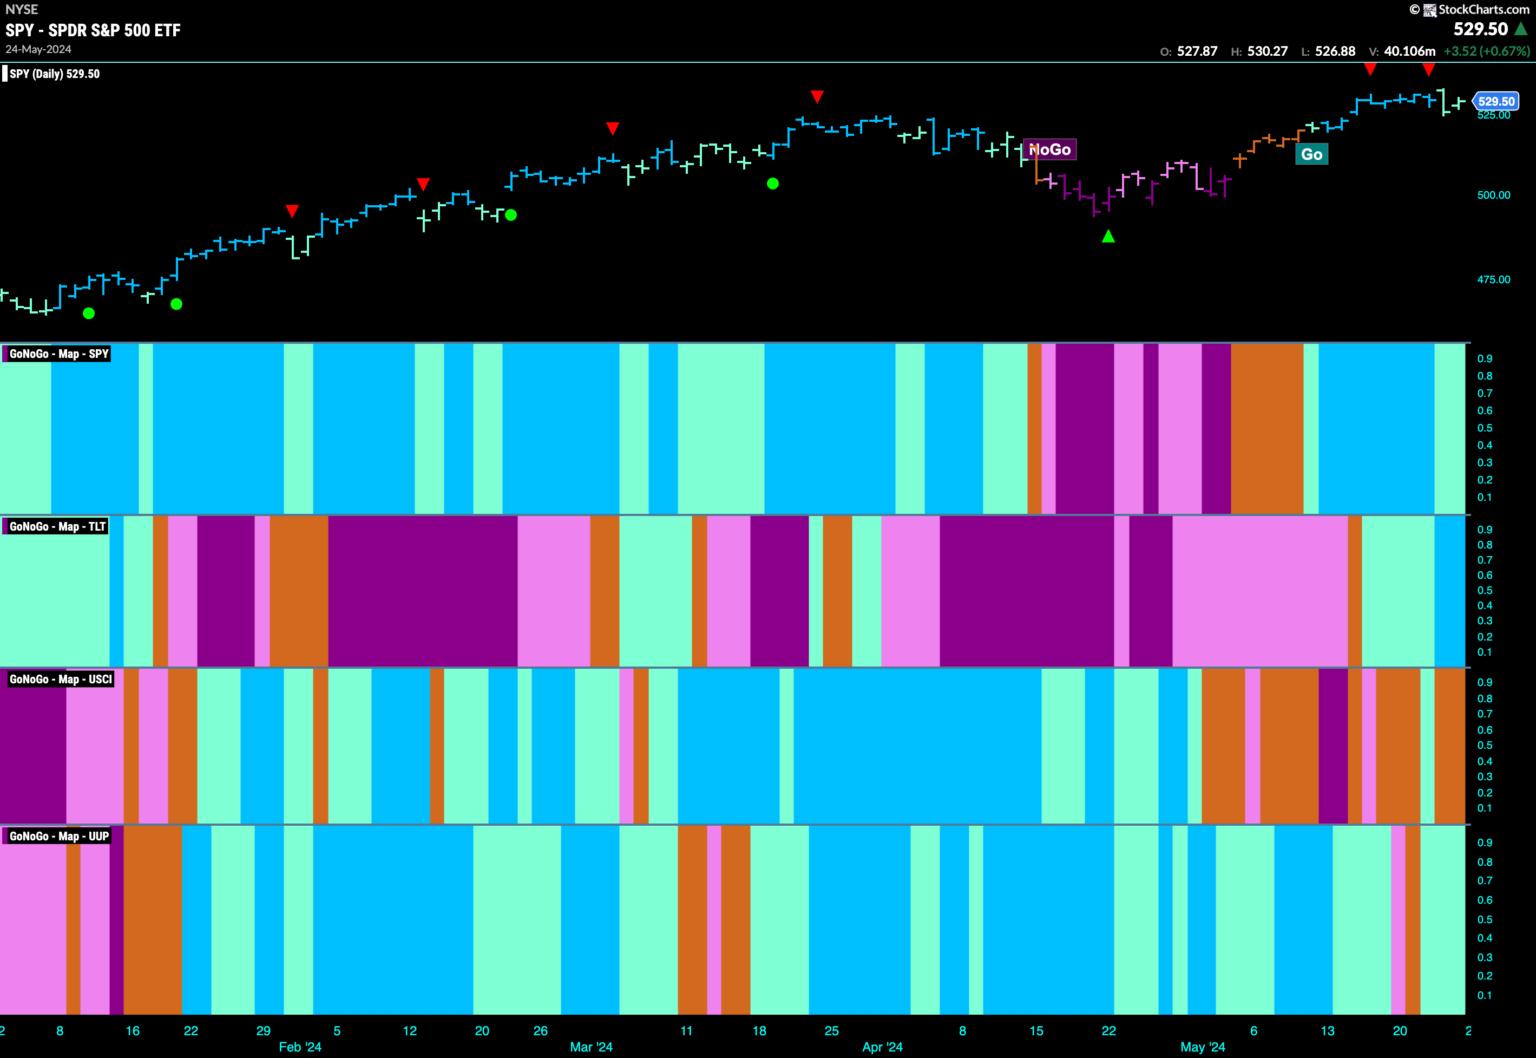
Top 5 Stocks in "Go" Trends | Fri May 31, 2024

by Tyler Wood,
Co-founder, GoNoGo Charts®
KEY TAKEAWAYS
* Trend Continuation
* Breakouts
* Momentum Confirmation
* Bull Flags
Top 5 Stocks in "Go" Trends
Trend Continuation on Rising Momentum
GoNoGo Charts® highlight low-risk opportunities for trend participation with intuitive icons directly in the price action. The resurgence of momentum in the direction of the underlying price trend...
READ MORE
MEMBERS ONLY

Tech Stocks Sell Off, But AI Shines!
by Mary Ellen McGonagle,
President, MEM Investment Research
In this episode of StockCharts TV'sThe MEM Edge, Mary Ellen reviews the bullish close in the markets while highlighting areas to stay away from. She also shares why AI-related areas of Tech remain positive and what drove the Retail sector into a new uptrend. The potential downtrend reversal...
READ MORE
MEMBERS ONLY

Stock Market Shows Its Magic: An Exciting Finish
by Jayanthi Gopalakrishnan,
Director of Site Content, StockCharts.com
KEY TAKEAWAYS
* The stock market has wrapped the week on a positive note
* Consumer Staples stocks may start to show strength in the near future
* More macro data is on deck for next week
What a turnaround! Today's PCE data, which was in line with expectations, initially sent...
READ MORE
MEMBERS ONLY

MUST SEE! Top 10 Stock Picks For June 2024
by David Keller,
President and Chief Strategist, Sierra Alpha Research

by Grayson Roze,
Chief Strategist, StockCharts.com
In this edition of StockCharts TV'sThe Final Bar, join Dave and Grayson as they run through top 10 charts to watch in June 2024! They'll cover breakout strategies, moving average techniques, relative strength, and much more. You don't want to miss these insights into...
READ MORE
MEMBERS ONLY

The Sky is Not Falling | Focus on Stocks: June 2024

by Larry Williams,
Veteran Investor and Author
A note to the Cassandras who are now out in full force...
Led by "Rich Dad, Poor Dad" Robert Kiyosaki's warning of "Be careful, it's the biggest crash in world history," the bears have come out of their winter caves. "We...
READ MORE
MEMBERS ONLY

S&P 500 Sinks on Software and Semiconductor SELLOFF
by David Keller,
President and Chief Strategist, Sierra Alpha Research
In this edition of StockCharts TV'sThe Final Bar, Dave welcomes Jonathan Krinsky, CMT of BTIG. Jonathan speaks to the weakness in market breadth conditions and the software group as a key space to watch for relative strength weakness. David breaks down the relationship between the S&P...
READ MORE
MEMBERS ONLY

Failed Bearish Patterns are Bullish for S&P 500!
by David Keller,
President and Chief Strategist, Sierra Alpha Research
In this edition of StockCharts TV'sThe Final Bar, Dave welcomes Frank Cappelleri, CMT CFA of CappThesis. Frank shares how the bull market phase has been marked by confirmed and completed bullish patterns and failed breakdowns after bearish patterns. Meanwhile, Dave discusses the rising interest rate environment, what it...
READ MORE
MEMBERS ONLY

This MUST SEE MACD Pattern is a Game Changer
by Joe Rabil,
President, Rabil Stock Research
On this week's edition of Stock Talk with Joe Rabil, Joe shows a specific MACD pattern that, when it develops on the monthly chart, can give a great early warning sign. Joe gives several examples of this pattern during the lesson. He also shows two Scans that he...
READ MORE
MEMBERS ONLY
Market Analysis: Top Stock Picks and Sector Insights
by Milan Vaishnav,
Founder and Technical Analyst, EquityResearch.asia and ChartWizard.ae
As we approach the highly anticipated results of India's general elections on Tuesday, June 4, market volatility is expected to be at its peak. Exit polls, scheduled for Saturday, June 1, will likely add to the market's uncertainty, causing significant fluctuations in the Nifty and BankNifty...
READ MORE
MEMBERS ONLY

Three Stock Ideas as S&P 500 Treads Water
by David Keller,
President and Chief Strategist, Sierra Alpha Research
In this edition of StockCharts TV'sThe Final Bar, Dave welcomes Tony Zhang of OptionsPlay. Tony shares three stock ideas showing favorable risk/reward characteristics as the S&P 500 index treads water above support at 5250. David describes the deteriorating market breadth conditions and reviews charts of...
READ MORE
MEMBERS ONLY
What Happens to GOOGL When This Negative Divergence Executes
by Julius de Kempenaer,
Senior Technical Analyst, StockCharts.com
In this video from StockCharts TV,Julius takes a look at the differences in rotation between cap-weighted and equal-weighted sectors and sees a warning signal for GOOGL. He also examines the Communications Sector vs. the Equal-Weighted ETF.
This video was originally broadcast on May 28, 2024. Click anywhere on the...
READ MORE
MEMBERS ONLY
EQUITIES REMAIN IN "GO" TREND WITH SPARSE LEADERSHIP FROM TECH AND UTILITIES

by Alex Cole,
Co-founder, GoNoGo Charts®
by Tyler Wood,
Co-founder, GoNoGo Charts®
KEY TAKEAWAYS
* Relative Strength
* Market Trend
* Narrow Breadth
Good morning and welcome to this week's Flight Path. We saw some weakness this week as price pulled back a little from all time highs. Momentum cooled, we saw this in the form of Go Countertrend Correction Icons (red arrows)...
READ MORE
MEMBERS ONLY

Week Ahead: NIFTY Set to Move Within This Volatile Range; Curtailing Leveraged Exposures is Recommended
by Milan Vaishnav,
Founder and Technical Analyst, EquityResearch.asia and ChartWizard.ae
It was a truncated day for the markets; over the past four trading sessions, the Indian equities continued to edge higher and ended on a fresh lifetime high. The volatility, too, remained at elevated levels. As mentioned in the previous technical note, the markets are building up ahead of the...
READ MORE
MEMBERS ONLY

MEM TV: How to Trade Nvidia After Its 15% Gain
by Mary Ellen McGonagle,
President, MEM Investment Research
In this episode of StockCharts TV'sThe MEM Edge, Mary Ellen reviews the broader markets and the rotation that's taking place amid a rise in interest rates. She also takes a close look at NVDA and shares how you should handle the stock after last week'...
READ MORE
MEMBERS ONLY

Technical Indicator Showdown: MACD vs. PPO vs. PMO
by David Keller,
President and Chief Strategist, Sierra Alpha Research
In this edition of StockCharts TV'sThe Final Bar, Dave answers viewer questions from The Final Bar Mailbag. He outlines the differences between the MACD, PPO, and PMO indicators, covers the mechanics of corporate buybacks, examines the basics of candlestick analysis, and discusses whether applying trendline analysis to the...
READ MORE
MEMBERS ONLY

Stock Market Ends Week on Optimistic Note, With a Few Surprises
by Jayanthi Gopalakrishnan,
Director of Site Content, StockCharts.com
KEY TAKEAWAYS
* The stock market started out slow, sold off, and then recovered some of those losses to end the week on an optimistic note.
* Market internals continue to be strong indicating that the stock market has a bullish bias.
* Several stocks made new highs including NVDA, FSLR, and DELL....
READ MORE
MEMBERS ONLY

Surge in TSLA and Strong AMZN Not Enough
by Julius de Kempenaer,
Senior Technical Analyst, StockCharts.com
KEY TAKEAWAYS
* Defensive sector rotation remains a concern.
* AMZN & TSLA are both strong, but XLY remains in relative downtrend.
* Large Cap Growth is the only segment on a strong RRG-Heading.
Concerns Remain
My concerns about current market developments, which I voiced in last week's article, are still...
READ MORE
MEMBERS ONLY

Dow Theory Flashes Bear Signal
by David Keller,
President and Chief Strategist, Sierra Alpha Research
Dow Theory is based on the foundational work of Charles Dow, considered the "Father of Technical Analysis." Many of the tools we employ to better analyze market structure and investor sentiment, from trend analysis to index construction, are derived from Dow's original essays from the early...
READ MORE
MEMBERS ONLY

What Does Today's Outside Bars in the S&P and NASDAQ Mean Going Forward
by Martin Pring,
President, Pring Research
A couple of weeks ago, I wrote an upbeat article on the US stock market opining that the correction was over. I still think that's the case, but I do have to note that a bearish outside bar formed on both the S&P and NASDAQ on...
READ MORE