MEMBERS ONLY
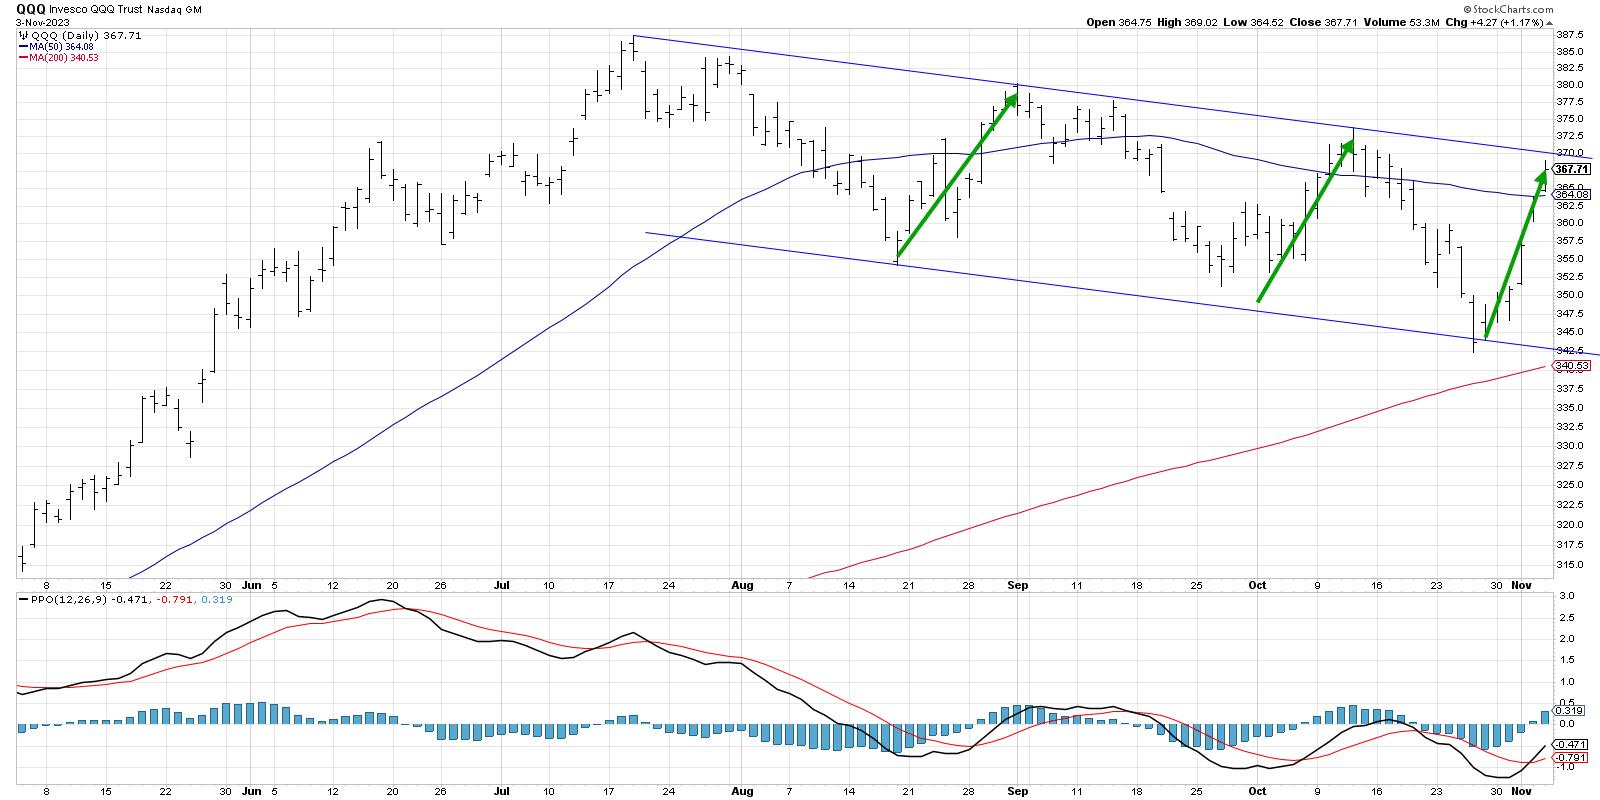
Trading the QQQ in Three Timeframes

by David Keller,
President and Chief Strategist, Sierra Alpha Research
KEY TAKEAWAYS
* The short-term trend for the QQQ is positive after this week's rally, but price is now at the upper edge of a downtrend channel.
* On the medium-term timeframe, the downtrend channel is still intact, and the momentum reading is still in line with a bearish phase....
READ MORE
MEMBERS ONLY
Top Ten Charts to Watch in November 2023
by David Keller,
President and Chief Strategist, Sierra Alpha Research

by Grayson Roze,
Chief Strategist, StockCharts.com
In this edition of StockCharts TV'sThe Final Bar, join Dave and Grayson as they break down the trends for the top ten stocks and ETF charts for November 2023. Watch as they identify key levels and signals to keep an eye out for using the power of StockCharts&...
READ MORE
MEMBERS ONLY
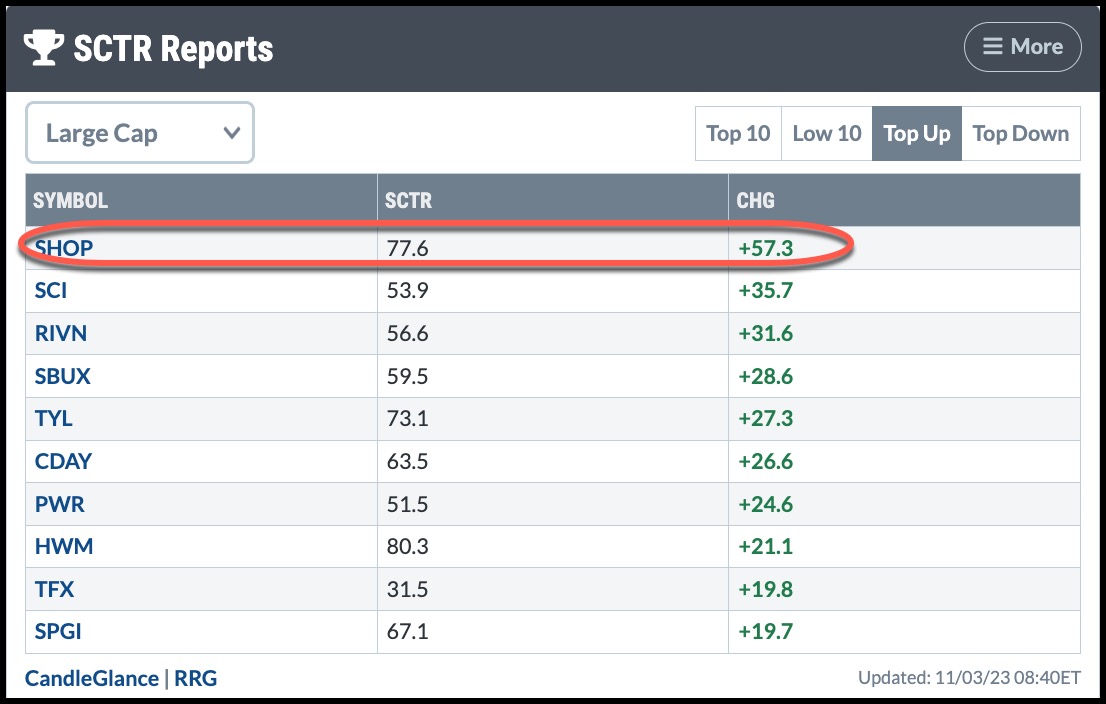
Shopify Stock Shatters Expectations: What You Need to Know About Its Rise

by Karl Montevirgen,
The StockCharts Insider
KEY TAKEAWAYS
* Shopify saw a significant surge of over 20% following a robust earnings report and guidance
* The daily price chart shows a breakaway gap from a prevailing near-term downtrend
* Breakaway gaps don't often fill, so if you are considering entering a position the stock has room to...
READ MORE
MEMBERS ONLY

Holiday Shopping Bonanza: Retail Stocks You Need to Watch
by Karl Montevirgen,
The StockCharts Insider
KEY TAKEAWAYS
* Since holiday shopping season is here it could be a good time to add some retail stocks to your portfolio
* AMZN, WMT, COST, and TGT could be potential stocks to add to your portfolio as holiday shopping begins
* Set alerts for these stocks so you can enter at...
READ MORE
MEMBERS ONLY

Focus on Stocks: November 2023

by Larry Williams,
Veteran Investor and Author
The Million Dollar Stock Market Bet
Warren Buffett proved his point in 2016 when he bet $1,000,000 that the S&P 500 Stock Index would outperform hedge funds. His bet was that active investment management by professionals would under-perform the returns of people who were passively investing....
READ MORE
MEMBERS ONLY

29 MUST SEE Charts You Can Start Using Today!
by Grayson Roze,
Chief Strategist, StockCharts.com
On this week's edition of StockCharts TV'sStockCharts in Focus, Grayson gives viewers 29 of the most important charts straight out of his own personal account. He'll review his weekly "Market Evaluation" ChartList and discuss all of the advanced charts within. This entire...
READ MORE
MEMBERS ONLY
Stock Market Indexes Shatter Critical Support Levels. Watch the March Lows.

by Jayanthi Gopalakrishnan,
Director of Site Content, StockCharts.com
KEY TAKEAWAYS
* The Dow, S&P 500, and Nasdaq Composite are trading below their 200-day moving averages
* US Treasury yields are taking a breather now but their near-term action could impact equities, especially big tech stocks
* Investors are anxiously awaiting to hear if Fed Chairman Jerome Powell will lean...
READ MORE
MEMBERS ONLY

This Powerful MACD/ADX Screener Generates Valuable Ideas

by Joe Rabil,
President, Rabil Stock Research
On this week's edition of Stock Talk with Joe Rabil, Joe shows an intraday trade setup in the SPY that took place this week. He uses the MACD and ADX in multiple timeframes to explain in detail how they can help with our entry and timing. He discusses...
READ MORE
MEMBERS ONLY

Many Reasons to Love and Hate AMZN Stock
by Karl Montevirgen,
The StockCharts Insider
KEY TAKEAWAYS
* Amazon stock has been falling ahead of earnings and is close to hitting the support of its 200-day moving average
* When AMZN announce its Q3 earnings, investors will be interested in the company's e-commerce and cloud services
* Keep an eye on AMZN's price action...
READ MORE
MEMBERS ONLY

Google Stock Expectations In the Spotlight: Will Earnings Results Exceed Expectations?
by Jayanthi Gopalakrishnan,
Director of Site Content, StockCharts.com
KEY TAKEAWAYS
* Google's Q3 earnings will have an impact on which way the stock moves
* GOOGL's daily stock chart shows the stock is trading very close to its 52-week high
* GOOGL stock is trading above its 21-day exponential moving average, it has a high SCTR rank,...
READ MORE
MEMBERS ONLY

Week Ahead: NIFTY May Have Limited Upsides In The Truncated Monthly Expiry Week; Watch These Key Levels

by Milan Vaishnav,
Founder and Technical Analyst, EquityResearch.asia and ChartWizard.ae
The markets wore a largely corrective undertone throughout the past five sessions; it oscillated within a similar range as the previous week and closed on a negative note. The volatility remained on the lower side; as the volatility has been low, the bands contracted as well. As compared to the...
READ MORE
MEMBERS ONLY

Larry's "Family Gathering" October 20, 2023 Recording
by Larry Williams,
Veteran Investor and Author
October is a significant month in the stock market, and in this pre-election year, there's a lot of uncertainty among investors, which makes the stock market more volatile. In this video, Larry discusses the October Seasonality and talks about stocks that generally perform well during the month. You&...
READ MORE
MEMBERS ONLY

RRG is Sending a Clear Message And Finds Two Stocks With Good Upside Potential

by Julius de Kempenaer,
Senior Technical Analyst, StockCharts.com
KEY TAKEAWAYS
* RRG is sending a strong message to prefer Growth over Value
* Putting the growth stocks from IVW through a scan and some thorough RRG analyses finds a handful of interesting names
* Two unexpected stocks are showing up as having good upside potential
* Especially growth stocks from Defensive sectors...
READ MORE
MEMBERS ONLY

These 3 Stocks Keep Hitting New Highs and Can Still Surge: This Is the Time To Look for an Entry
by Jayanthi Gopalakrishnan,
Director of Site Content, StockCharts.com
KEY TAKEAWAYS
* Scanning for stocks that are reaching all-time highs while the broader market is trending lower can result in ideal trading opportunities
* Look for stocks that are trending higher over the longer-term and pulling back
* FANG, PGR, and MUSA are showing signs of pullback and should be on your...
READ MORE
MEMBERS ONLY

Larry's LIVE "Family Gathering" Webinar Airs THIS WEEK - Friday, October 20th at 2:00pm EDT!
by Larry Williams,
Veteran Investor and Author
Larry is going LIVE! Don't miss the upcoming "Family Gathering" webinar with Larry Williams, airing live through Zoom this Friday, October 20th at 2:00pm EDT.
In this must-see event, Larry will be presenting his current opinions on a broad variety of current market topics, directly...
READ MORE
MEMBERS ONLY

Week Ahead: NIFTY Consolidates While Defending Key Levels; Vigilant Protection of Profits Advised
by Milan Vaishnav,
Founder and Technical Analyst, EquityResearch.asia and ChartWizard.ae
In the previous technical note, it was mentioned that the volatility gauge INDIAVIX had stayed at its lowest levels, and this setup was keeping the markets vulnerable to profit-taking bouts from the current levels.
Over the past five days, the markets showed some signs of profit-taking, but at the same...
READ MORE
MEMBERS ONLY
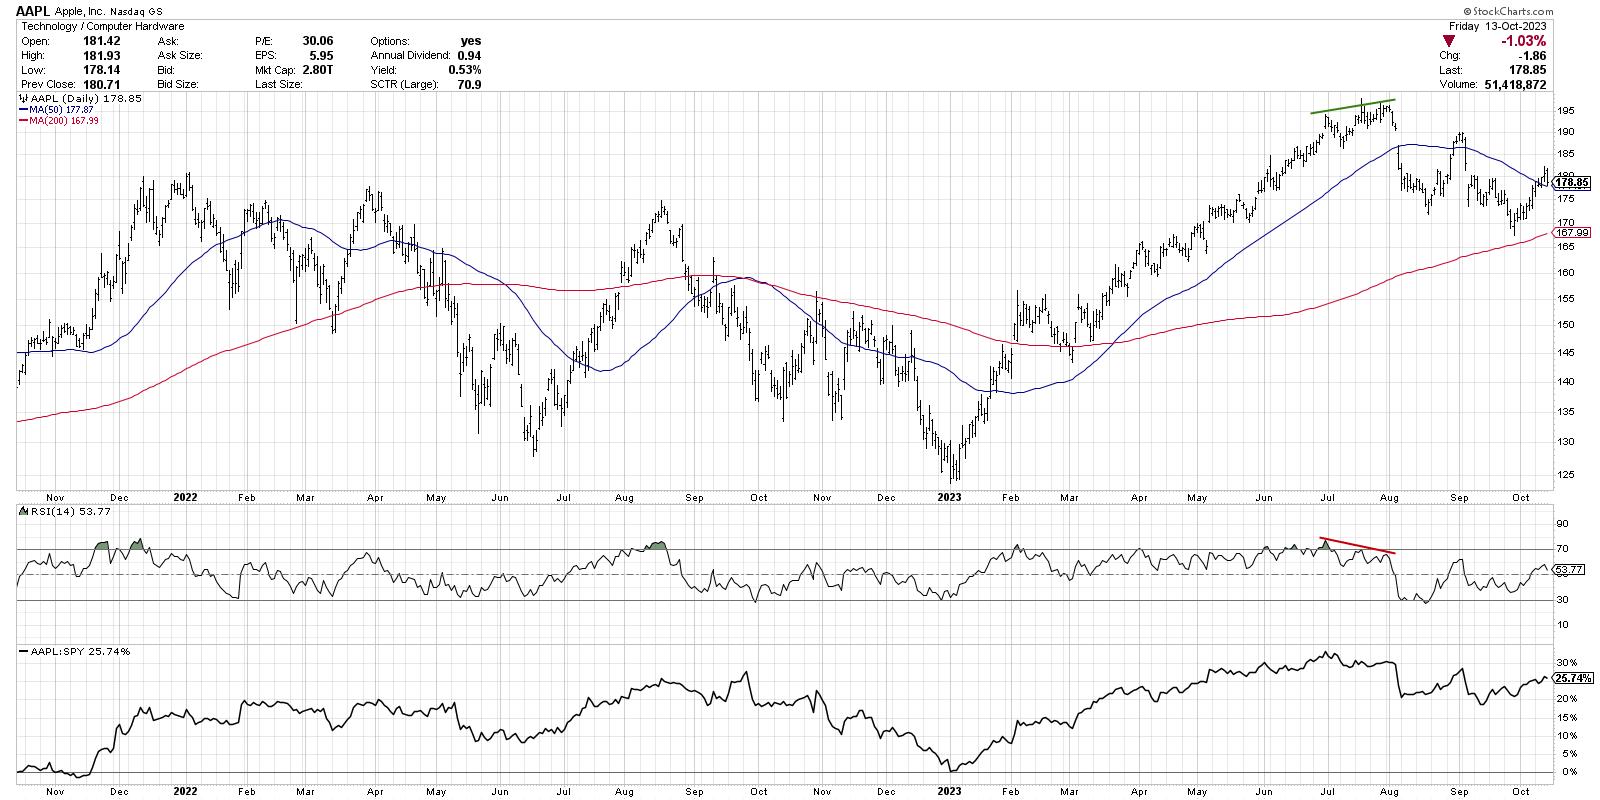
Lagging Indicators Confirm Bearish Phase For Growth
by David Keller,
President and Chief Strategist, Sierra Alpha Research
KEY TAKEAWAYS
* Leading indicators help anticipate price reversals, while lagging indicators validate trend changes you've already observed.
* RSI combines the qualities of leading and lagging indicators, helping investors to prepare for and react to trend reversals.
* AAPL recently showed a bullish momentum divergence, meaning the leading indicator has...
READ MORE
MEMBERS ONLY
Gain GREATER CLARITY on The Market's Latest Moves With Seasonality Charts!
by Grayson Roze,
Chief Strategist, StockCharts.com
On this week's edition of StockCharts TV'sStockCharts in Focus, Grayson explores the Seasonality tool and shares how these unique charts can help you gain a deeper, more data-driven perspective on the market's latest moves. By charting historical price moves for each month of the...
READ MORE
MEMBERS ONLY
2 Clear Strategies When Using the ADX
by Joe Rabil,
President, Rabil Stock Research
On this week's edition of Stock Talk with Joe Rabil, Joe discusses keys to using the ADX indicator. He focuses on the 2 clear strategies for ADX and how to handle them. In addition, he describes the slope of this line and how that affects the strategy. Joe...
READ MORE
MEMBERS ONLY
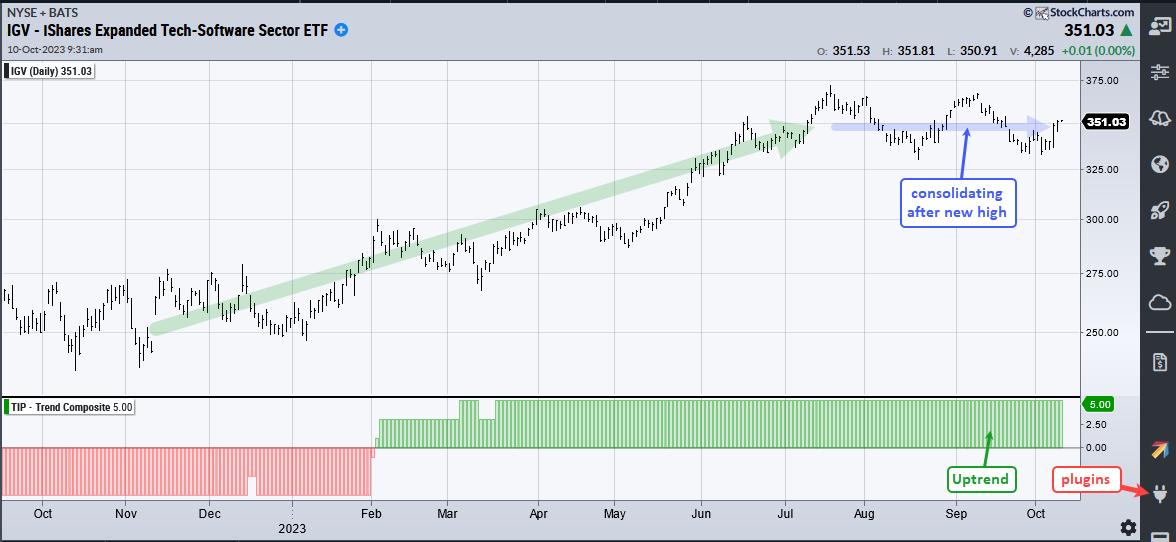
Trading the Swing within the Pattern: IGV Example

by Arthur Hill,
Chief Technical Strategist, TrendInvestorPro.com
Chartists looking to get the jump on a bigger breakout can turn to the swings within a developing pattern. For example, a Symmetrical Triangle after an advance is a bullish continuation pattern. We can get the jump on a breakout by trading a downswing reversal within the pattern. Let'...
READ MORE
MEMBERS ONLY

Week Ahead: NIFTY May Stay Vulnerable At Higher Levels; This Sectors Rolls Inside The Leading Quadrant
by Milan Vaishnav,
Founder and Technical Analyst, EquityResearch.asia and ChartWizard.ae
Despite the volatile moves during the four sessions of this week's shortened frame, we ended on a very flat note for the second time in a row. The trading range remained slightly wider compared to the previous week. Compared to the 274.55-point range in the week before,...
READ MORE
MEMBERS ONLY
Stock Market Ends Week on Positive Note; Market Internals May Be Turning Bullish
by Jayanthi Gopalakrishnan,
Director of Site Content, StockCharts.com
KEY TAKEAWAYS
* Strong September jobs report caused an initial shock but investors overcame it and the broader stock market indexes all closed higher
* Volatility remained below 20 during the trading day
* In addition to Technology and Communication Services, Financials may be showing bullish strength
September's strong labor market—...
READ MORE
MEMBERS ONLY
The Most Important Moving Average to Boost Your Investing Success
by Joe Rabil,
President, Rabil Stock Research
On this week's edition of Stock Talk with Joe Rabil, Joe discusses the importance of the 18-month MA line for investing. He shows how it can provide a bias for a stock or market for years, and how it reveals when to play counter to the trend. Joe...
READ MORE
MEMBERS ONLY

How Market Breadth Indicators Can Lead You Out of Market Bottoms
by David Keller,
President and Chief Strategist, Sierra Alpha Research
In this edition of StockCharts TV'sThe Final Bar, Dave digs out his market correction playbook and shares what market breadth indicators tend to do leading into and out of market bottoms. He also reveals the charts that can serve investors well in corrective phases, using relative strength as...
READ MORE
MEMBERS ONLY

How to Not Just Survive But PROSPER During Market Downturns

by Dave Landry,
Founder, Sentive Trading, LLC
In this week's edition of Trading Simplified, Dave shows his methodology in action by discussing his current portfolio and how he is seeing each position to its fruition. He then resumes his series on Jesse Livermore. This week, he explains how years of experience can give you intuition,...
READ MORE
MEMBERS ONLY

Here's a Scary Scenario for You: S&P 500 Downside to 2200?!?
by David Keller,
President and Chief Strategist, Sierra Alpha Research
In this edition of StockCharts TV'sThe Final Bar, guest Jeff Huge, CMT of JWH Investment Partners updates his Elliott Wave count for the S&P 500 and shares what the MOVE index can tell us about further upside potential for interest rates. Dave recaps the continued deterioration...
READ MORE
MEMBERS ONLY

Watch for These Signs of a Bottom As Market Breadth Conditions Crumble
by David Keller,
President and Chief Strategist, Sierra Alpha Research
In this edition of StockCharts TV'sThe Final Bar, Dave shows how market breadth conditions have continued to deteriorate to the point where signs of a bottom may emerge. He answers viewer questions on historical Fed cycles, under-performance of defensive sectors like utilities, and how to use technical analysis...
READ MORE
MEMBERS ONLY

Focus on Stocks: October 2023
by Larry Williams,
Veteran Investor and Author
First & Foremost
I want to personally thank you for subscribing to "Focus on Stocks". I will do all I can to earn the confidence you have placed in me. -- Larry Williams
Is it a Different World?
"I have to pay attention to the implications of...
READ MORE
MEMBERS ONLY
Your Burning Questions, Answered: FATE of TESLA & Bullish Bias Solutions!
by David Keller,
President and Chief Strategist, Sierra Alpha Research
In this edition of StockCharts TV'sThe Final Bar, Dave answers viewer questions about Tesla's potential trajectory towards the 200-day moving average and ways to normalize relative strength graphs using volatility measures. He also dives into his past trades' technical setup, shares tips for setting up...
READ MORE
MEMBERS ONLY
ChartPacks: The Quick and Easy Way to UNLEASH THE POWER of Your StockCharts Account
by Grayson Roze,
Chief Strategist, StockCharts.com
On this week's edition of StockCharts TV'sStockCharts in Focus, Grayson talks all about ChartPacks -- the QUICKEST and EASIEST way to enhance your StockCharts account (old or new) in just one click! ChartPacks are pre-created collections of ChartLists that you can install right into your account;...
READ MORE
MEMBERS ONLY

Beware of Shorts in EXTREME Cycle Lows For The Market

by TG Watkins,
Director of Stocks, Simpler Trading
The internals have all cycled to extreme low areas, which tells TG that being short would be risky -- just like being super long at the end of July was also risky. The pendulum has swung to the lows, and now, in this week's edition of Moxie Indicator...
READ MORE
MEMBERS ONLY
Is it Possible for the S&P 500 to Hold the 4300 Level?
by David Keller,
President and Chief Strategist, Sierra Alpha Research
In this edition of StockCharts TV'sThe Final Bar, Samantha LaDuc of LaDuc Capital breaks down the implications of higher interest rates and why semiconductors remain a crucial space to watch. Host David Keller, CMT tracks the recent rally in Bitcoin and identifies two key names testing moving average...
READ MORE
MEMBERS ONLY
What to Do When The MACD Is Broken
by Joe Rabil,
President, Rabil Stock Research
On this week's edition of Stock Talk with Joe Rabil, Joe explains how the creator of the MACD, Gerald Appel, used this indicator as an overbought/oversold oscillator. He shows how using the SPY on the daily chart as an example. He then explains what to do when...
READ MORE
MEMBERS ONLY
Looking at Recent Market PULLBACK in a Long-Term Context & More!
by David Keller,
President and Chief Strategist, Sierra Alpha Research
In this edition of StockCharts TV'sThe Final Bar, Joe Rabil of Rabil Stock Research walks through his monthly, weekly, and daily S&P 500 charts to put the recent market pullback into proper long-term context. Host David Keller, CMT digs into breadth indicators that have turned quite...
READ MORE
MEMBERS ONLY
Riding Out the Storm in Less-Than-Ideal Conditions
by Dave Landry,
Founder, Sentive Trading, LLC
In this week's edition of Trading Simplified, Dave shows his methodology in action by sticking with the original plan with his portfolio vs. giving up due to less-than-ideal conditions. He then resumes his series on the wisdom of Jesse Livermore.
This week, Dave discusses that there is a...
READ MORE
MEMBERS ONLY
SharpCharts vs. ACP - Comparing & Contrasting Your Charting Platform Choices
by Grayson Roze,
Chief Strategist, StockCharts.com
On this week's edition of StockCharts TV'sStockCharts in Focus, Grayson explores the two primary charting platforms on StockCharts - SharpCharts and ACP - to highlight the strengths of each, compare and contrast the two and share his thoughts on when and why you may want to...
READ MORE
MEMBERS ONLY

Nvidia Stock: Why It's Screaming a Spectacular Buy Signal
by Jayanthi Gopalakrishnan,
Director of Site Content, StockCharts.com
KEY TAKEAWAYS
* NVDA stock is holding on to the support of its 100-day moving average
* NVDA has maintained a high StockCharts Technical Rank (SCTR) since early 2023
* NVDA's relative strength with respect to the S&P 500 is approaching 200%
Nvidia's stock has maintained a...
READ MORE
MEMBERS ONLY
Market Begs: Tell Us Something Good!
We compiled a list of the 10 biggest uncertainties in the stock market right now.
In no particular order:
1. China-trade wars and chip wars
2. Oil and food inflation
3. Strikes
4. Government shutdown
5. Corporate and individual bankruptcies on the rise
6. Commercial real estate and banking
7....
READ MORE
MEMBERS ONLY

Week Ahead: NIFTY Forms A Potential Top; Low VIX Continues To Stay A Concern
by Milan Vaishnav,
Founder and Technical Analyst, EquityResearch.asia and ChartWizard.ae
In the previous technical note, it was mentioned that the markets are prone to some consolidation and corrective retracements due to the technical setup on the charts. It was also mentioned that the precariously low levels of volatility need to be watched, and this also can keep the markets vulnerable...
READ MORE
MEMBERS ONLY

GNG TV: "Go" Trends in Rates & Dollar Causing Problems for Equity

by Alex Cole,
Co-founder, GoNoGo Charts®

by Tyler Wood,
Co-founder, GoNoGo Charts®
In this edition of the GoNoGo Charts show, with rates gapping higher and breaking above resistance, Alex and Tyler walk through the macro charts that can have an impact on markets. After discussing rates, they look at the dollar, which also is in a strong "Go" trend.
This...
READ MORE
