The Best Five Sectors This Week #83
Key Takeaways
- Technology weakness led to a 1.9% portfolio decline, lagging SPY by 0.6%.
- Energy showed strong momentum, moving into the leading quadrant on the weekly RRG.
- Health Care and Financials remain stable despite losing some relative momentum.
- Materials are at risk, with the sector breaking below long-term support lines.
Technology Drags Down SPY
At the end of last week, the S&P 500 (SPY) was down 1.31% for the week. Between individual sectors, there were pretty big differences:
- Industrials: biggest loser, down 3.7%
- Materials: down over 3%
- Technology: down 3%
- Communication Services: up 1.8%
- Energy: up 1.75%
For the portfolio, this translated to a total decline of 1.9%, which was slightly worse than the S&P 500, so the portfolio lagged the index last week. This was mainly due to the heavy weighting in Technology, which contributed -1.75% to performance; Materials was slightly lower. Energy contributed 10 basis points positively, Financials contributed -10 basis points, and Health Care was down two basis points, almost unchanged.
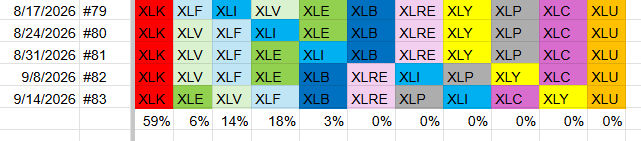
Weakness in the Technology sector drove almost all of the top five portfolio's performance, a recurring theme on both the upside and downside. These performances caused a few changes in the sector rankings, but not in the composition of the top five:
At the start of this week, the ranking of the sectors is as follows:
- (1) Technology - XLK [59%]
- (4) Energy - XLE [6%]*
- (2) Health Care - XLV [14%]
- (3) Financials - XLF [18%]*
- (5) Materials - XLB [3%]
- (6) Real Estate - XLRE
- (8) Consumer Staples - XLP*
- (7) Industrials - XLI*
- (10) Communication Services - XLC*
- (9) Consumer Discretionary - XLY*
- (11) Utilities - XLU
Weekly RRG
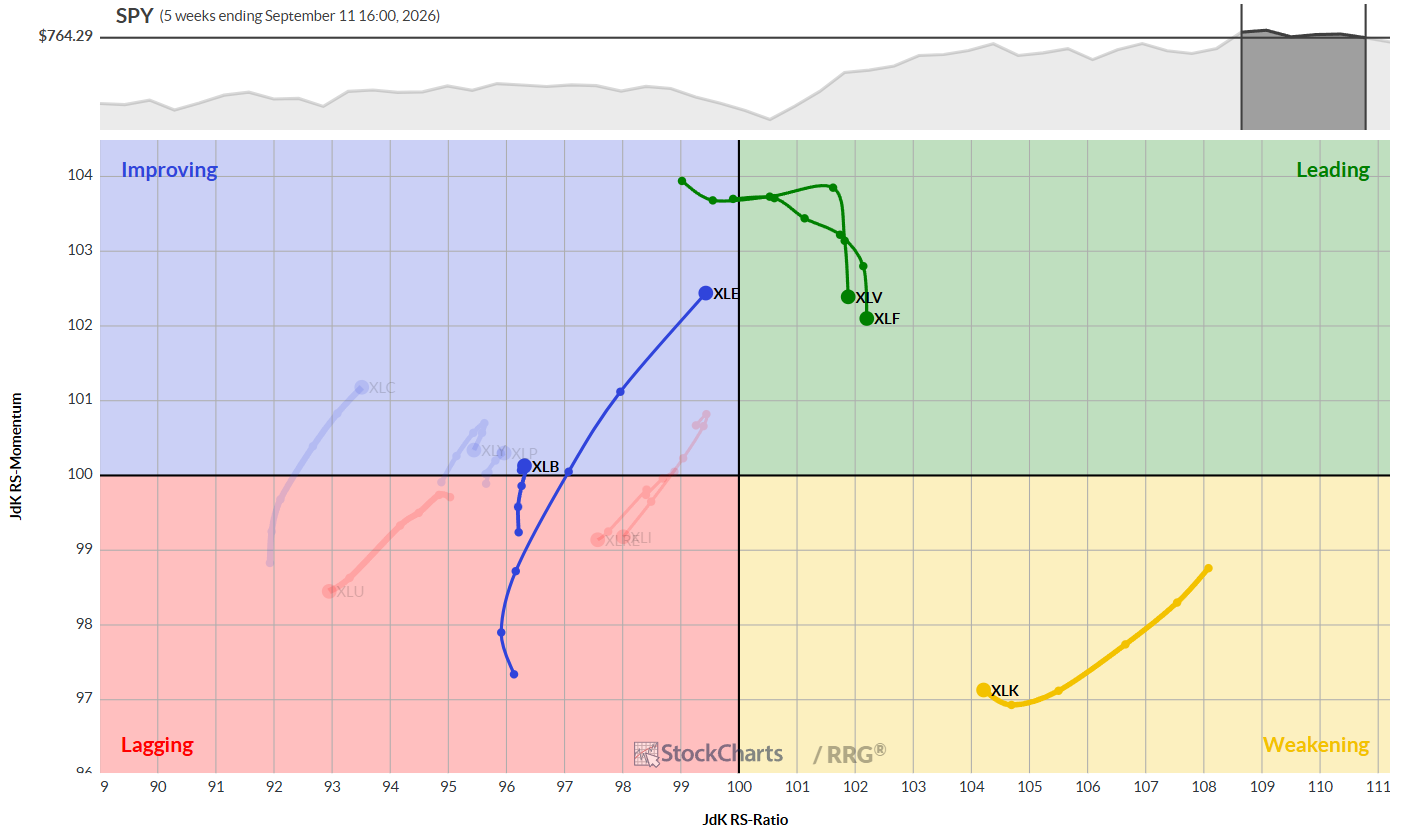
The positioning of the top five sectors at the end of last week is not materially changed since the previous observation. Technology is still inside the weakening quadrant but has started to curl back up slightly. It continues to have the highest reading on the RS-ratio scale. Health Care and Financials are inside the leading quadrant, losing relative momentum but stable on the RS-ratio scale. The best tail at the moment is Energy, which is showing a very long and powerful tail, rotating through improving and almost pushing into the leading quadrant. Materials have just crossed into the improving quadrant.
Daily RRG
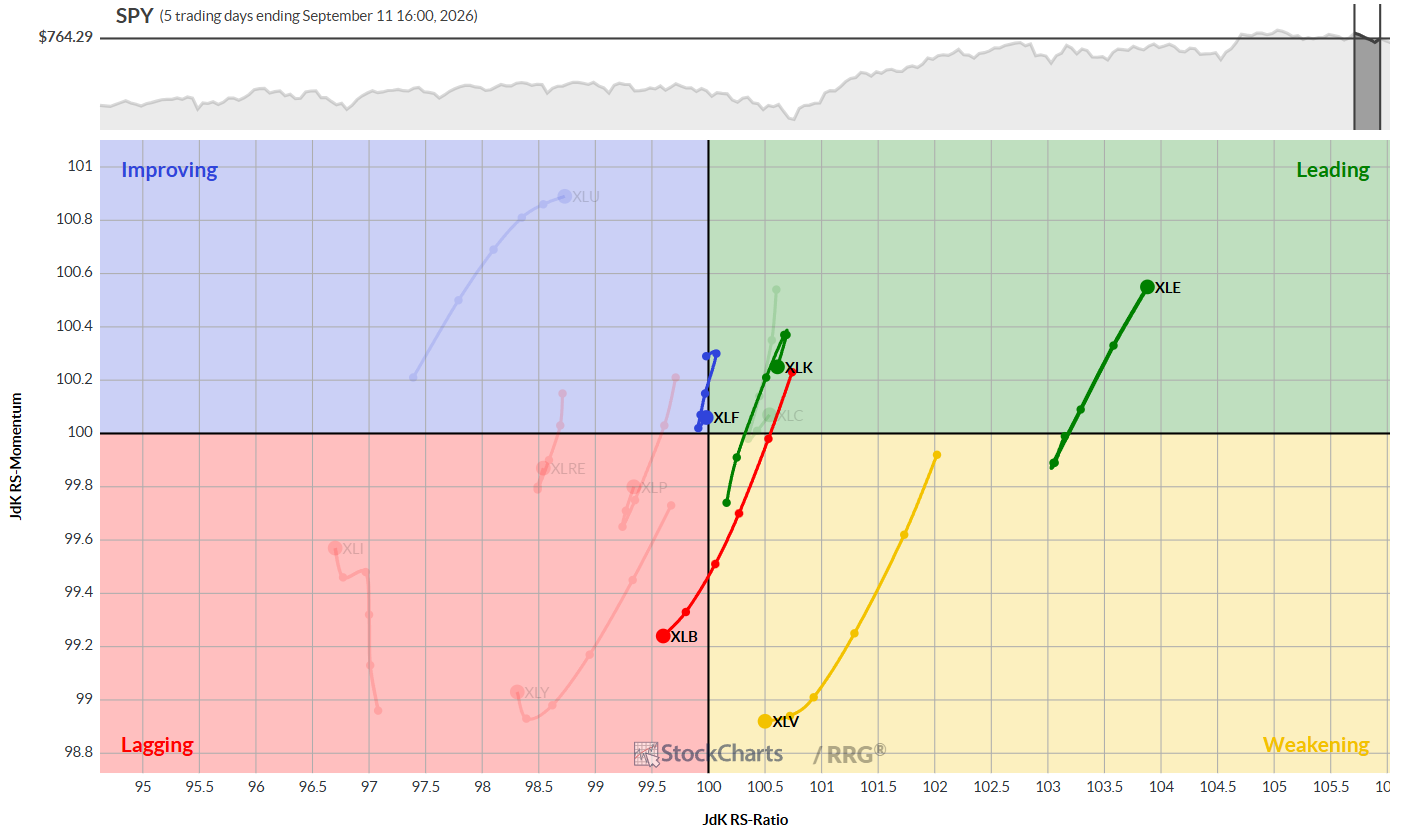
The daily RRG confirms the strength of the Energy sector, which is the strongest sector on the daily RRG, pushing deep into the leading quadrant at a strong heading. Technology moved back into the leading quadrant but showed a hook downward at the end of last week. Technology is already moving a little lower in the current week. Materials and Health Care are rotating through weakening, with materials already into the lagging quadrant at a negative heading. Financials is almost equal with the benchmark and makes up the fifth sector of the top five.
Sector Highlights
Technology
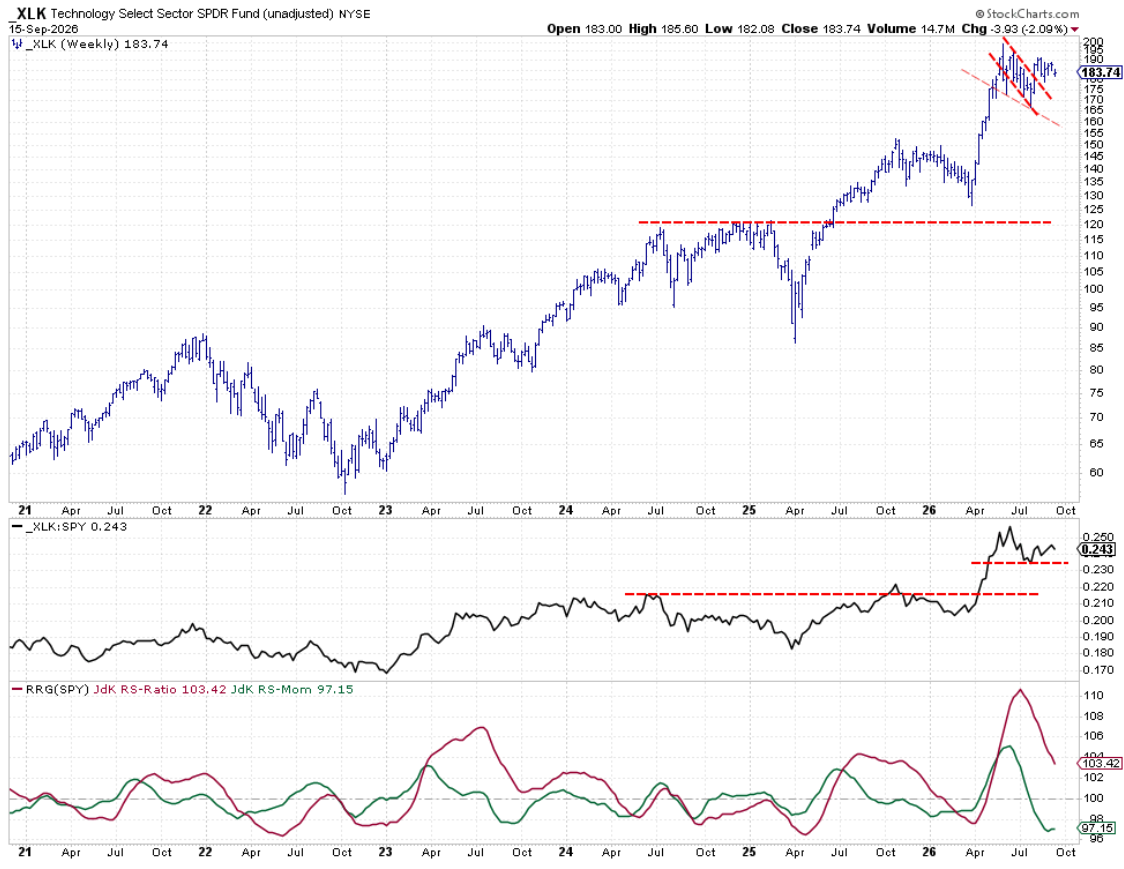
The Technology sector is stabilizing after breaking out of that flag-like pattern. The expected follow-through after the breakout has not materialized, so that's now off the table. Overhead resistance is building up between 190 and 195 for XLK. The good news is we're still above the falling resistance line, which is now starting to serve as support. The raw relative strength line is holding above its last low, which is promising, especially because the RRG lines, and particularly the RS-ratio line, have room above the 100 level. Further improvement in raw relative strength will likely cause upward momentum to pick up and keep the RS-ratio line above 100, which would trigger a new relative up leg for Technology.
Energy
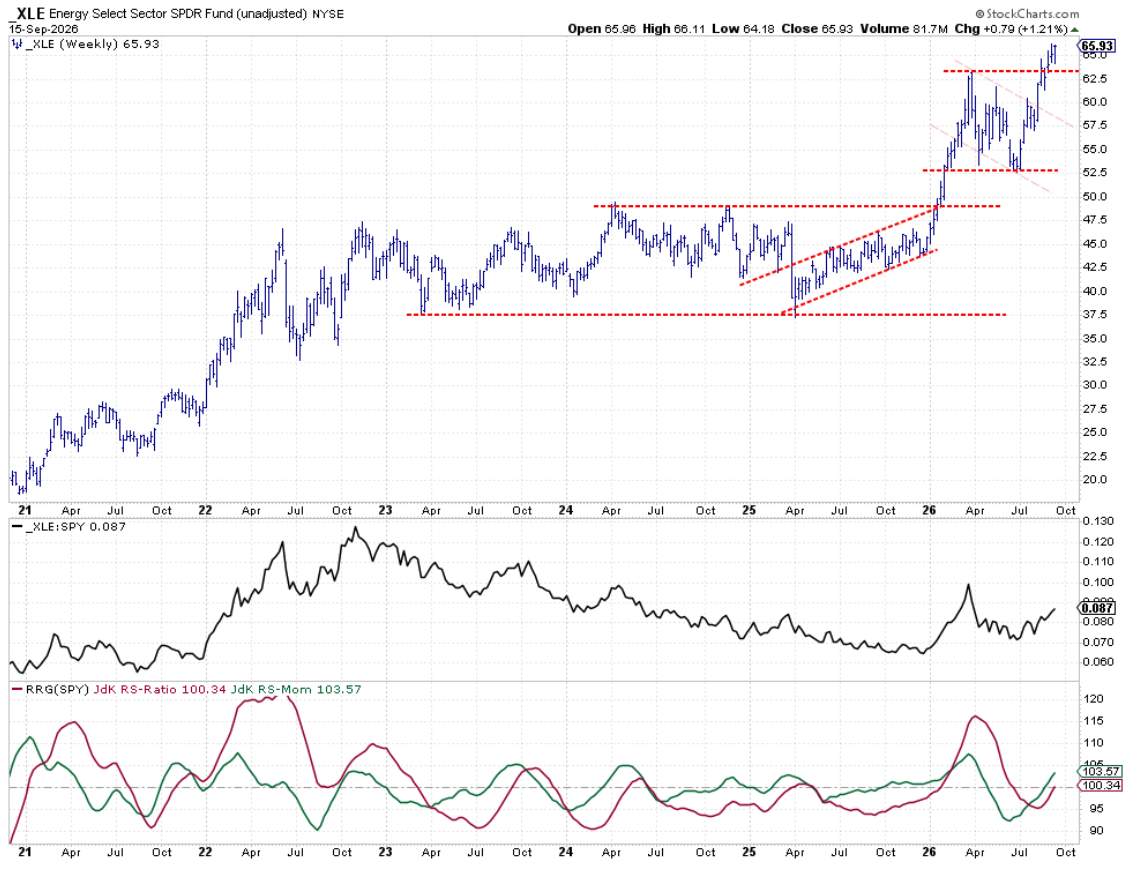
The Energy sector is now clearing its overhead resistance, which it broke three weeks ago, resulting in a further rise of relative strength. This is pulling both RRG lines above 100, pushing Energy into the leading quadrant and making it one of the stronger sectors at the moment.
Health Care
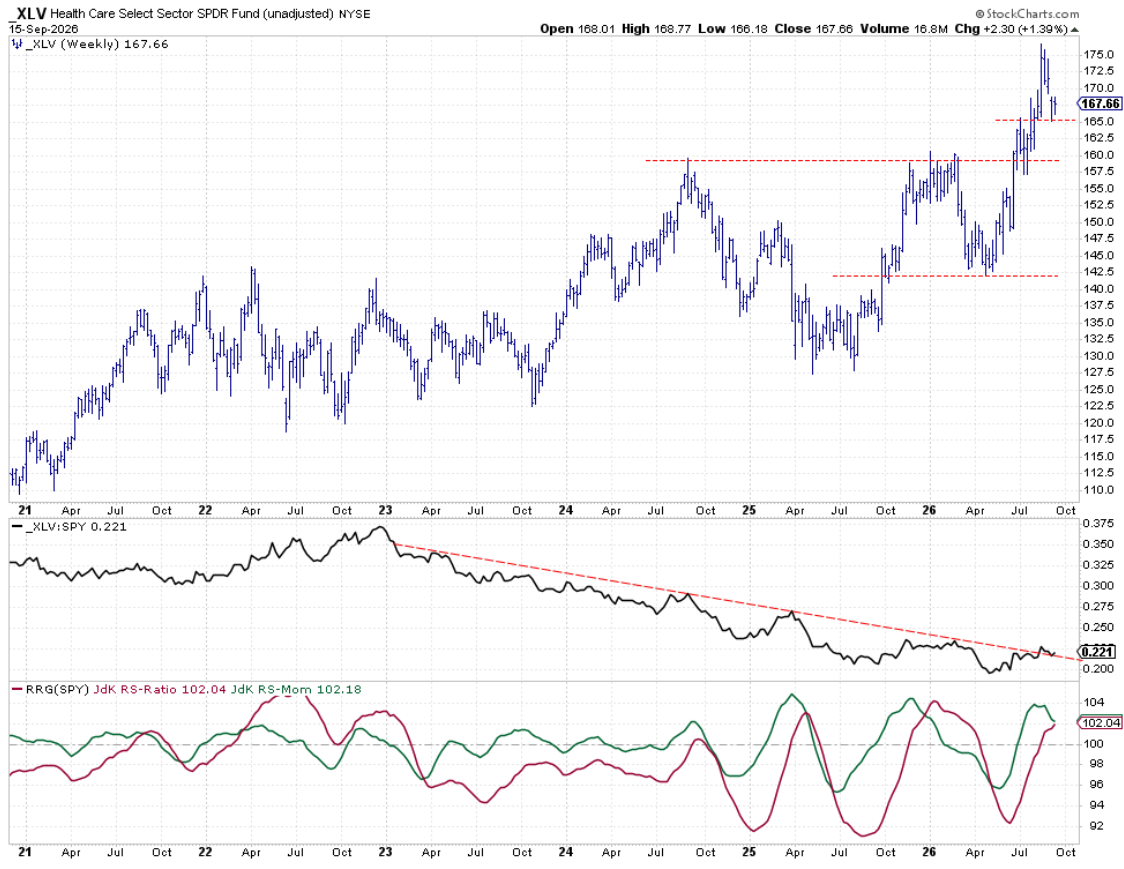
Health Care has found support around 165, which is the peak from the start of July. It looks like we're holding above the previous falling resistance line in the raw RS chart, which is now expected to serve as support. We need a bit more relative strength in the coming weeks to keep both RRG lines above 100, especially the RS-momentum line, to keep the RS-ratio line above 100 and the tail inside the leading quadrant.
Financials
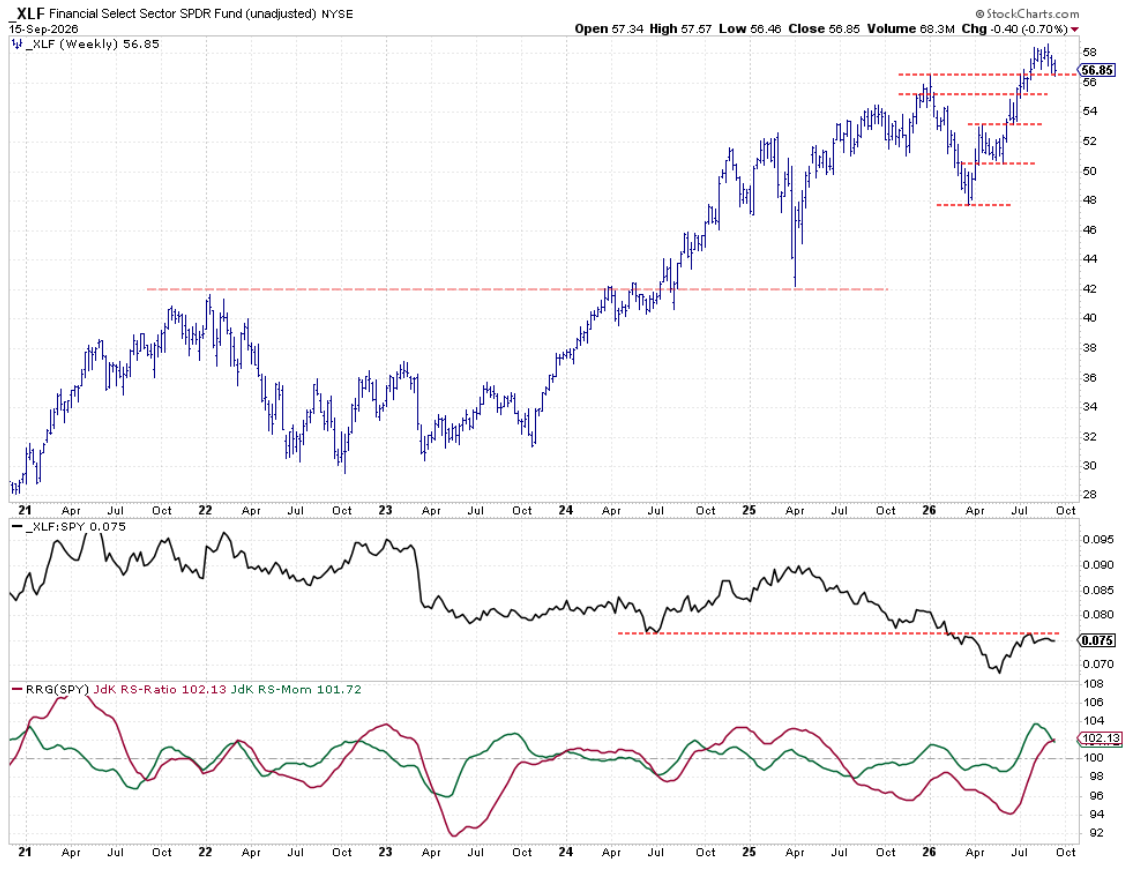
Financials is struggling in terms of relative strength. We still haven't broken through the overhead barrier from the July 2024 low. The price chart is holding up well at support around 55.50. As long as the price holds there, raw relative strength will have the opportunity to improve and hopefully push above the overhead barrier that's been holding down relative strength over the last few weeks.
Materials
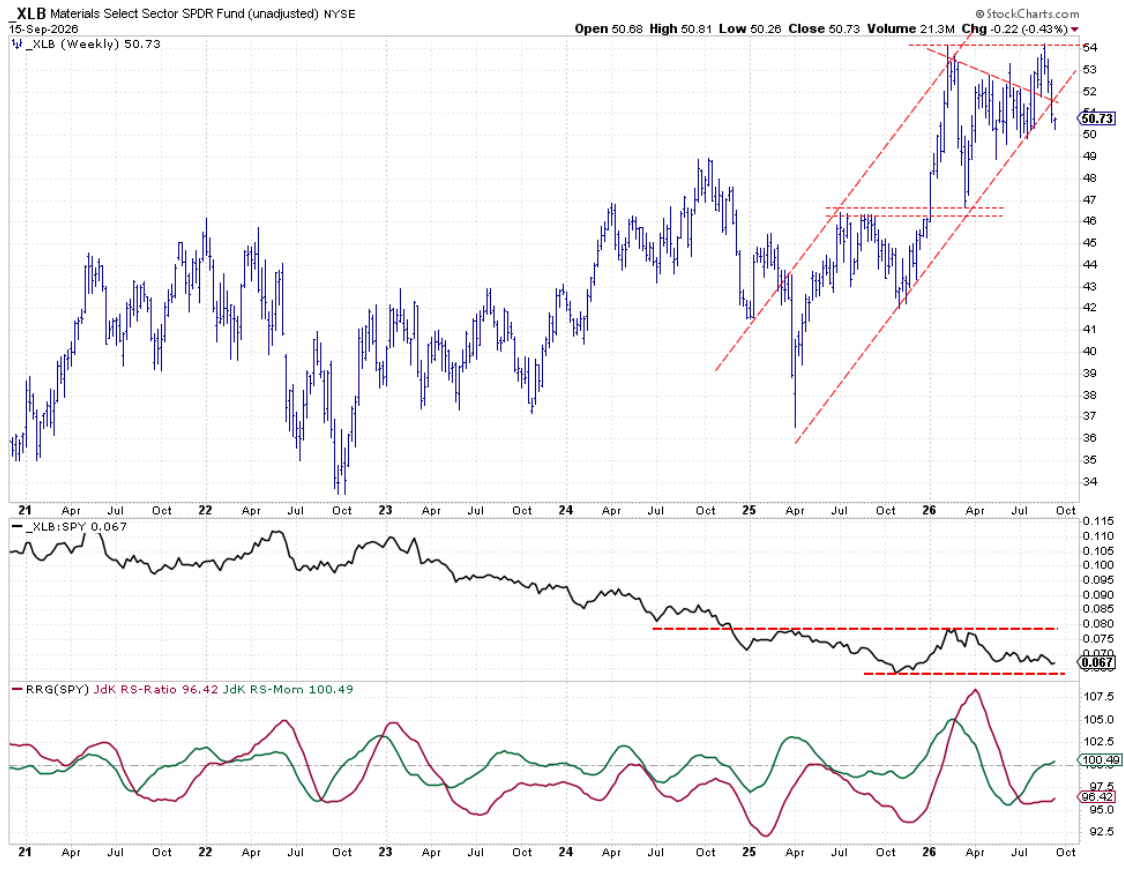
On the price chart, Materials is breaking out of the rising channel and below the long-rising support line that started back in April 2025. The relative strength line is moving sideways. There are two ranges, one very narrow (not labeled), and the dashed lines show the sideways movement of the relative strength line of materials versus SPY. This sideways movement is causing relative momentum to slow down around 100, meaning there's no momentum at all. It's the middle of the graph and is also slowing the rise of the RS-ratio. With price breaking below that support level, if the break accelerates the decline, it could impact the relative strength of materials versus SPY. If that happens, the materials sector is at risk of dropping out of the top five.
Portfolio Performance
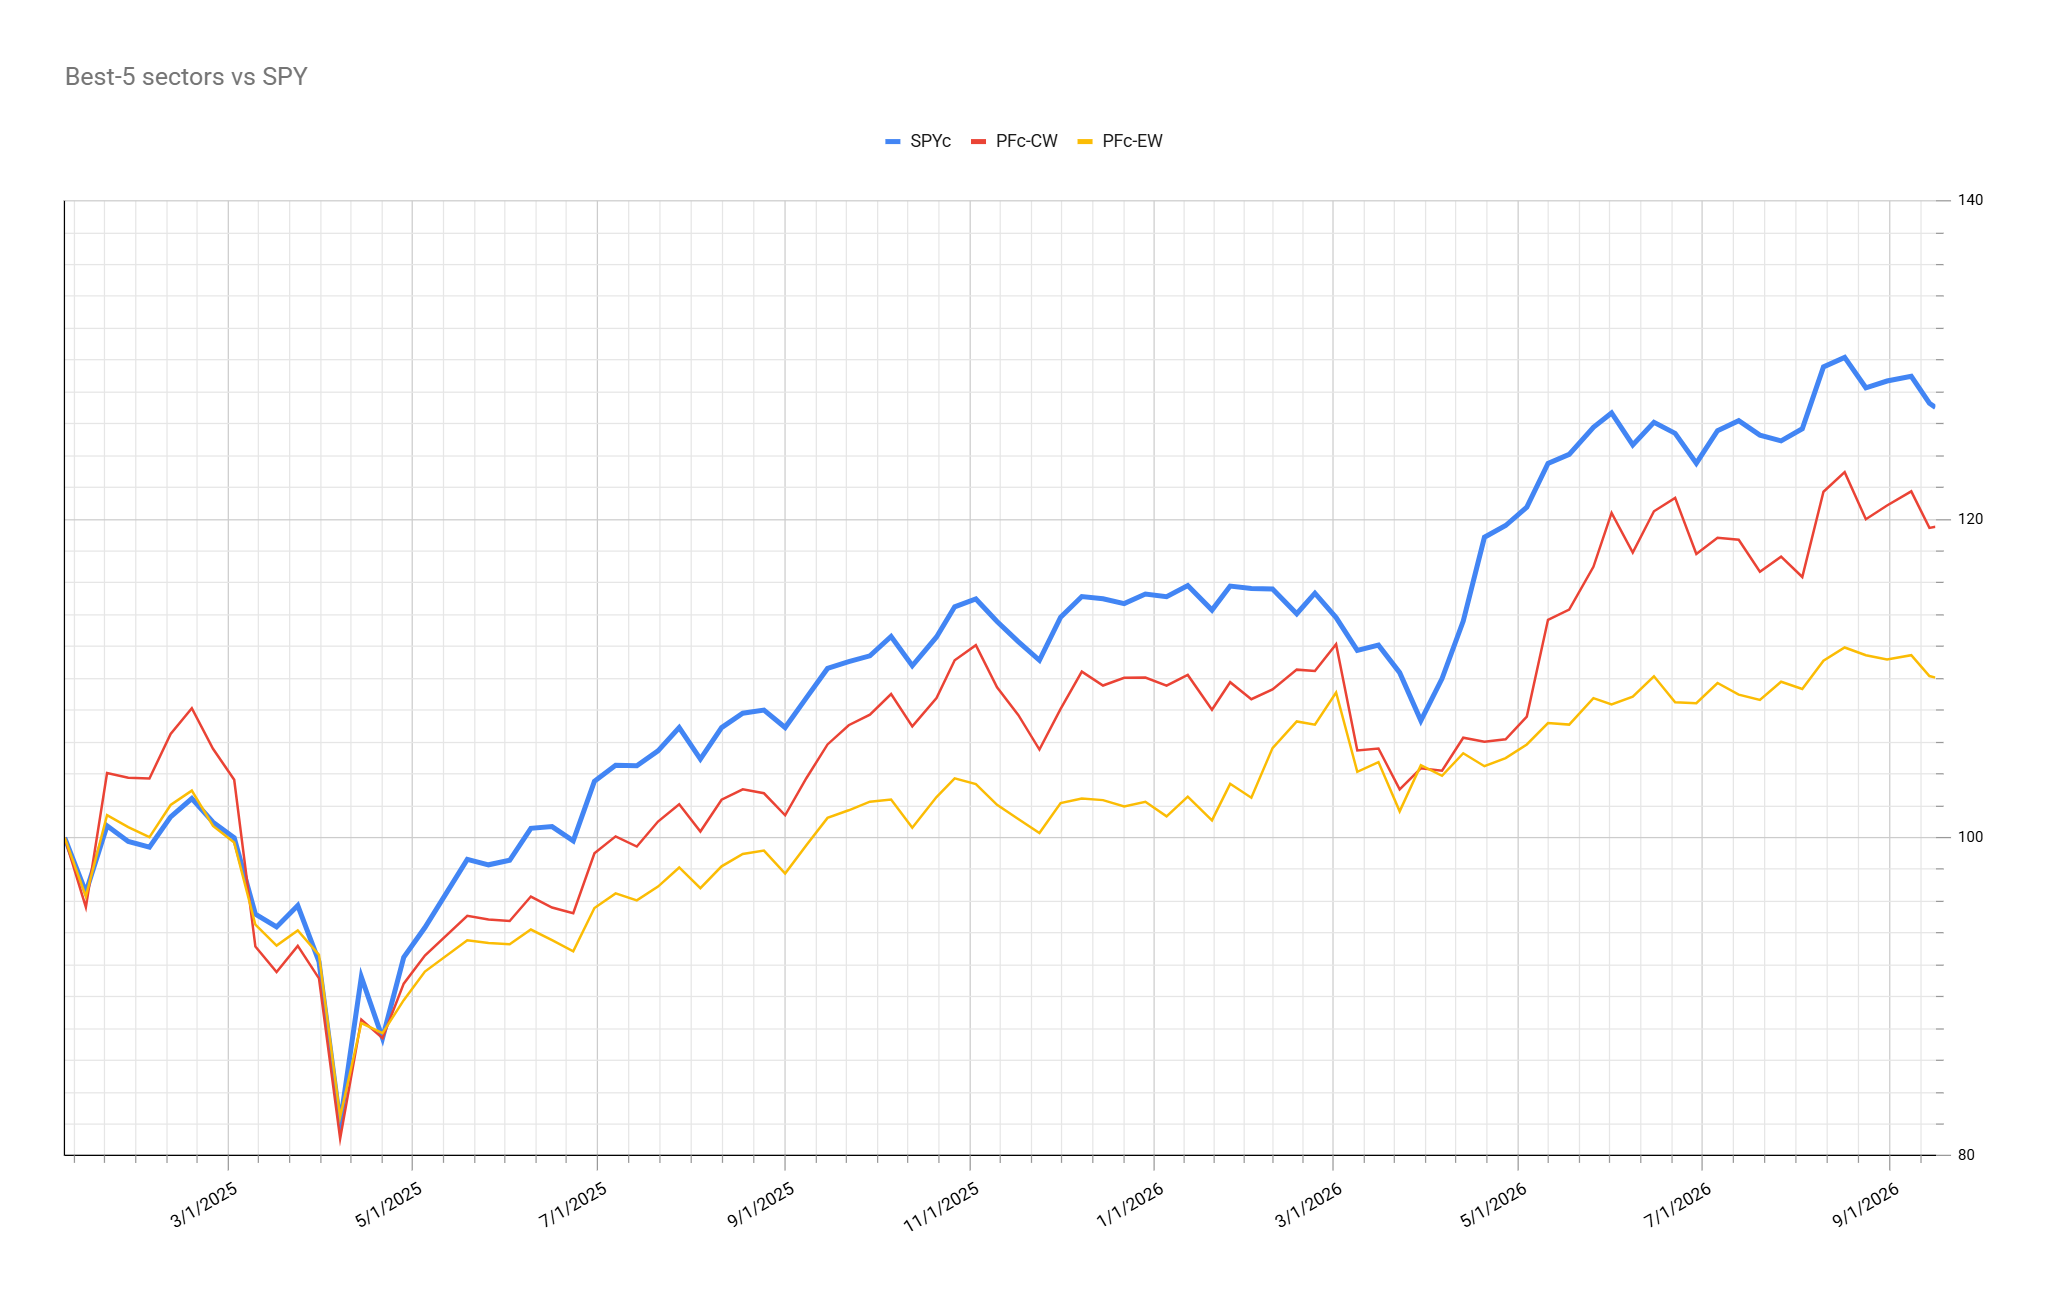
With the weak performance of Technology last week, the gap widened by about 60 basis points. We ended the week at 7.8% behind the S&P 500 since inception, moving lower from 7.2% the previous week. We'll monitor the performance of the top five sectors going forward and see if the strategy can catch up with SPY. Let's see if that happens before the end of the year.
#StayAlert --Julius